Corporate | Global
We are Shaping the Future!Showcasing Success Stories as We Innovate for a Sustainable Tomorrow
OMRON’s Approach to Connecting Business Decisions and Operational Improvements On-Site
Why is digital transformation (DX) so difficult in manufacturing sites?
The answer lies in the challenge of integrating IT with OT (operational technology, or factory-floor data). By leveraging AI to connect on-site operations and management through data, OMRON is working to achieve both a seamless, uninterrupted production system and a fast and efficient management cycle. We asked Kenta Yamakawa of the Advanced Solution Division, Industrial Automation Company, OMRON Corporation, to explain OMRON’s vision and approach to IT-OT integration.
INDEX
OMRON provides a wide range of control devices that support factory automation worldwide, including sensors, controllers, and robots. We have also developed deep expertise in handling OT data, the data generated by the physical operation of manufacturing facilities and equipment under actual conditions. This goes beyond simply controlling machines. By integrating the real-world data generated on the manufacturing floor with the IT systems that companies use to manage their operations, we help optimize business performance. Using insights cultivated through the co-creation of solutions with numerous customers, I would like to share our perspective on what meaningful transformation through IT-OT integration looks like in practice.
Why is IT-OT integration becoming increasingly important today? The answer can be traced back to OMRON founder Kazuma Tateishi’s future prediction theory known as SINIC theory.
According to this theory, society is currently in a transitional period toward an “Autonomous Society,” where people and machines work together in ideal harmony. Kazuma Tateishi once said, “To the machine, the work of the machine; to humankind, the thrill of unfettered creativity.” To address major social challenges such as aging populations and labor shortages, AI can assist people by making autonomous, data-driven decisions. Humans and robots can work collaboratively. OMRON believes the time has come to bring this vision to life through autonomous factories, where people can consistently achieve successful results without uncertainty.
This is not merely an idealistic vision. It is also a core strategy within OMRON’s new medium-term roadmap, SF 2nd Stage, launched this fiscal year. Integrating IT and OT to directly connect business decision-making and operational improvement is the very essence of OMRON’s “GEMBA DX.”
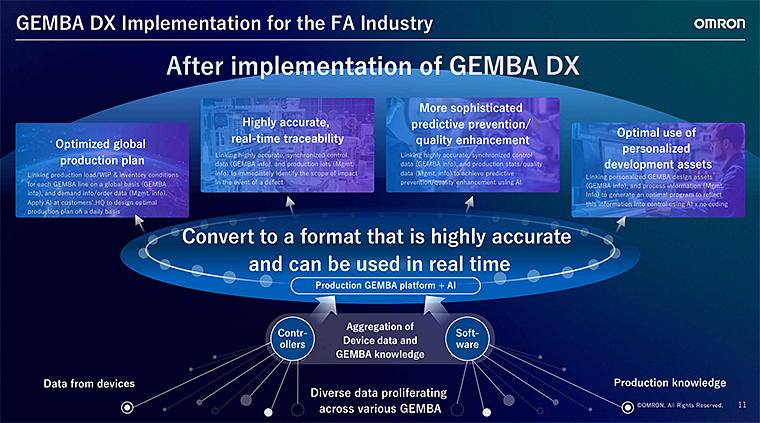
By combining a wide range of business data together with the high-quality on-site data collected from the sensors and control devices that are OMRON’s key strength, and by applying the on-site expertise we have cultivated over many years, we transform data into meaningful insights. This enables faster, more accurate decision-making and more effective resolution of on-site challenges. Even in rapidly changing market environments, this approach helps manufacturers strengthen and sustain trusted relationships with their customers. We are convinced that this represents the future of manufacturing: a next-generation model capable of overcoming uncertainty.
Yet despite its importance, why has IT-OT integration not advanced further? Why do factory operations often remain a black box despite significant investments in IT systems? Through discussions with a wide range of customers, OMRON has identified several underlying factors that continue to hinder progress in IT-OT integration. Let’s look at these now.
In the executive (IT) layer, information is often fragmented, causing decision-making to lag behind actual business conditions. Within the management layer, teams are caught between planning and reality, relying on manual data aggregation in Excel and monthly reporting processes. As a result, real-time visibility and timely decision-making remain difficult to achieve. In the on-site layer, years of incremental improvements implemented independently across operations have led to data being managed separately across systems, creating widespread silos.
This situation was not created intentionally. Rather, it stems from the different paths of evolution taken by IT and OT, each shaped by its own business culture, data requirements, and operating environments. As a result, these differences have become a barrier to optimal and agile decision-making.
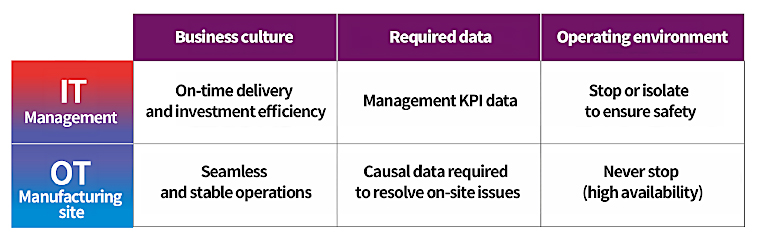
So how can we overcome the divide between IT and OT, two domains that have evolved independently?
OMRON’s answer is to establish data as a common language and create a seamless connection between IT and OT. Rather than forcing either side to adopt the other’s approach, we believe the operating environments and cultures of both domains should be respected, while integrating data in a way that is both flexible and robust. That’s the kind of approach we need. This diagram illustrates the future state OMRON aims to achieve through IT-OT integration.
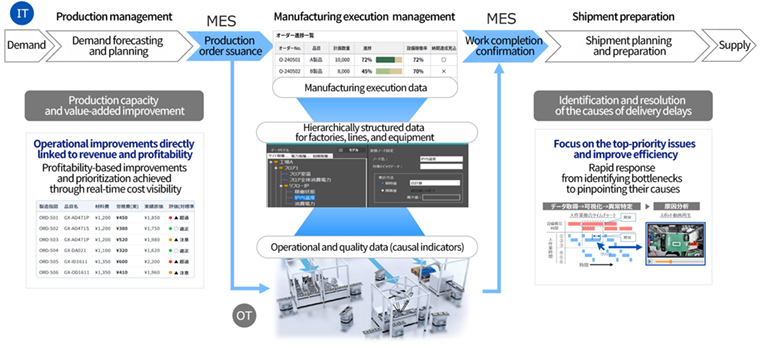
First, processes that have traditionally been fragmented across IT layer are connected through an end-to-end solution, spanning everything from production planning to manufacturing execution management and shipment preparation. Physical material handling and line control processes on the OT side are integrated as well. This enables a seamless, uninterrupted production system. Even when changing operating conditions create gaps between plans and actual performance, on-site teams can respond flexibly and minimize deviations in real time.
Next, we turn to manufacturing execution data, which are collected by systems such as MES (Manufacturing Execution Systems: used for real-time management and optimization of manufacturing operations) and serve as a results-based indicator. These data are linked with operational and quality data captured from PLCs, sensors, cameras, and other devices, which represent the underlying causes behind production outcomes at the process, line, and equipment levels. By storing and managing these linked datasets hierarchically and centrally through edge systems, manufacturers can, for example, quickly extract data related to a specific process associated with an order that has experienced a delivery delay and rapidly investigate the root cause.
Similarly, manufacturers can gain real-time visibility into profitability at both the product and process levels by linking operational data with cost information from enterprise resource planning (ERP) systems. These are core systems that integrate and manage manufacturing operations such as production, inventory, procurement, sales, and accounting, and support timely decision-making and efficiency improvements. This integration allows on-site teams to assess the priority and impact of improvement initiatives as they work. In other words, they can quickly identify the factors linked with manufacturing results, implement targeted improvements, and support accurate investment decisions based on real-world information from the factory floor. This realizes a fast and efficient improvement cycle. By leveraging these existing IT and OT assets, business decisions and operational improvements can be directly connected through a next-generation data platform. This is the world of IT-OT integration envisioned by OMRON.
In many manufacturing sites, labor costs and workforce hours remained a black box, making it difficult to recognize a decline in profitability until month-end figures were compiled. Standard costing had become a mere formality, leaving investment decisions heavily dependent on experience.
To address this challenge, we established real-time integration between data from production equipment and human operations on the manufacturing floor and cost information stored in an upper-level ERP system, a core system which integrates and manages manufacturing operations such as production, inventory, procurement, sales, and accounting, enabling greater operational efficiency and faster decision-making. This enables manufacturers to instantly visualize the gap between actual and standard costs at the order level, without waiting for month-end closing processes. As a result, improvement initiatives can be prioritized based on their impact on profitability.
We have also achieved highly accurate tracking of human work, one of the most difficult types of OT data to digitalize.
On the manufacturing floor, minor operational mistakes and small delays have traditionally been managed through individual experience and subjective observation. In many cases, quality issues are not discovered until defects flow downstream, resulting in scrap losses. To address this challenge, we introduced a mechanism that automatically captures data, visualizes operations, and identifies anomalies, giving a visible structure to tacit on-site knowledge. This enables manufacturers to quantitatively identify losses that might otherwise go unnoticed.
This image shows the actual interface of a human work analysis tool currently being used in production environments.
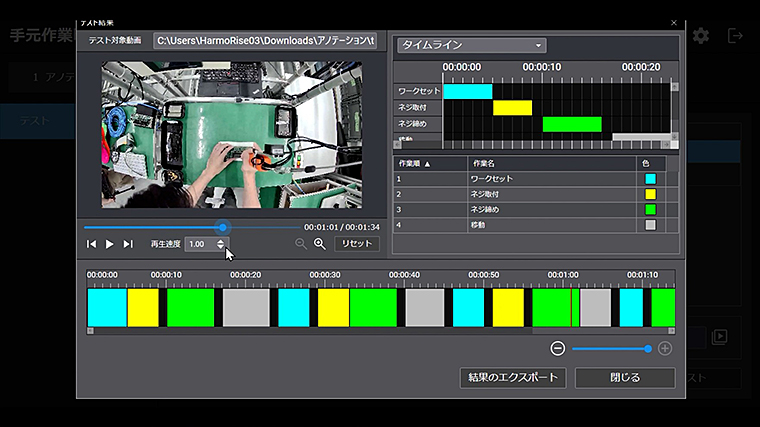
Equipped with video analytics capabilities, the tool provides support from automatic detection of work activities based on user-defined task elements through to graphical analysis and visualization. This makes it easier to identify bottlenecks. For example, by comparing standard times with actual performance times, even inexperienced personnel can identify processes with significant room for improvement at a glance.
However, in practice, quality degradation and unplanned downtime often occur even when individual data points remain within normal ranges. Multiple factors can interact in complex ways, making such issues easy to miss. We developed a mechanism that organizes equipment operating data and process-related causal data into a hierarchical structure and enriched with contextual meaning in alignment with the production process itself, in other words, the flow of materials through production. This makes highly accurate trend monitoring possible, enabling the early detection of subtle abnormalities that cannot be identified through single-threshold management alone, and helping avoid unexpected disruptions.
The overall risk trend and the deterioration score of factor correlations can be monitored in real time on a single screen. As shown in the display, the graph at the top visualizes the combined effect of correlations among multiple factors as a single trend, capturing relationships that cannot be identified by looking only at the behavior of the individual factors displayed below.
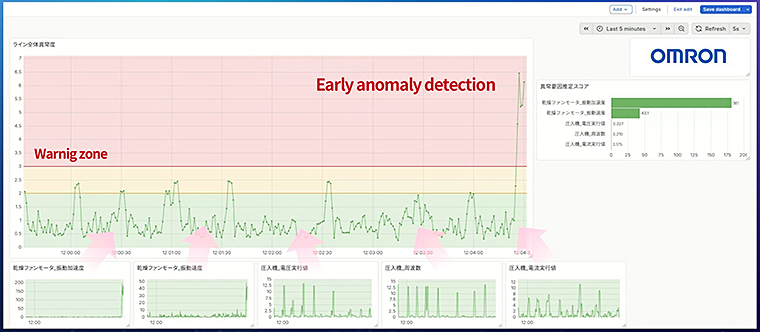
When the level of abnormality exceeds a predefined warning threshold, an alert is immediately generated and the factors with the greatest impact are prioritized. Furthermore, by relating the timing of trend increases, operational events, and other information to past incidents, the system supports more efficient recovery.
The core technology that will take these capabilities even further and support a fast and efficient management cycle is “i-BELT Hub,” a next-generation data platform that achieves integration of IT and OT.
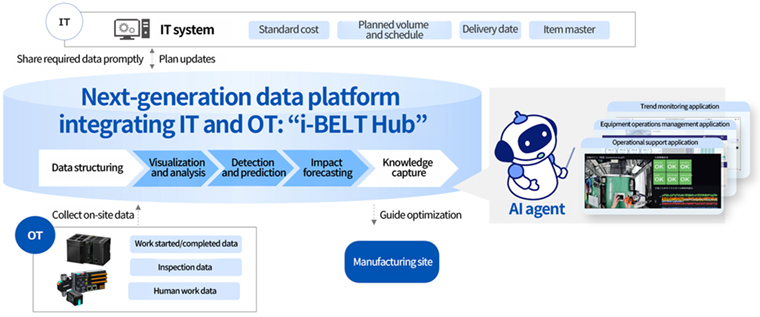
Data collected from the manufacturing floor, including work start and completion data, inspection data, and human work data, is organized into a hierarchical structure and enriched with contextual meaning. Because this highly refined data platform provides a common foundation, AI agents operating on top of it can accurately understand on-site conditions and provide optimal guidance by intelligently leveraging the various operational support applications and other features provided within the platform.
Here is an example of a business workflow streamlined through the support of AI agents.
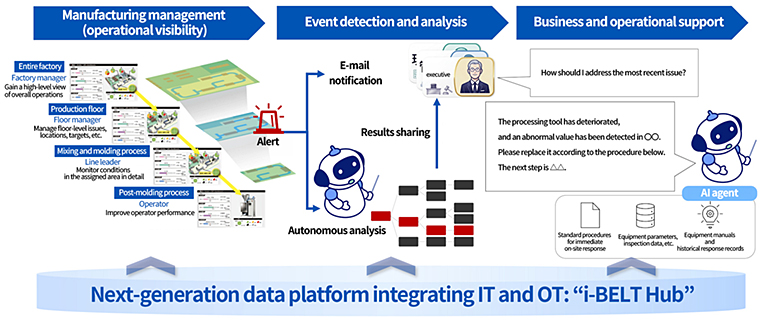
Because data are organized hierarchically and contextualized according to the needs of different users, events and changes can be viewed from the perspective of each organizational layer. As a result, operators, supervisors, and factory managers can all analyze and review the information they need using the same centrally managed data source.
Furthermore, AI agents can dynamically access and utilize different applications required for different purposes. This enables end-to-end support that extends beyond the needs of a single organizational layer, providing guidance on the optimal course of action including related departments and downstream processes.
In this way, by leveraging “i-BELT Hub,” the next-generation data platform integrating IT and OT, organizations can achieve efficient decision-making and response across different organizational layers using the same data. The platform can also orchestrate the use of a range of operational support applications, helping optimize related business processes as a whole. In addition, the comprehensive system architecture enables substantial reductions in cost and improvements in efficiency compared with ad hoc, point-by-point approaches to data utilization. We have begun initiatives to validate the benefits of this system and are also exploring phased implementation at actual manufacturing sites.
At OMRON, we embrace the philosophy expressed by our founder Kazuma Tateishi: “To the machine, the work of the machine; to humankind, the thrill of unfettered creativity.” In line with this belief, we view tasks such as data collection, aggregation, and the excessive operational oversight that often stems from uncertainty as work that should be entrusted to machines. The true value of IT-OT integration lies in enabling organizations to move beyond reacting to opaque conditions across management and factory operations. Instead, it creates an environment where everyone, from the manufacturing floor to the executive level, is connected through a common language: data. This allows people to focus on discussing more creative improvements.
What lies beyond IT-OT integration for OMRON is not simply better business performance. It is the vision of a society in which every individual can work in a more human and creative way. For the smiles of our customers, and for the future we share. We hope to take on this new manufacturing challenge together with you, one step at a time.