By Area
Sales by Area
Net Sales
’╝łMillions of Yen’╝ē
| FY2020 | FY2021 | FY2022 | FY2023 | FY2024 | |
|---|---|---|---|---|---|
| Japan | 276,612 | 289,896 | 326,539 | 348,998 | 355,104 |
| Americas | 63,642 | 78,296 | 104,299 | 86,149 | 84,745 |
| Europe | 101,479 | 120,423 | 140,137 | 128,929 | 119,387 |
| Greater China | 151,167 | 196,351 | 211,528 | 171,932 | 159,967 |
| Asia Pacific | 61,763 | 76,924 | 92,874 | 80,675 | 80,528 |
| Direct Exports | 866 | 1,037 | 705 | 2,078 | 2,022 |
| Total | 655,529 | 762,927 | 876,082 | 818,761 | 801,753 |
Japan Net sales, of total: 44%
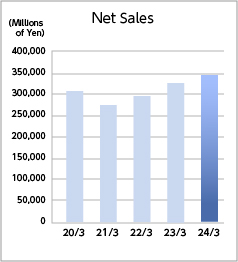
’╝łMillions of Yen’╝ē
| FY2020 | FY2021 | FY2022 | FY2023 | FY2024 | |
|---|---|---|---|---|---|
| Net Sales | 276,612 | 289,896 | 326,539 | 348,998 | 355,104 |
Americas Net sales, of total: 11%
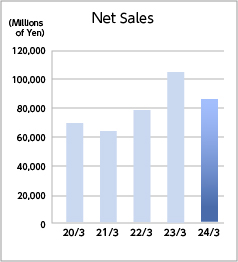
’╝łMillions of Yen’╝ē
| FY2020 | FY2021 | FY2022 | FY2023 | FY2024 | |
|---|---|---|---|---|---|
| Net Sales | 63,642 | 78,296 | 104,299 | 86,149 | 84,745 |
Europe
Net sales, of total: 15%
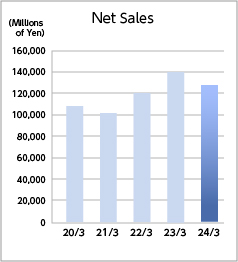
’╝łMillions of Yen’╝ē
| FY2020 | FY2021 | FY2022 | FY2023 | FY2024 | |
|---|---|---|---|---|---|
| Net Sales | 101,479 | 120,423 | 140,137 | 128,929 | 119,387 |
Greater China Net sales, of total: 20%
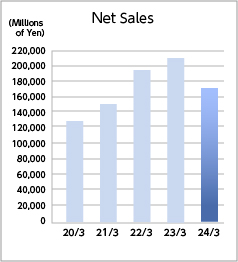
’╝łMillions of Yen’╝ē
| FY2020 | FY2021 | FY2022 | FY2023 | FY2024 | |
|---|---|---|---|---|---|
| Net Sales | 151,167 | 196,351 | 211,528 | 171,932 | 159,967 |
Asia Pacific Net sales, of total: 10%
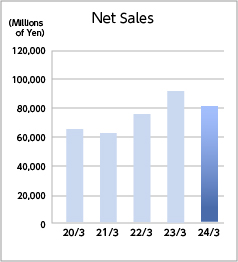
’╝łMillions of Yen’╝ē
| FY2020 | FY2021 | FY2022 | FY2023 | FY2024 | |
|---|---|---|---|---|---|
| Net Sales | 61,763 | 76,924 | 92,874 | 80,675 | 80,528 |
Direct Exports Net sales, of total: 0%
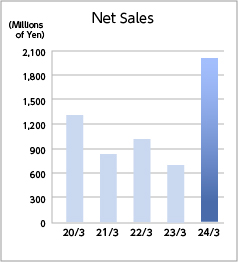
’╝łMillions of Yen’╝ē
| FY2020 | FY2021 | FY2022 | FY2023 | FY2024 | |
|---|---|---|---|---|---|
| Net Sales | 866 | 1,037 | 705 | 2,078 | 2,022 |
