


Method for Identifying the Order of Moving Packages Using UHF RFID Reception Waveforms
- UHF RFID
- Estimation Algorithm
- Traceability
- Luggage Management
- Automation
Today, in-factory logistics faces the social challenge of labor shortages while the importance of parts management increases. To address this, automation aimed at reducing human labor is being implemented, and there is a demand for advanced material and parts management system functions on-site. To meet these requirements, UHF RFID is particularly expected to be an effective means of ensuring traceability with the advantage of being able to individually and simultaneously read responses from multiple RF tags located several to dozens of meters away from the antenna. However, current UHF RFID functions can only recognize the presence of packages. The order of RF tags is difficult to determine.
This paper proposes a technique for high-precision RF tag identification by analyzing the time waveform of RF tag responses obtained with a general-purpose UHF RFID system and its waveform characteristics. A practical evaluation yielded promising results for practical application in such tasks as determining the order of packages flowing in sequence at intervals of several hundred millimeters on a conveyor. Future applications to other use cases are also anticipated.
1. Introduction
In recent years, manufacturing industries have been accelerating their shift toward multi-product, small-lot production to accommodate increasingly complex, highly functional products and diversified consumer needs. The need to manage vast quantities of highly diverse parts has continued to grow accordingly. These trends, combined with the broader social challenge of labor shortages in an aging society with a declining birthrate, have made it increasingly difficult to hire and retain the personnel responsible for parts-and-materials control. Under these circumstances, manufacturers have been working to streamline intra-factory (i.e., in-house) logistics manpower through task automation. Typical target tasks include sorting parts and materials on conveyors, managing warehouse inventory, and controlling incoming and outgoing inventory at loading docks. In particular, demand has been rising for parts-and-materials control systems with enhanced functionality.
One effective way to meet these requirements is to enhance the accurate sequence recognition of queued parts and materials by using installed detection sensors and/or sensor-equipped search-and-find robots. Such capabilities enable mechanized sorting in the downstream processes and allow the system to identify pairings between boxes and the corresponding shelved parts or materials, thereby reducing search time during stocktaking or picking. In addition, the ability to determine the direction of parts-and-materials flows through gates would enable the system to distinguish incoming from outgoing flows automatically.
However, the methods currently available to ensure in-factory traceability rely on individual identification systems, such as code readers or radio-frequency identification (RFID). Among these options, code readers are widely adopted because of their low initial cost and high coding flexibility. Nevertheless, when the task involves scanning information on packages moving along conveyors, optical code readers must be installed around the packages from multiple directions. These configurations lead to such challenges as an increased number of required readers and time-consuming parameter tuning during installation.
Meanwhile, RFID systems are available in several frequency bands, including low-frequency (LF), high-frequency (HF), and ultra-high-frequency (UHF). Their main components are a reader/writer (R/W) and antennas connected to it. In addition, these systems require RF tags and involve a higher initial cost than code readers. However, UHF-band RFID systems can batch-scan replies from multiple RF tags located several to several tens of meters ahead of the antennas. As a result, UHF-band RFID systems can be installed and tuned more easily and with fewer antennas than code readers or even LF- and HF-band RFID systems. They are therefore considered promising as an effective means of ensuring traceability.
However, with their current functionality, UHF-band RFID systems can recognize only the presence of packages within their detection range and have difficulty accurately identifying the order of queued parts and materials. To address this issue, we devised and developed an algorithm capable of recognizing the order of RF-tagged packages queued up within a desired detection range by analyzing their time-waveform data. These time-waveform data consist of replies temporarily stored upon reception from RF-tagged packages via antennas connected to the UHF-band RFID system. This algorithm would not only reduce the number of antennas and the time required for antenna tuning (two challenges that code readers cannot resolve) but also recognize the order of queued parts and materials, enabling such applications as scanning information on packages moving along conveyors.
This paper presents the principles of the aforementioned algorithm and its effects when applied. Section 2 outlines the technical challenges in the assumed/premised use cases and the corresponding countermeasures. Section 3 proposes a detection system, presents its operating principles along with the algorithm used in it, and discusses the results of simulations conducted to validate its effectiveness. Section 4 examines the effects of applying the algorithm to measured time-waveform data from moving RF tags in a simulated environment, assuming a use case in which parts and materials are sorted on conveyors. Finally, section 5 provides an afterword that considers future development prospects and the remaining challenges.
2. Assumed use case, technical challenge, and solution
This section presents the assumed use cases for UHF-band RFID applications and the technical challenges they entail with the aim of streamlining in-house logistics and inventory control. Typical use cases include monitoring the packages moving on conveyors via antennas installed nearby and sorting them with high accuracy to prevent misdelivery, monitoring packages stored on shelves via antennas-equipped robots to reduce search time during picking or stocktaking, and monitoring the moving direction of packages via antennas installed at gates to enable the distinction between incoming and outgoing flows.
The challenge common to these use cases is to go beyond merely recognizing the presence of packages and instead identify the exact order of packages lined up within a desired detection range. This challenge can be restated as a technical problem: determining the distance to an RF tag from the antenna and the time at which the tag passes directly in front of the antenna. Solving this problem would enable the sequence recognition of packages moving in single file within the target area or of packages lined up on shelves using data obtained from only one reader/writer unit and its antennas. Moreover, arranging two sets of reader/writer and antenna side by side would make it possible to monitor both the moving direction and speed of RF-tagged packages by measuring the time difference of the same tag’s passage between the two antennas.
To address this technical challenge, methods have been proposed for UHF-band RFID that rely on localization using angle-of-arrival (AoA) information from multiple array antennas1) or ranging using frequency-sweep phase data that can be combined with AoA information for localization2). However, array antennas increase system size, are costly and physically large, and therefore impractical for many applications. In addition, the Japan Radio Law imposes legal limits on frequency-sweep width, restricting achievable distance accuracy to approximately 1 m, which is insufficient for addressing the challenge described above.
Accordingly, a method is needed that can be implemented with a compact system configuration consisting of a reader/writer unit and antennas that enables distance and passage-time estimation with higher accuracy. To address this challenge, we propose a method for estimating distance and passage time based on the time-waveform characteristics obtained by detecting RF-tag replies over a given period using such a reader/writer and antenna set. In what follows, we examine whether the proposed method has the potential to solve this challenge.
This paper focuses specifically on sorting packages moving in file on a conveyor as its target use case. The following sections describe the technical investigation conducted to address the challenge in this and related scenarios. By presenting the obtained results, this paper aims to support the streamlining and automation of in-house logistics management.
3. Proposed method and validation of its effectiveness
3.1 Description of the principle
A UHF-band RFID system, configured as shown in Fig. 13), receives each RF tag’s reply through the antenna, mixes it with the outgoing signal inside the reader/writer, and outputs the result of this mixing as in-phase (I) and quadrature-phase (Q) component data. These data are then used to calculate the phase value (θ) by Eq. (1).
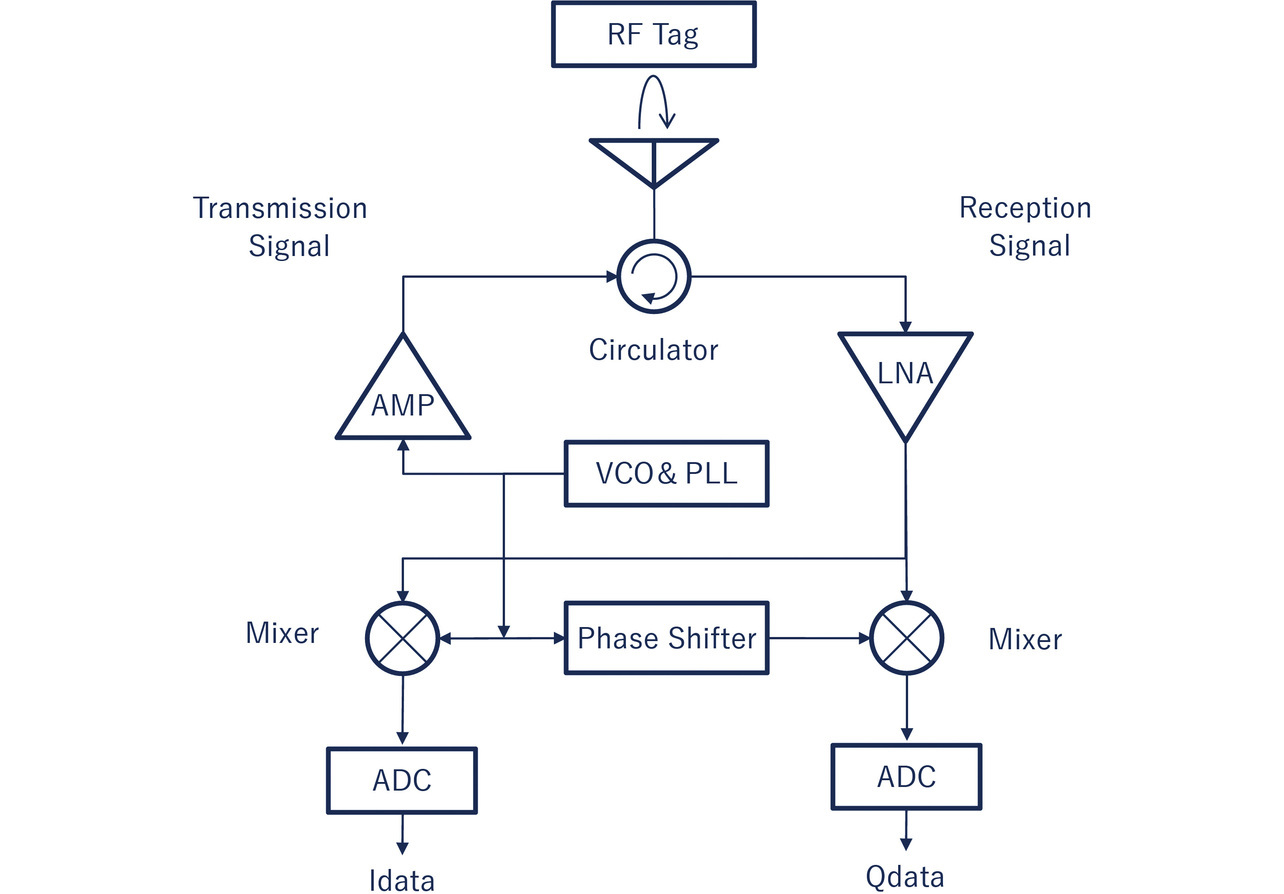
According to Eq. (1), the received phase data indicate how the incoming signal changes with reference to the outgoing signal and therefore vary in proportion to the RF tag-to-antenna distance.
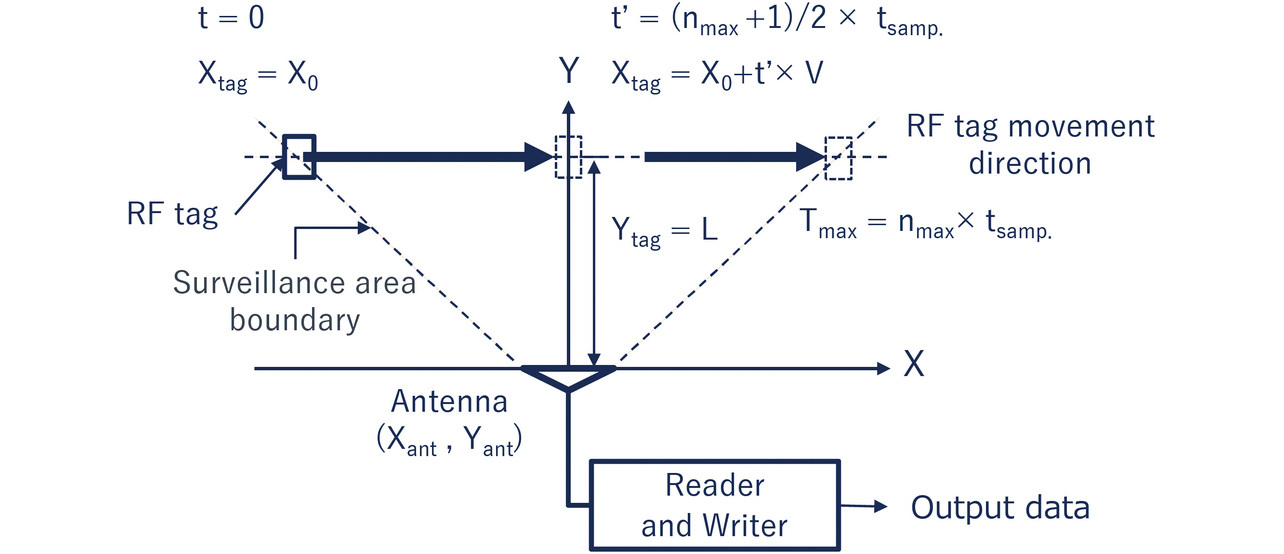
Next, the proposed method estimates the distance and the time at which the RF tag passes in front of the antenna based on the characteristics of the time waveform in the phase data. As shown in Fig. 2, when the data detection start point is X0, the RF tag moves across the antenna’s front at a constant speed V. During the RF tag’s movement, the phase decreases as the tag approaches the antenna and increases after the tag passes the antenna’s front. Note that Xtag and Ytag denote the position coordinates of the RF tag and Xant and Yant denote those of the antenna. Accordingly, the phase data associated with the detected RF-tag movement can be expressed by Eq. (2) below where λ is the wavelength at the operating frequency.
This sequence of processing satisfies Inequality (3) and Condition (4) where tsamp and n denote the data-sampling cycle and the number of samplings, respectively.
From the above, the time waveform takes a V-shape with its minimum phase occurring at the point of minimum distance. This time is given by ( where nmax is the maximum number of data samples obtained during fixed-time measurement).
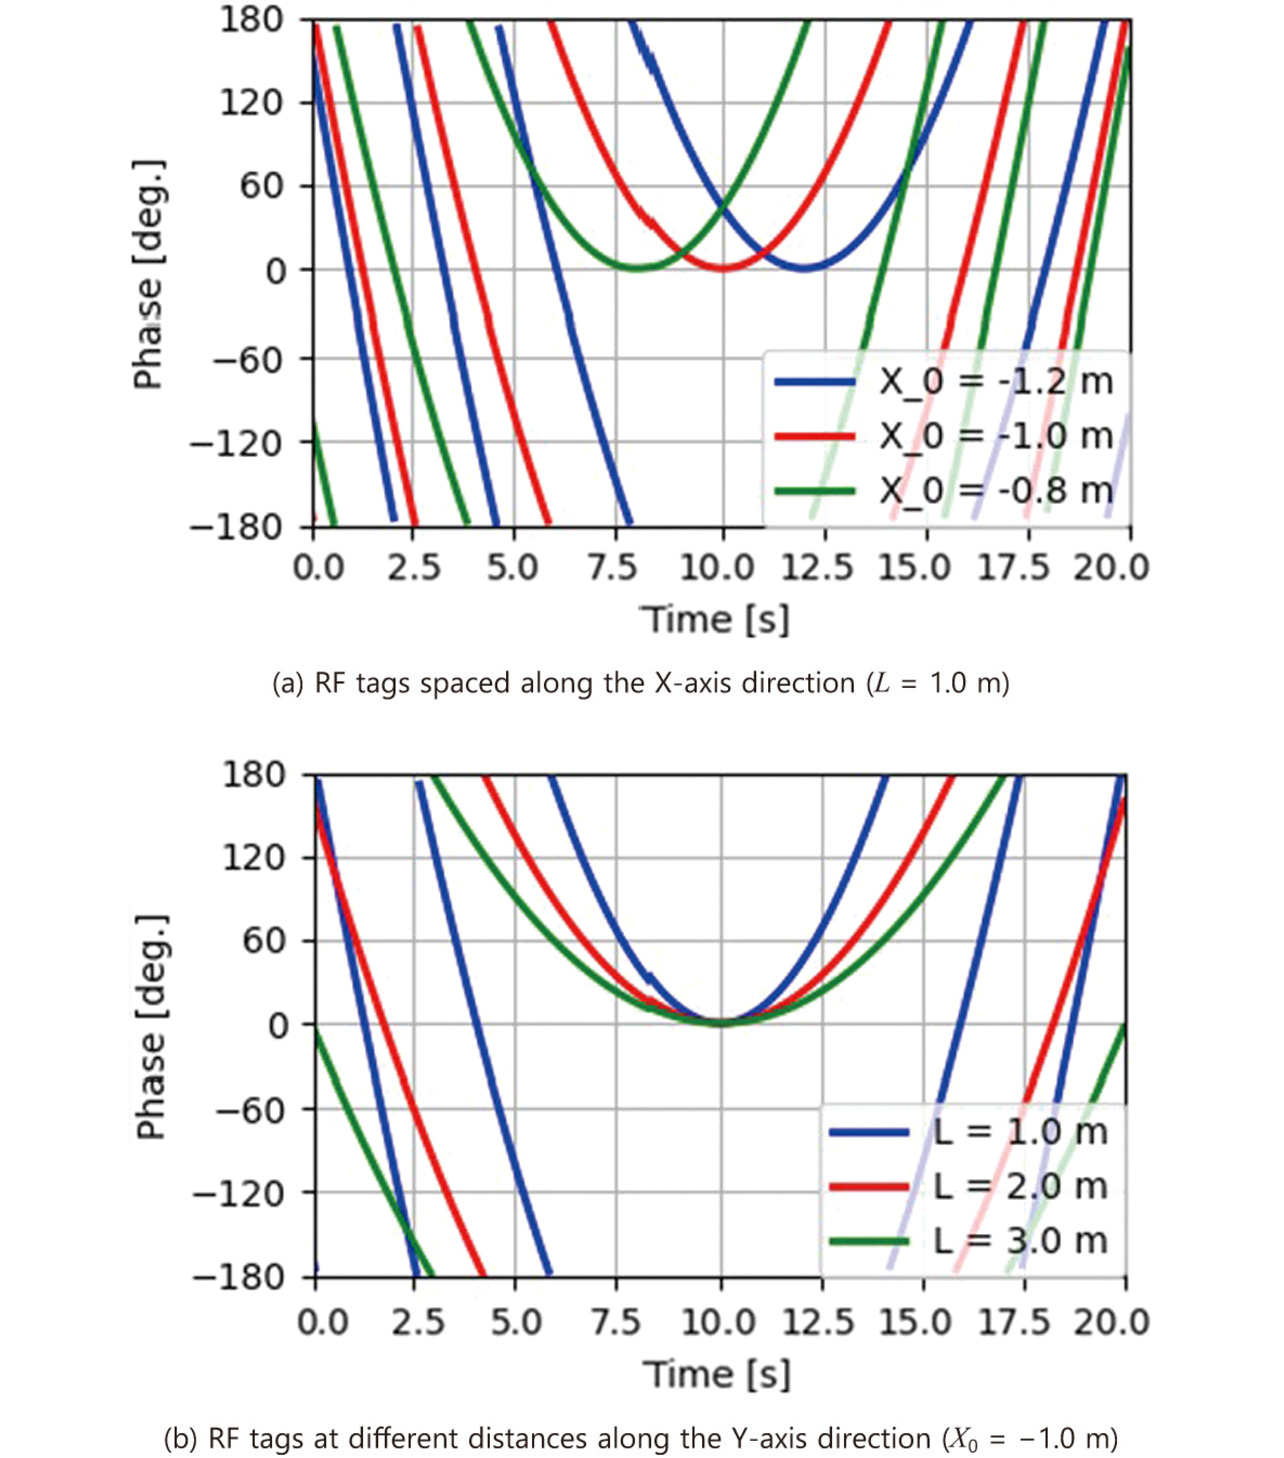
Fig. 3 shows the theoretical phase-data time waveforms calculated using Eqs. (2), (3), and (4) under the calculation conditions listed in Table 1. Figs. 3(a) and 3(b) illustrate representative examples in which one parameter is varied while the other is fixed; specifically, X0 is varied with L is fixed and vice versa.
| Parameter | Value |
|---|---|
| Frequency: f | 0.91675 GHz |
| Wavelength: λ | 0.327 m |
| RF tag moving speed: V | 0.1 m/sec |
| Antenna position: (Xant, Yant) | Xant: 0 m, Yant: 0 m |
| RF tag movement start point: (X0, Ytag = L) | X0: −1.2, −1.0, −0.8 m L: 1.0, 2.0, 3.0 m |
More specifically, Fig. 3(a) shows the phase-data time waveforms obtained when three RF tags are moved with their X0 values shifted in 20 cm increments. The measurement start points of the respective RF tags are X0 = –0.8 m, –1.0 m, and –1.2 m. With L fixed at 1.0 m and a movement speed of 0.1 m/s as specified in Table 1, the passage times t′ (the times of minimum phase) are 8, 10, and 12 seconds.
Fig. 3(b) shows the time-waveform variations when the minimum distance L is changed from 1.0 m to 3.0 m in 1.0 m increments. With X0 fixed at −1.0 m, the passage time t′ is 10 seconds.
The aperture angle of each V-shaped waveform widens as L increases. These results show that the time waveforms are distinctly characterized by the time at which the RF tag passes the antenna’s front and the minimum distance between the RF tag and the antenna. Based on this observation, we propose estimating the minimum distance L and the passage time t′ by analyzing the waveform shape detected when an RF tag passes in front of the antenna at a constant speed.
3.2 Proposed estimation method
In the proposed method for estimating the minimum RF-tag-to-antenna distance and the passage time, the time waveform calculated using the parameter conditions in Table 1 (from the previous subsection) is used as the reference waveform. The method computes the correlation between a reference waveform and a time waveform representing the received phase data, and estimates the parameter conditions as the passage time and the minimum distance at the time when the two waveforms exhibit the maximum correlation. The processing steps proceed according to the flow in Fig. 4. For the purpose here, we describe the flow, using as an example the results of the processing steps performed with the RF tag movement start point given as X0 = –1.0 m and L = 1.0 m under the conditions in Table 1 from Subsection 3.1.
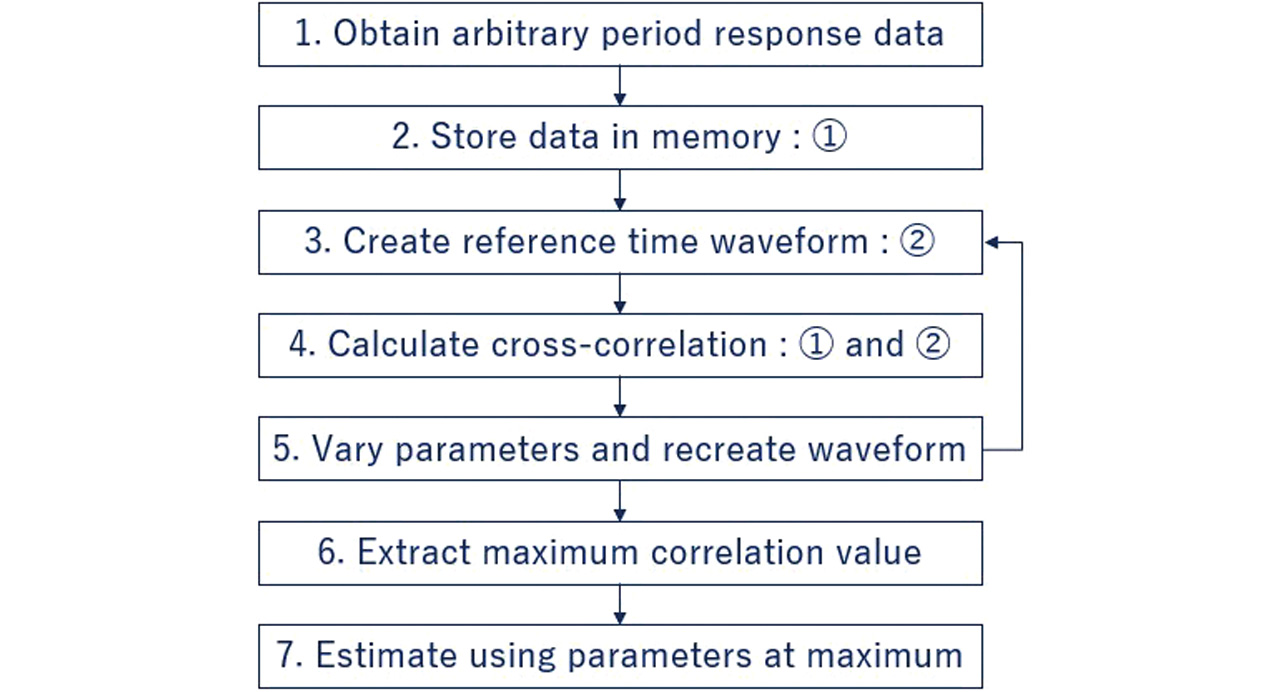
Replies from each moving RF tag are continuously received from the start of detection until the required number of samples is reached or exceeded. The phase data collected during the fixed measurement window are stored in memory (Steps 1 and 2 in Fig. 4). Next, the reference time waveforms shown in Fig. 3 are calculated on the basis of the minimum distance, the passage time, the known RF tag moving speed, and the reception period (Step 3 in Fig. 4). Each RF tag prepared here represents the simplest use case: constant-speed movement in a direction perpendicular to the antenna’s radiation direction. Reference waveforms may also be precomputed and stored in a database for direct loading after data acquisition.
Fig. 5 shows that the correlation between the received waveform and the reference waveform reaches a maximum at the RF tag’s actual passage time when the passage time is swept. Figs. 5(a)–5(c) show the overlays of the received time waveforms and the corresponding reference waveforms. Fig. 5(d) shows the relationship between passage time and correlation value obtained by calculating the correlation of the two waveforms4) using Eq. (5) as the passage time is swept (Step 4 in Fig. 4).
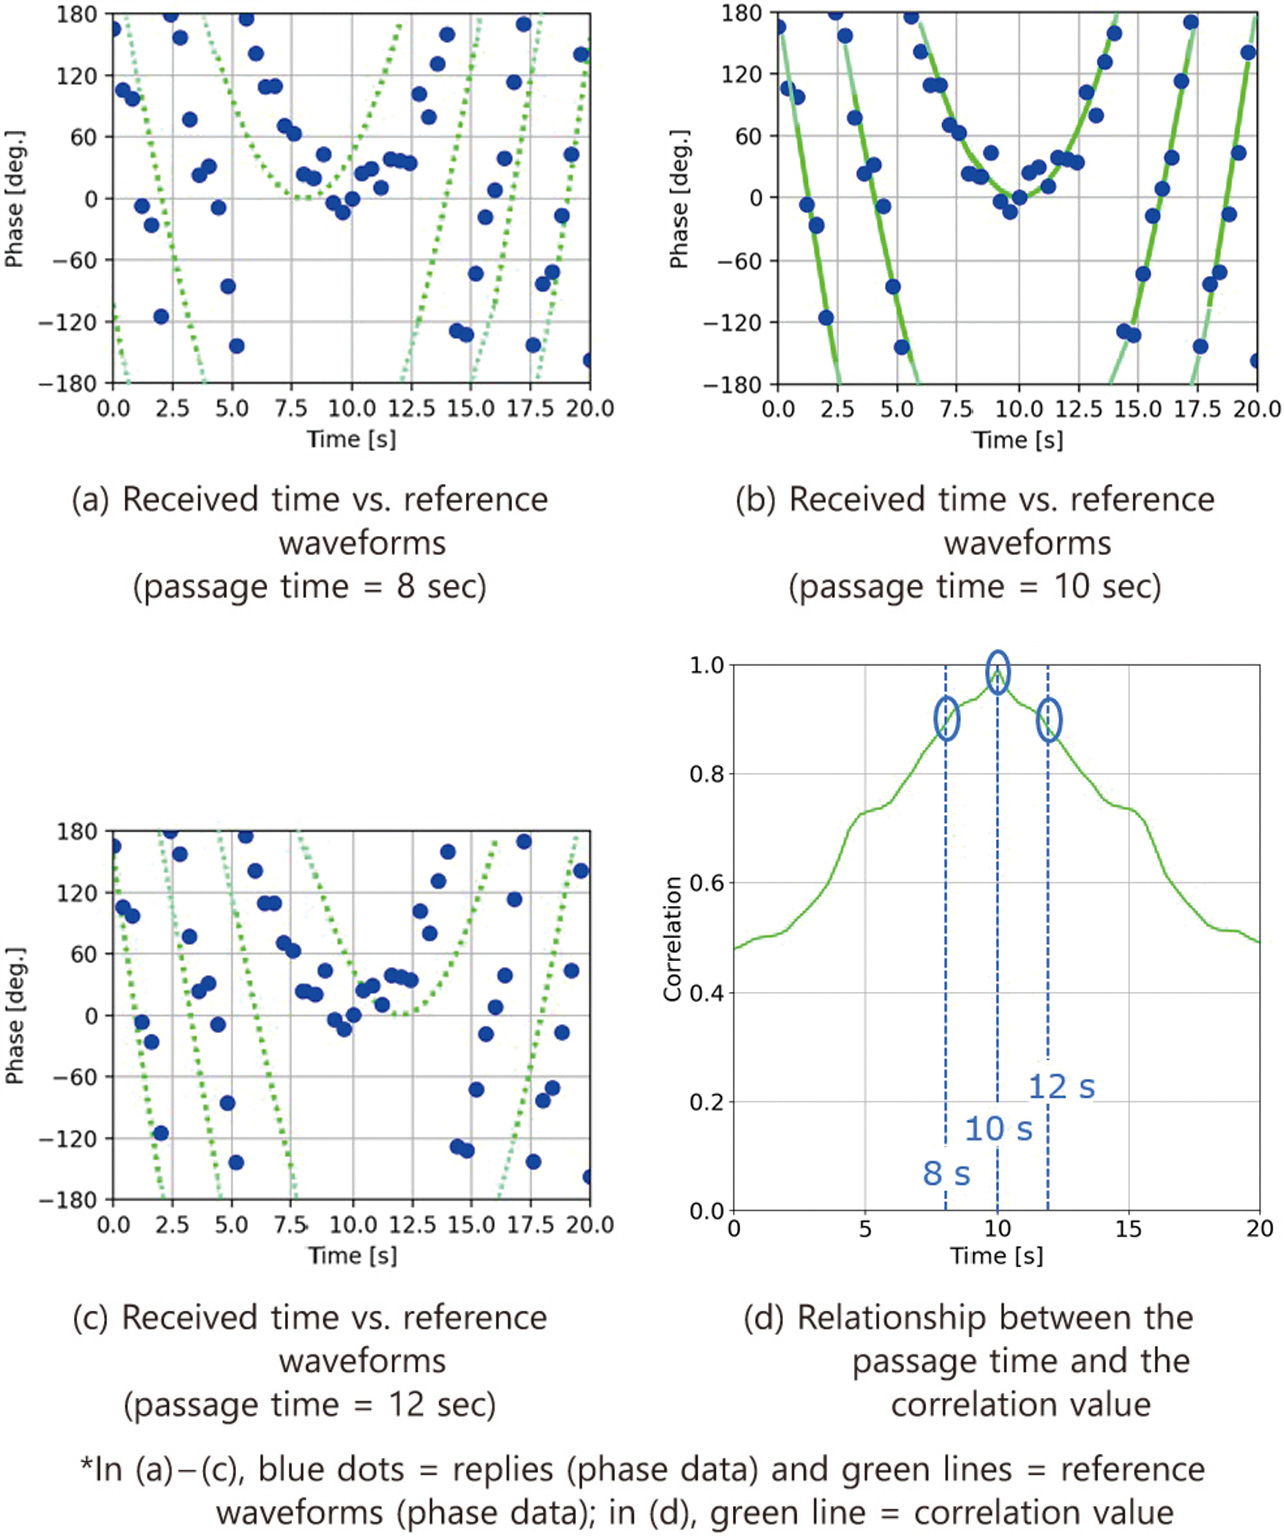
In Figs. 5(a)–5(d), the passage time at which the correlation value becomes maximal corresponds to the RF tag’s actual passage moment. The results confirm that the waveform at the 10-second passage time point in Fig. 5(b) best aligns with the received data.
The same procedure is performed while sweeping in the distance direction to obtain the maximum correlation value at each distance. Fig. 6 is a graph showing the resulting correlation values as a function of distance. Finally, the distance and passage time point most closely correlated are identified (Steps 5 and 6 in Fig. 4) and adopted as the estimates of the minimum RF tag-to-antenna distance and the tag’s passage time, respectively (Step 7 in Fig. 4). Using this flow, both quantities can be estimated from the time waveform.
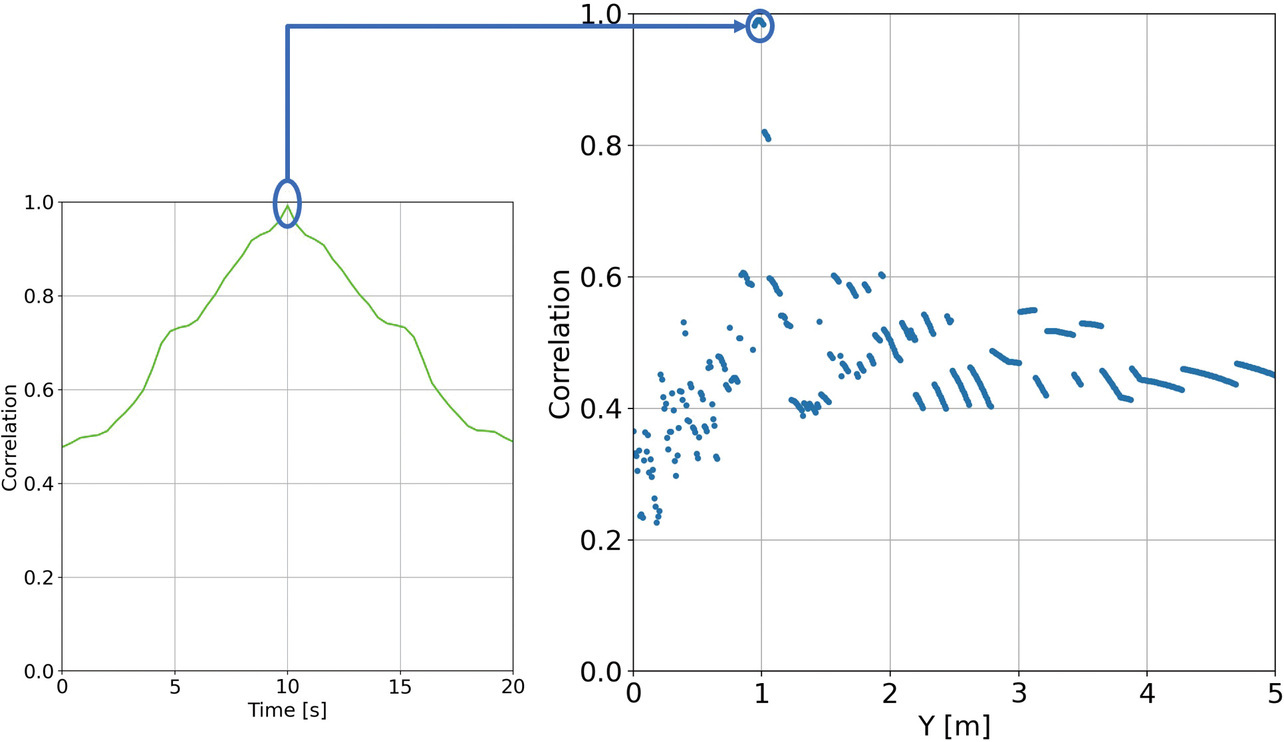
Meanwhile, as seen in Figs. 3 and 5, the phase data used thus far undergo inversion at ±180°, producing data discontinuities (hereafter referred to as “aliasing”). This aliasing causes discontinuities in the correlation values along the distance axis (labeled Y [m]) as shown in the right panel of Fig. 6, resulting in a pronounced drop in correlation. To remove these discontinuities, we used time waveforms representing the real- or imaginary-part data calculated using theoretically aliasing-free Eq. (6):
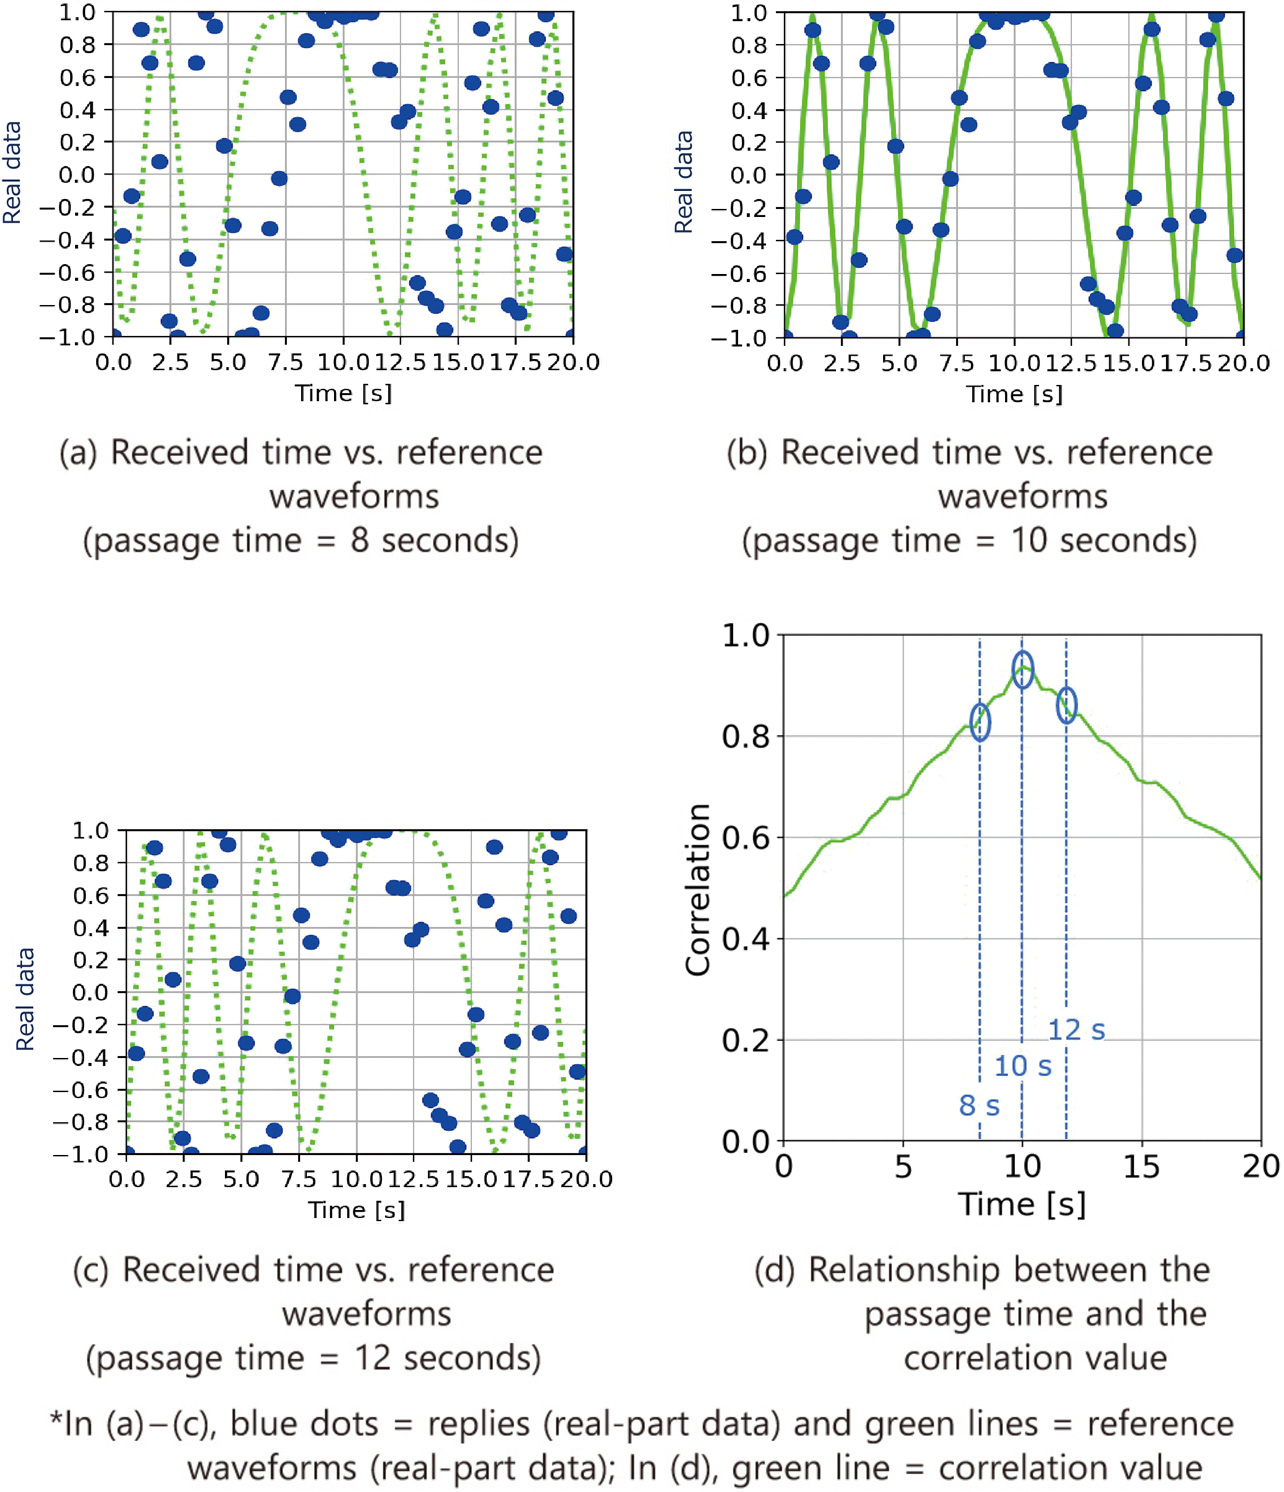
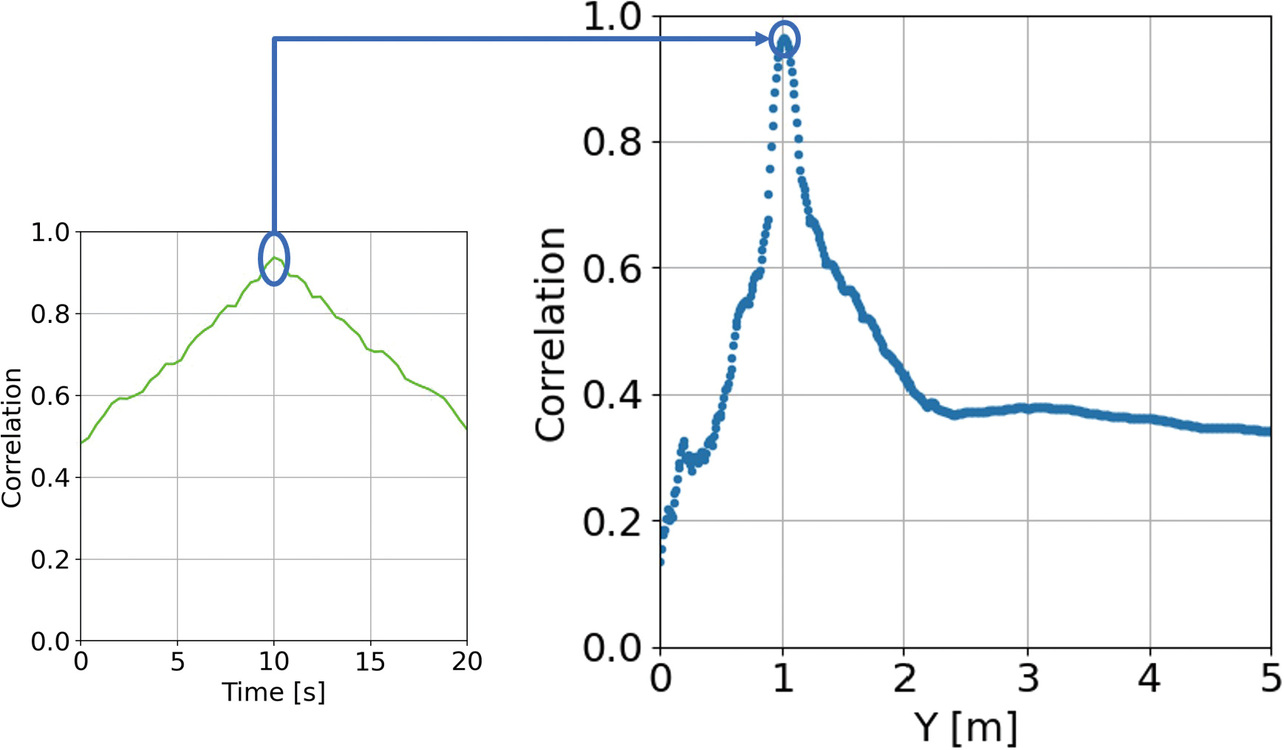
Figs. 7 and 8 show the results when phase data are replaced with real-part data. As seen in Figs. 7(a)–7(c), the real-part waveforms exhibit no aliasing. The right panel of Fig. 8 likewise shows no discontinuities in the correlation values along the distance direction. This reduction of discontinuities is expected to diminish any estimation error. Comparable results are expected when using the imaginary-part data.
An alternative approach would be to use phase unwrapping, a procedure that restores the true phase from the wrapped phase range (typically 0º to 360° [or 0–2π] range)5), to replace the phase data with aliasing-free continuous data. However, phase unwrapping is imperfect; the presence of phase noise/error often leads to incorrect decisions on whether to unwrap at a given point. Attempts to correct this issue require additional processing and increase system complexity. For this reason, the proposed method adopts real- or imaginary-part data, which allow simpler, more robust processing.
3.3 Comparison of estimation accuracy
This subsection compares the estimation results from the phase data received under the conditions specified in Table 2 with those from the corresponding real-part data. The purpose is to evaluate the effectiveness of each estimation process. To this end, phase data, including phase errors (random errors with standard deviations of 5°, 10°, and 15°) as given in Eq. (7) were used, along with real-part data converted from those phase data. Tables 3 and 4 present the estimation accuracy for passage time and minimum distance at L = 1 based on data comparisons across the three error types. Figures 9 and 10 show graphical representations of these estimation results. For 100 estimation trials under identical conditions, the means and standard deviations of the estimation errors were calculated.
| Parameter | Value |
|---|---|
| Frequency: f | 0.91675 GHz |
| Wavelength: λ | 0.327 m |
| RF tag moving speed: V | 0.1 m/sec |
| Sampling time: tsamp. | 0.4 seconds |
| Maximum number of sampled points: nmax | 51 |
| Antenna position: (Xant, Yant) | Xant: 0 m, Yant: 0 m |
| RF tag movement start point: (X0, Ytag = L) | (–1.0 m, 1.0 m) |
| Phase error | Standard deviation: 5°, 10°, 15° |
| Phase error (°) | Estimation accuracy | |||
|---|---|---|---|---|
| Time accuracy (sec) | Distance accuracy (m) | |||
| Mean | Standard deviation | Mean | Standard deviation | |
| 5 | –0.01 | 0.11 | –0.02 | 0.02 |
| 10 | 0.16 | 0.89 | –0.02 | 0.13 |
| 15 | 0.03 | 1.80 | 0.09 | 0.42 |
| Phase error (°) | Estimation accuracy | |||
|---|---|---|---|---|
| Time accuracy (sec) | Distance accuracy (m) | |||
| Mean | Standard deviation | Mean | Standard deviation | |
| 5 | 0.00 | 0.00 | –0.02 | 0.02 |
| 10 | 0.00 | 0.04 | –0.05 | 0.03 |
| 15 | –0.08 | 1.71 | –0.01 | 0.37 |
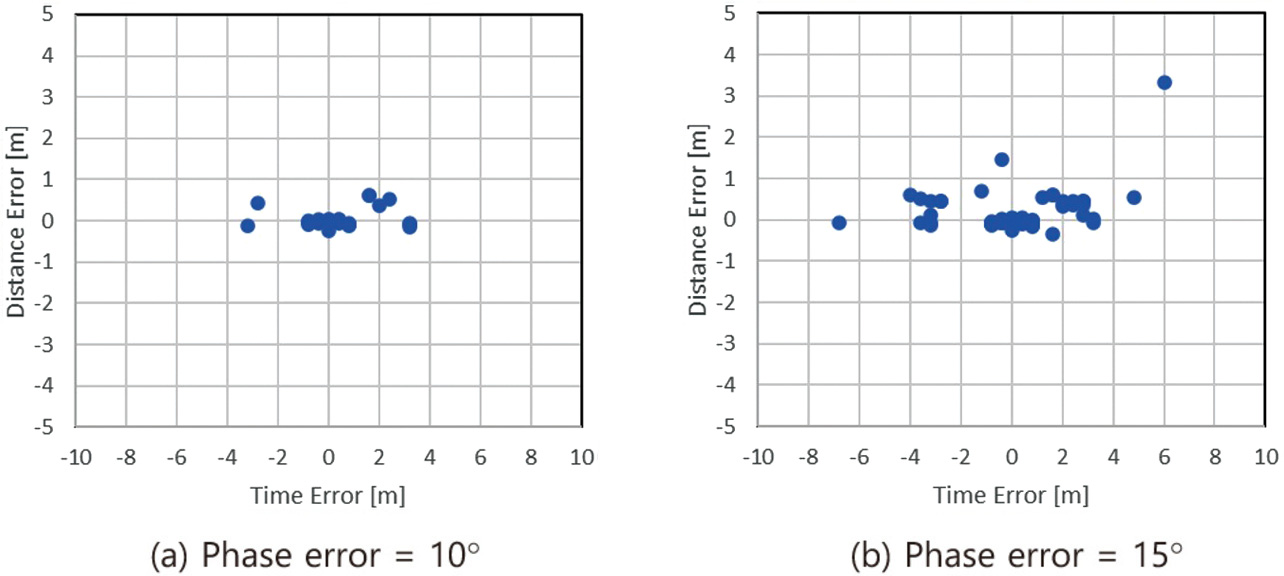
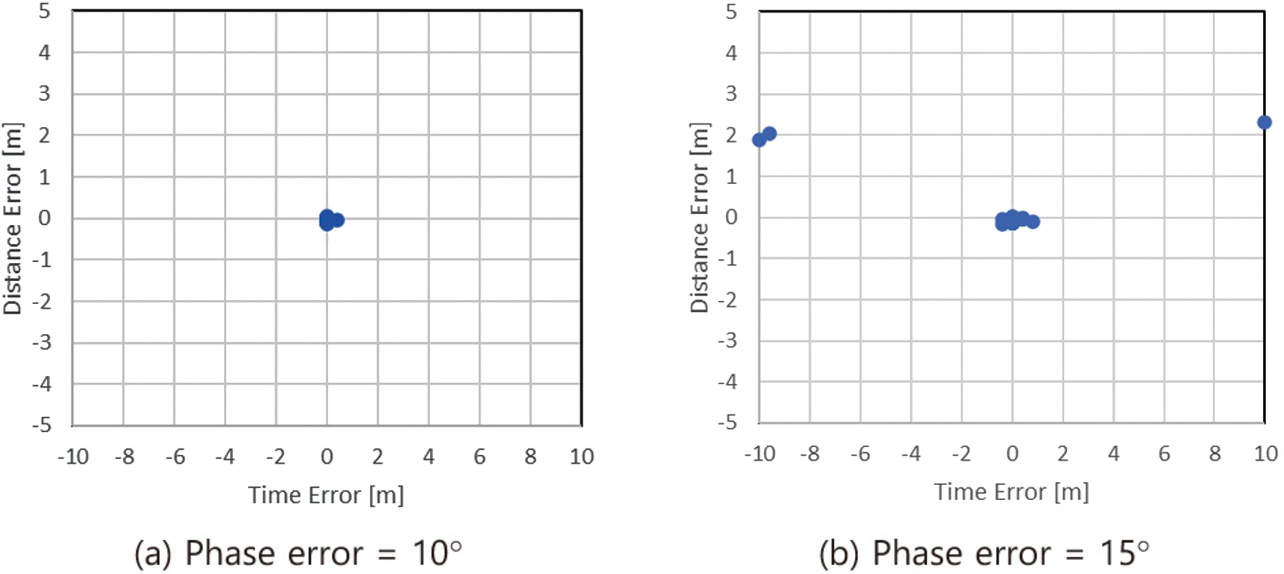
The results indicate that, for both the mean and the standard deviation of the errors, the real-part data yielded more accurate estimates than the phase data, demonstrating the effectiveness of using real-part data. However, in some cases, particularly when phase errors reached 15° or more, even the real-part data produced large estimation errors of several meters or several seconds. The likely cause was a reduction in the correlation between passage time and minimum distance in the positive-range region, leading to higher-correlation points being incorrectly selected as the estimated values. Under real-world conditions where large phase errors may occur, accuracy-improvement measures should be considered, such as adjusting antenna placement to reduce phase errors, using multiple antennas for detection, or restricting the distance observation range.
4. Effectiveness verification of the proposed method
4.1 Evaluation using a simulated environment
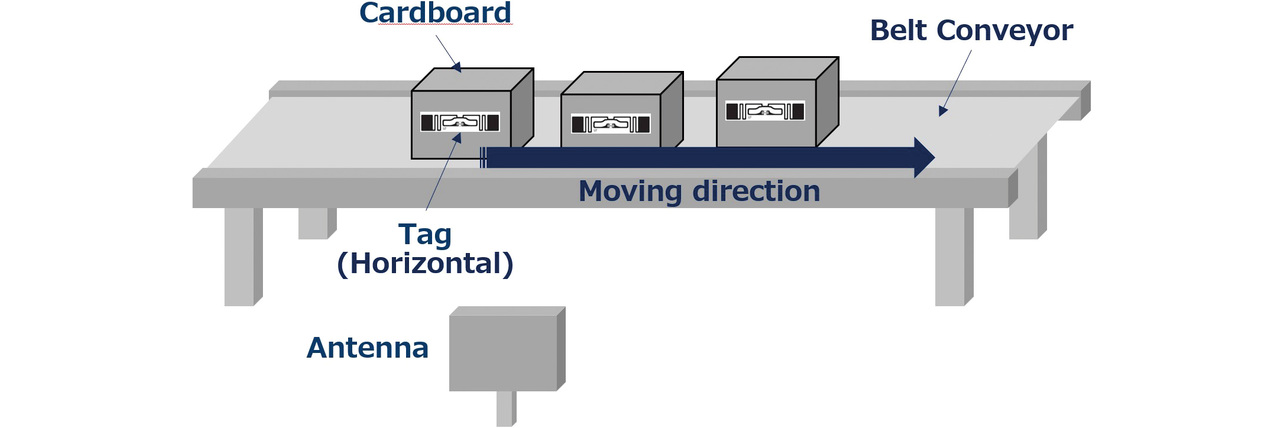
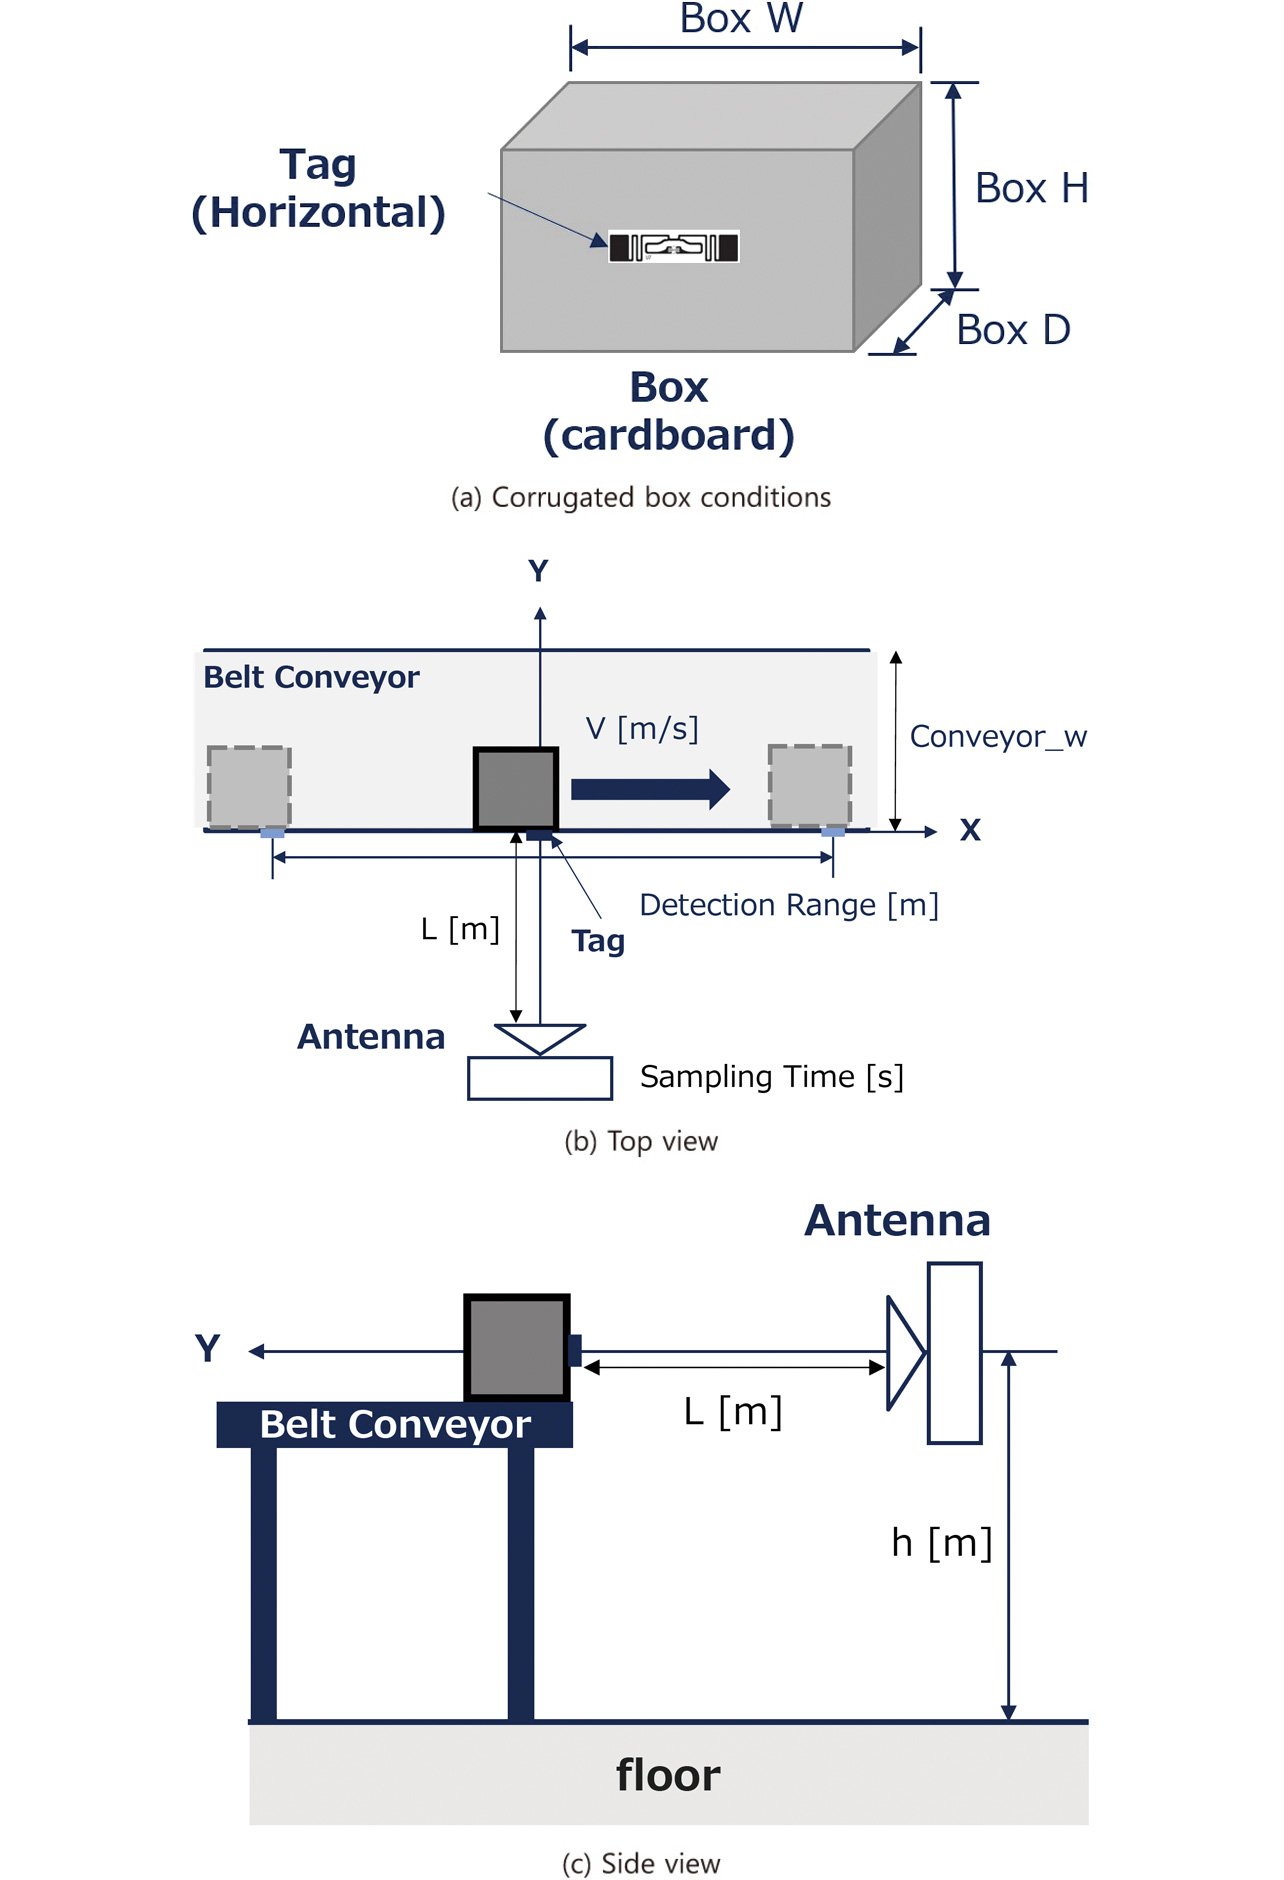
To evaluate the effectiveness of the method established in section 3, we constructed a simulated environment in which RF tags moved across the front of a fixed antenna as shown in Fig. 12. This setup reflects the use case of sorting packages moving in file on conveyors as illustrated in Fig. 11. The monitoring targets were corrugated boxes fitted with an RF tag on one of their sides. These boxes were placed on the conveyor and conveyed at a constant speed. Table 5 lists the evaluation conditions, including the operating conditions of the antenna and the conveyor used.
| Parameter | Value |
|---|---|
| Frequency: f | 0.91675 GHz |
| Wavelength: λ | 0.327 m |
| RF tag moving speed: V | 0.1 m/sec |
| Sampling time: tsamp. | 0.4 seconds |
| Maximum number of sampled points: nmax | 51 |
| Antenna position: (Xant, Yant) | (0,0) |
| RF tag movement start point: (X0, Ytag = L) | (–1.0 m, 1.0 m) (–1.0 m, 3.0 m) |
| Installed height: H | 0.75 m |
| Corrugated box dimensions | Box W: 390 mm Box H: 200 mm Box D: 290 mm |
| Antenna polarization | Right-handed circular polarization |
| RF tag polarization | Horizontal polarization |
4.2 Evaluation results
4.2.1 Effectiveness evaluation of the proposed method
To verify the practicality of the proposed method, we conducted a practical evaluation using RF tags affixed to empty corrugated boxes (left empty to avoid affecting RF-tag antenna performance). Fig. 12(a) shows the conveyance conditions of the RF-tagged corrugated boxes used, and Figs. 12(b) and 12(c) show the relative positions of the antenna and the corrugated box. Table 6 presents the detection results obtained at minimum antenna-to-box distances of L = 1 m and L = 3 m. The measurement results derived from the real-part data align with the estimation-accuracy results reported in section 3, thereby verifying the effectiveness of the proposed method.
| Installed distance | Estimation accuracy | |
|---|---|---|
| Distance accuracy | Passage time accuracy | |
| 1 m | 0.01 m | 0.00 seconds |
| 3 m | –0.04 m | 0.00 seconds |
4.2.2 Estimation under typical package conditions
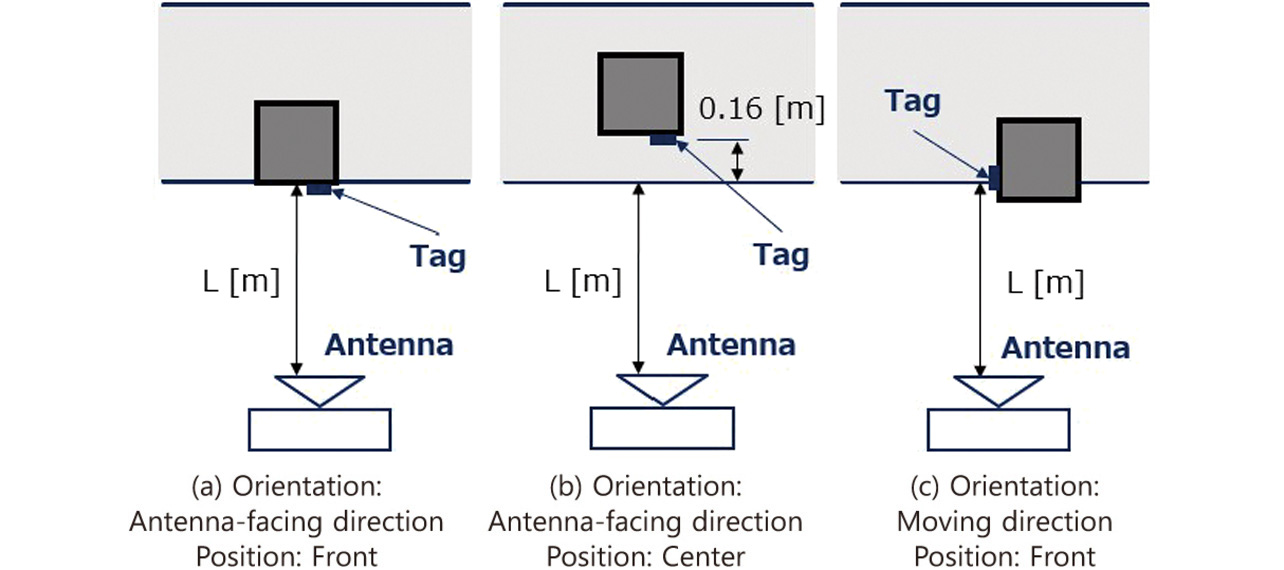
We then conducted experimental measurements. As shown in Table 7 and Fig. 13, we simulated typical package conditions by varying the contents, position, and orientation of the corrugated boxes. For the contents, we used either water-filled plastic bottles or metal boxes. The interior of each corrugated box was completely filled, and the contents were fixed approximately 1 cm away from the RF tag attached to the box.
| Package condition | Contents | Orientation | Position |
|---|---|---|---|
| Condition A | None/Empty | Antenna-facing direction | Front |
| Condition B | Metal (spaced to tag) | Antenna-facing direction | Center |
| Condition C | Water (spaced to tag) | Moving direction | Front |
Adjacent RF tags were placed side by side as shown in Fig. 11 with spacing ranging from 200 mm to 390 mm depending on the edge dimensions of each package (corrugated box) listed in Table 5.
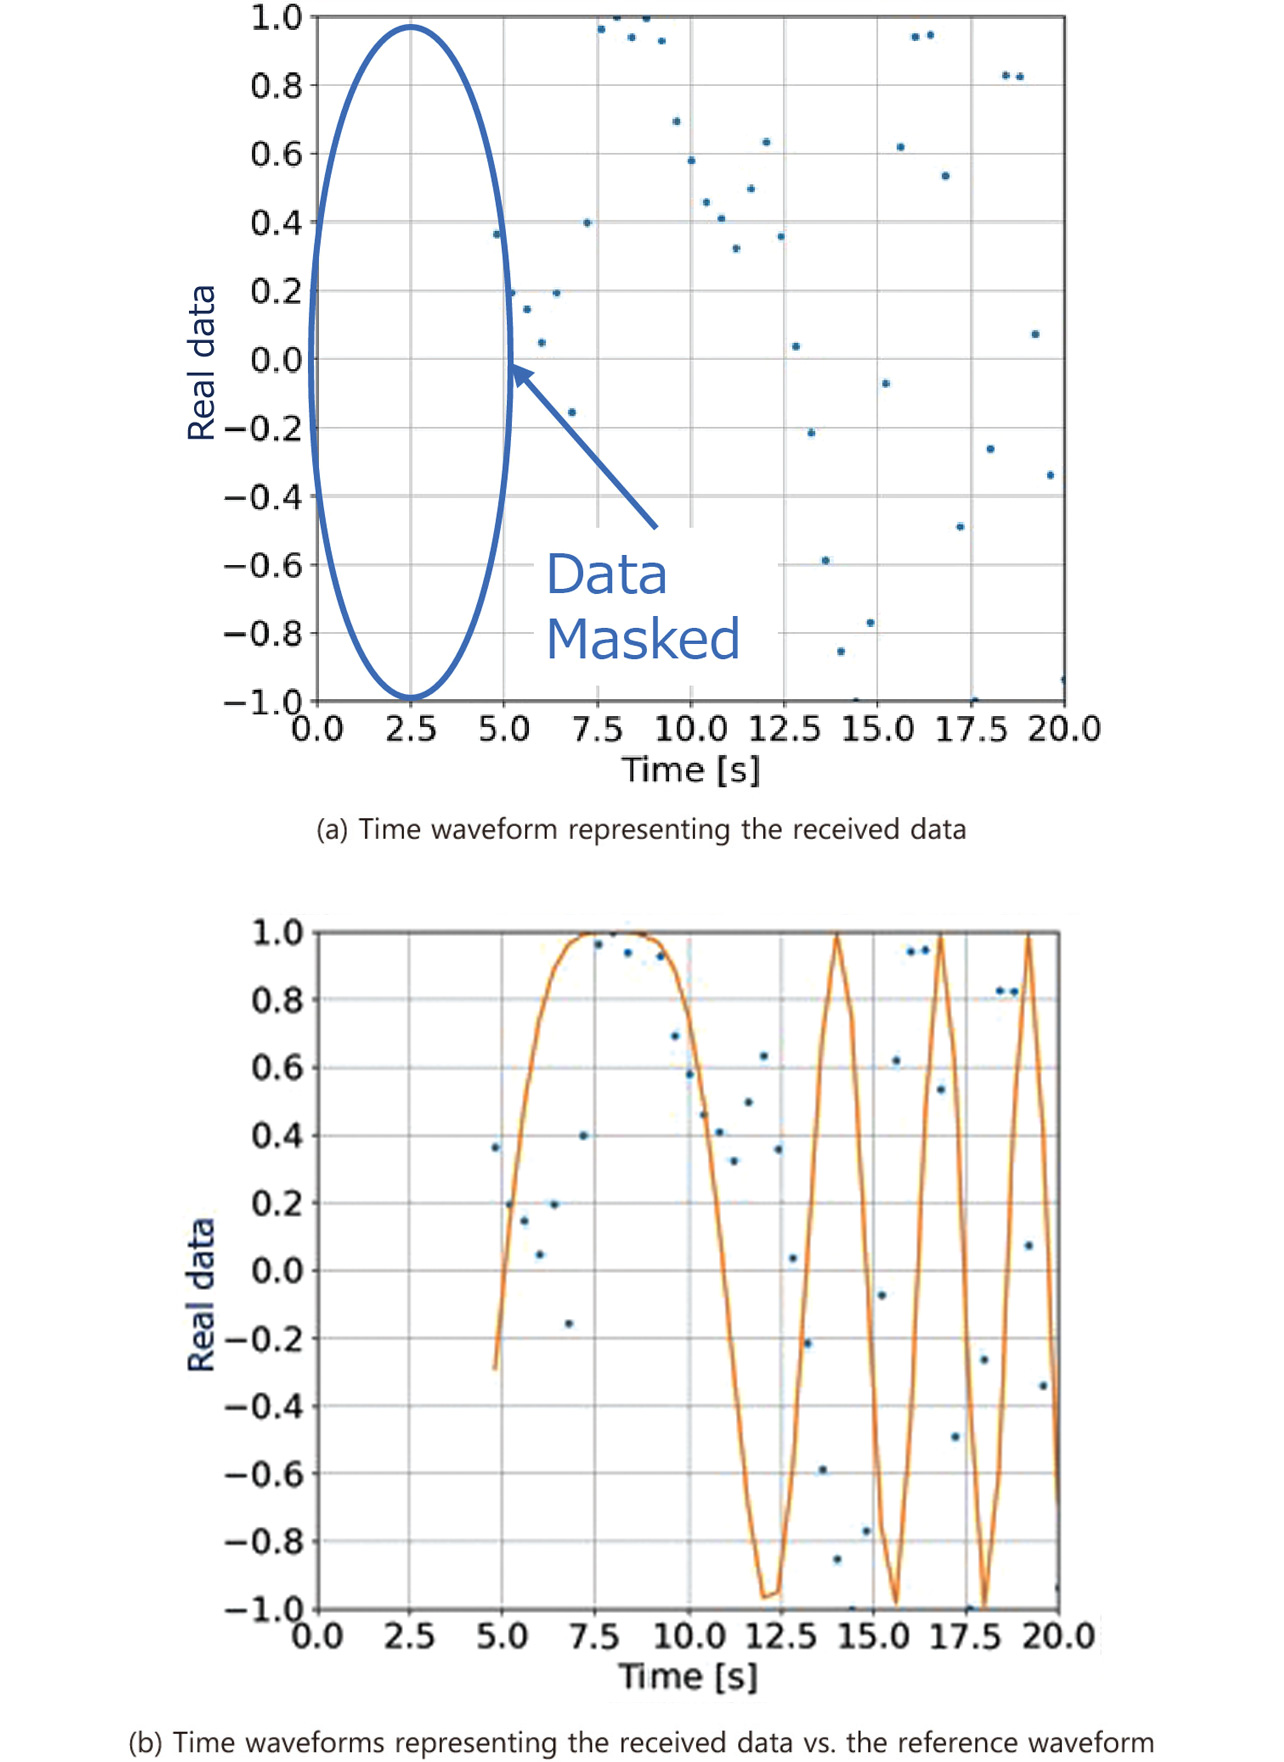
Our proposed method achieved promising performance in the challenging task of recognizing the order of moving boxes. As shown in Table 8, the method achieved an estimation accuracy of 120 mm in the distance direction and 2 s (corresponding to 200 mm) in the time direction. Even in a clearly ill-conditioned case, the method maintained some degree of effectiveness as indicated in Fig. 14(b). This partial success was achieved despite the data-dropout period caused by shielding from the package under Condition C in Table 7 as shown in Fig. 14(a), as well as errors arising from reflections from the contents.
| Package condition | Estimation accuracy | |
|---|---|---|
| Distance accuracy | Passage time accuracy | |
| Condition A | 0.06m | 0 seconds |
| Condition B | 0.12m | 0 seconds |
| Condition C | 0.03m | 2 seconds |
However, these evaluation conditions and results represent only one example. The proposed method must be further examined to verify its effectiveness and determine whether it satisfies the expected conditions for specific use cases. Thus far, our experimental measurements have been conducted several meters away from walls and other reflectors in a relatively spacious laboratory. In other words, the measurements were performed in an environment that was relatively immune to multipath propagation. Therefore, additional evaluations will be required in more complex reflection environments.
5. Afterword
This study aimed to develop a method that could algorithmically and accurately identify the order of queued RF tags. The identification relied on analyzing the time waveforms of RF-tag responses obtained from a general-purpose UHF-RFID system and their characteristic features. Our practical evaluation confirmed that the method could recognize the order of packages moving in orderly file along a conveyor with a spacing of several hundred millimeters, demonstrating its potential to address current challenges in sequence recognition.
The proposed method also lends itself to several additional applications, including the following:
- Recognizing the order of shelved packages by moving an antenna laterally in front of them.
- Monitoring packages as they pass antennas installed at inbound or outbound gates to determine their moving direction.
These applications suggest that the method can support accurate sequence recognition of queued packages, contributing to optimally coordinated in-house logistics processes, improved operational efficiency, and potential cost reductions.
However, the method has thus far been evaluated only under near-ideal simulated conditions. Factors, such as multipath propagation and other environmental effects encountered in real operational settings, must be examined separately. The next step is to conduct evaluations at actual logistics sites and further refine the method toward commercialization. Priority should be placed on technical adaptations that account for site-specific environmental factors and on research aimed at enhancing system stability. Such efforts are expected to further improve efficiency and accuracy in materials control.
References
- 1)
- S. Azzouzi et al., “New measurement results for the localization of UHF RFID transponders using an Angle of Arrival (AoA) approach,” in 2011 IEEE Int. Conf. RFID, 2011, pp. 91-97.
- 2)
- R. Miesen et al., “Phase-based multi-carrier ranging for UHF RFID,” in 2012 IEEE Int. Conf. Wireless Inf. Technol. Syst. (ICWITS), 2012, pp. 1-4.
- 3)
- M. Arai, “The Subject and Technology of Radio Frequency Identification (RFID) Readers,” (in Japanese), IEICE Commun. Soc. Mag., vol. 2008, no. 7, pp. 44-50, 2008.
- 4)
- Y. Tsuji et al., “Correlation and Spectral Analysis,” (in Japanese), J. Plasma Fusion Res., vol. 85, no. 9, pp. 620-630, 2009.
- 5)
- S. Okuyama, “Correction of Unwrapping Errors Caused by Branch-Cut Algorithm,” (in Japanese), J. Geod. Soc. Jpn., vol. 56, no. 4, pp. 149-153, 2010.
The names of products in the text may be trademarks of each company.