


Development of an Automatic Measurement Time Analysis Function for Blood Pressure Management by Remote Patient Monitoring
- Telemonitoring
- Remote Patient Monitoring
- Hypertension Treatment
- Hypertension Control
- Blood Pressure Monitor
Blood pressure management is important for preventing cerebrovascular and cardiovascular diseases, but it is not being adequately achieved and has become a global social issue. In the United States, public and private initiatives have tried various solutions. Insurance made remote patient monitoring deductible by reimbursement in 2019 as the first in the world. In response, Omron Healthcare, Inc. also offers the VitalSightTM remote patient monitoring system. When home blood pressure readings were sent directly to electronic medical records, the large volume of measurement records placed a heavy burden on medical professionals, which was an issue. We are proposing several solutions. In this paper, we report on our development and the evaluation result of an automatic analysis function for measurement time periods in order to display morning and evening blood pressure data appropriate for each individual without increasing the medical professional’s workload. The function compiles measurement frequency per unit time for each individual and identifies daily measurement habits. We verified this by using actual measurement results sent to electronic medical records and confirmed that the function can be used to distinguish the time periods when measurements were taken for each individual. It is expected that using this function to display morning and evening blood pressure graphs will enable medical professionals to easily judge the effectiveness of medication and detect unusual measurement times that suggest that symptoms are present. It is hoped that its usefulness and clinical meanings will be validated.
1. Introduction
1.1 Necessity of blood pressure management and monitoring
Numerous hypertensive patients around the world are not controlled to the target blood pressure readings1). In the United States, half the population is suffering from high blood pressure. Only one quarter of these hypertensive patients are controlled to the target BP readings. Moreover, high blood pressure accounts for approximately half a million deaths per year, giving rise to the need for an annual medical budget of 131 billion dollars. Aware of these facts, the U.S. government has released a statement for healthcare professionals to enhance BP management2). Improving the rate of achieving target BP control values through hypertension treatment is a social issue to be addressed for improvement.
In 2012, the U.S. Centers for Disease Control and Prevention (CDC), jointly with the U.S. Centers for Medicare and Medicaid Services (CMS), which is responsible for U.S. government-administered health insurance programs, set a rate of achieving target BP control values of 80% in a national initiative called Million Hearts® to reduce cardiovascular events. The Centers have been providing information for BP management 3).
Since 2017, the Target: BPTM program linked up with Million Hearts® has been in place to pursue such efforts as online collection of patients’ BP data solicited by the American Heart Association (AHA) and the American Medical Association (AMA) from healthcare institutions and the publication and commendation of healthcare institutions ranking high for the rate of achieving target BP control values4).
In addition, Margolis et al. worked to improve the rate of achieving target BP control values through remote BP monitoring and pharmacist-led BP management. They confirmed that their patients showed improvements in BP compared with the control group under conventional treatment, and that the former maintained the achieved improvements over the long term5).
1.2 Launch of remote patient monitoring service
In January 2019, the CMS initiated insurance reimbursement for remote physiologic (patient) monitoring6). In response, in August 2020, OMRON HEALTHCARE’s U.S. sales subsidiary, Omron Healthcare, Inc., launched VitalSightTM, a service that provides healthcare providers with patients’ BP readings and body weights measured at home7).
The above-mentioned service uses a system that connects blood pressure monitors and body weight scales supporting Bluetooth® Low Energy communication technology to 4G LTE/5G mobile networks via devices known as hubs with the same communication capability as smartphones. The measurement results thus obtained are directly displayed on dashboards and in electronic medical records at healthcare providers. A communication hub pre-paired with the measuring device is delivered to patients, allowing use by non-smartphone-owning or smartphone-unsavvy patients and avoiding the need for pairing operations and other technical issues. Moreover, readings are automatically sent to electronic medical records. The purpose intended is to make BP readings readily accessible for active use by healthcare providers as with other health checkup results.
Northwestern University conducted an observational study using electronic medical records. They confirmed that hypertensive patients were treated with active use of the aforementioned system, resulting in improvements in the rate of achieving target BP control values8-10).
1.3 Past efforts made by OMRON HEALTHCARE
OMRON HEALTHCARE has a 50-odd-year history of manufacturing and selling automated electronic blood pressure monitors as healthcare devices. Through collaboration among industry, government, and academia, we have committed to improving the measurement accuracy and precision of blood pressure monitors for anxiety-free use and have contributed to advances in hypertension treatment from a manufacturer’s perspective.
In 1994, we launched at-home physical exam services to transfer measurement data from home to hospital administrative servers via phone lines as one of numerous efforts we have made to help collect and use home-measured BP data. Thus, we have made our share of contributions to advancing BP management.
From 2012 to 2019, we provided a service named Medical Link, among others, in Japan. This service was a blood pressure analysis service that analyzed home-measured patients’ BP data collected using blood pressure monitors capable of direct transmission to 3G mobile networks. This service delivered analysis results to healthcare providers to support hypertension treatment11).
In recent years, we have provided the OMRON Connect service, which collects and stores BP and other vital data for personal customers worldwide. For some countries, we also provide the Health data Monitoring System (HMS) service, which presents healthcare providers with measurement records thus obtained.
1.4 For the widespread use and promotion of remote patient monitoring
The above confirms the importance of blood pressure management and monitoring in hypertension treatment, as well as the effectiveness of remote patient monitoring. Hence, our company, as a proponent of zero cerebro- and cardiovascular onsets (zero events), investigated to ensure their widespread use.
We kicked off by analyzing the results of hearings with healthcare providers and data from collaborative studies. We then considered the challenges that emerged from the process and the possible measures to be implemented. Of the several measures considered, the method that calculated two separate mean values for morning and evening BP is used to detect highly risky early-morning high BP or to determine the time to take antihypertensive medication6). This method faced new challenges this time. To address these challenges, this paper reports on our investigation into improving morning and evening BP graphing, one of the analysis methods for this home-measured BP.
2. Challenges and proposed solutions
2.1 Electronic medical records overwhelmed with home-measured BP information
BP readings sent directly to electronic medical records via remote patient monitoring are useful for BP management. On the other hand, challenges thereto also came to the fore.
When sent to an electronic medical record, BP readings were added one by one to a log display field called a flow sheet. The physician was required to check and evaluate each one of these readings. Besides, they had to take extra time and effort, including calculating the mean of multiple readings when required to check the effect of administered medication.
In addition, whenever a predefined threshold set by the physician is exceeded or not met, an alarm notification is issued. Though seemingly simple in itself, this alarm posed the following problems:
When an alarm notification occurred, the physician or other clinician had to decide whether the patient had to be contacted to identify the cause, and to decide whether the result might represent an emergency but often this was not the case. For example, an unusually high reading could happen when the patient was not at rest or because the measurement was taken in an improper posture.
On the other hand, even when an alarm notified a case that required a clinical action, the alarm notification would continue from after a measure was implemented, such as increasing the prescribed dose of antihypertensive medication, until the medication took effect and stabilized the blood pressure.
Suppose the physician takes time to check an alarm notification at the time of its occurrence, only to find that it requires no action. In that case, unreasonable costs will result, such as delays in treating other patients. On the other hand, ignoring an alarm would result in being held responsible for a false negative if the alarm required action in the first place.
Therefore, simple linkage to electronic medical records would create a new problem: increased workloads for healthcare providers. The physician’s workload would increase. So would the workloads on the physician’s support staff. The support staff would have to check the data, and the results might require triage.
2.2 Reducing workloads on healthcare providers through the integrated presentation of BP information
To support daily home-measured BP data sent in large volumes to electronic medical records, we have proposed several automation solutions to reduce the workload on healthcare providers. These solutions include a function to calculate and report the mean of multiple BP readings, an automated history-taking function that automatically sends a text message to the patient and asks for any symptom before the obtained readings triggers an alarm notification, a medication efficacy assessment function that displays the timing of administering additional medication and the trends in BP value therebefore and thereafter for an at-a-glance confirmation of the medication efficacy, and a morning and evening BP display function that calculates and shows two separate mean values for morning and evening BP. These functions enable efficient interpretation of large volumes of BP readings, thereby reducing the workloads on healthcare providers.
2.3 Graphical/numerical indication per time period based on BP measurement frequency
While it is beneficial for an at-home BP analysis to calculate two separate mean values for morning and evening BP measurements, the calculations involved increasing the workload on healthcare providers. As such, these calculations should be automated. However, the conventional method with fixed time periods involves a difference between the fixed and actual measurement time periods. To address this issue, we proposed an alternative method that calculates the selection frequency of the times of day for daily BP measurements and defines and analyzes each highly frequent time period as the morning or the evening for each patient. In what follows, we refer to this method as the proposed method.
In our previously proposed method, the time periods from 4 a.m. to 9:59 a.m. and from 7 p.m. to 1:59 a.m. the next day are defined as morning and evening, respectively. These fixed time periods are used to sort and compile readings for graphic and mean-value indication. In what follows, we refer to this method as the fixed-time method.
However, the following challenges stood before this method:
- There is no guarantee that patients will take measurements during the fixed time periods.
- Readings excluded for falling out of the fixed time periods may have significant implications, posing the risk of false negatives.
- Elderly persons and shift workers do not necessarily show a well-defined pattern of getting up and going to bed.
- The same time period may be segmented into either morning or evening. (For example, with segmentation based on the a.m./p.m. division, getting up around noon and taking measurements would result in the coexistence of post-rise and pre-sleep BP readings.)
The U.S. guidelines include the at-home BP measurement protocol: “Take at least two readings one minute apart in the morning before taking medications and in the evening before supper.”12)
Let us assume that a patient’s daily life shows a degree of regularity. Then, the patient is expected to take measurements during approximately the same time periods each day according to the guidelines if instructed to do so by the healthcare provider. In other words, the proposed method is expected to hold because there are likely to be highly frequent time periods for BP measurement.
3. Methodology
3.1 Calculation algorithm
The proposed method analyzes each patient’s BP measurement frequency by time period, identifies and defines the most frequent time periods as morning and evening, and classifies all other time periods as ad hoc.
Fig. 1 shows a flowchart for this method.
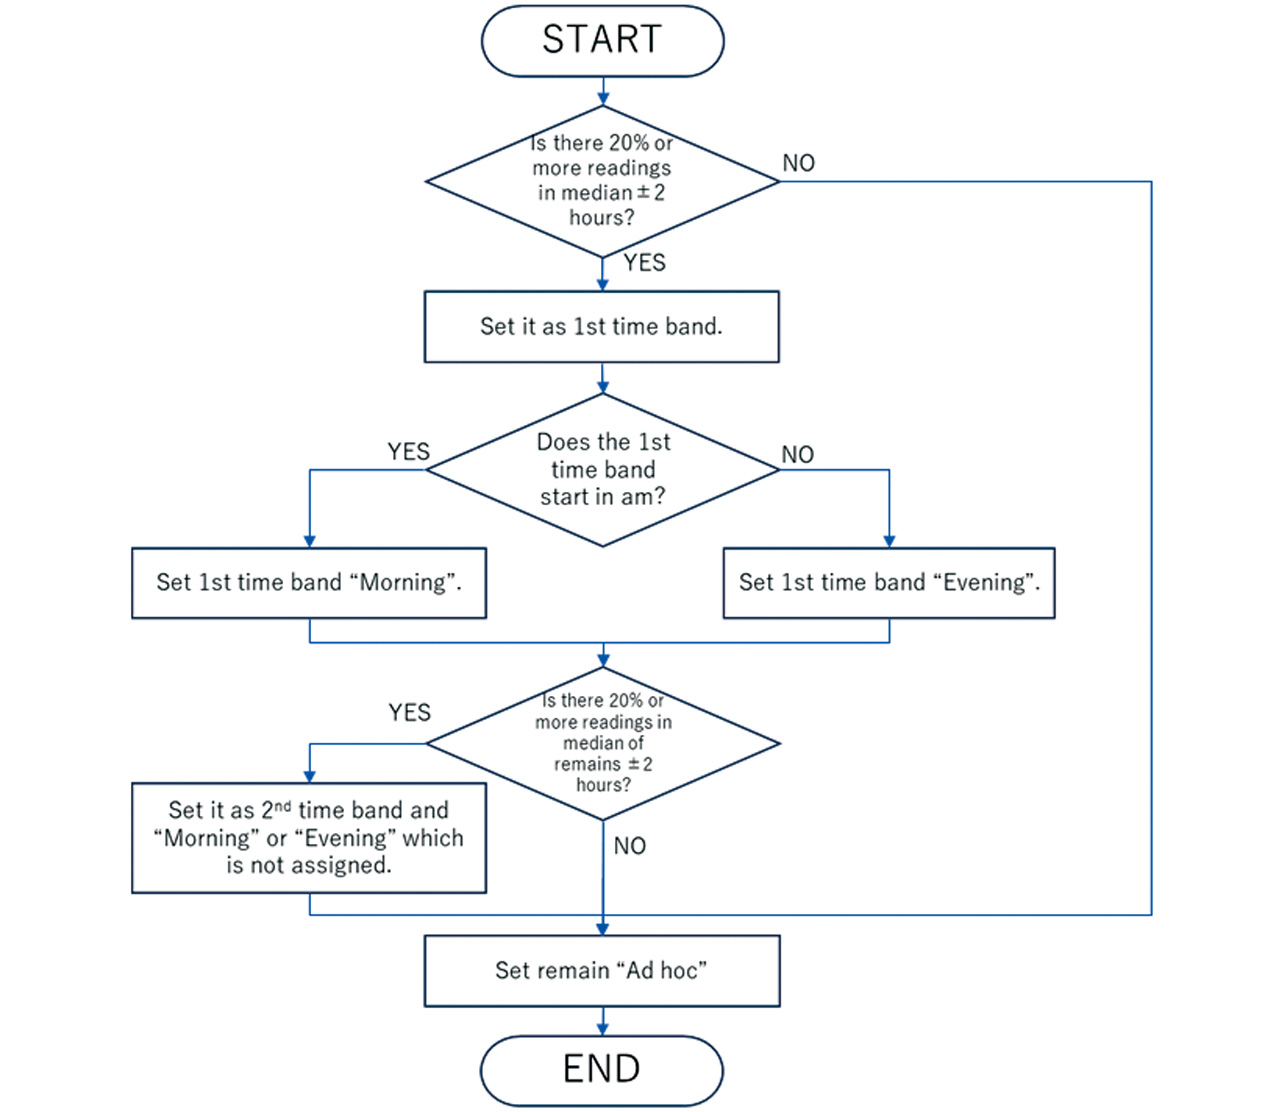
The main rules are as follows:
- (1) Calculate the frequency using a weighted mean of adjacent frequencies based on Eq. (1):
-
k: Time period number [dimensionless]
wp[k]: Weighted mean measurement frequency during time period k
p[k]: Measurement frequency during time period k - (2) Let the time period including the most frequent time be the first time period, the time period other than the foregoing containing the second most frequent time be the second time period, and all the time periods other than the foregoing two be ad hoc time periods. Ensure that the first and second time periods each cover at least 20% of all the readings.
- (3) Assume that the spans of the first and second time periods are the modal value ±2 hours long, respectively.
- (4) For the first and second time periods, let either be the morning, whichever starts at an earlier time of day than the other. If only the first time period exists and occurs in the afternoon, let it be the evening.
- (5) Let the first and second time periods be included in the day to which their respective start times belong. Handle either time period as part of that day, even if its end time goes beyond midnight into the next day.
- (6) If shifting each time period forward or backward by one hour or less results in an increased total frequency, do so.
*The underscored parameters have room for adjustment and are not optimized based on the patient’s background and other factors.
3.2 Verification method
The fixed-time method and the proposed method are applied to actual measurement results to calculate their proportions classified into morning, evening, or ad hoc for each patient, then recalculate their mean values in each group for comparison in terms of proportional frequency of measurement. If an appropriate time period could be selected for each patient, the whole group would, on average, take measurements less frequently during the ad hoc time periods. Therefore, the success criterion for the proposed method is that measurements be taken less frequently during the ad hoc time periods than in the conventional method.
3.3 Datasets
Group A: Elderly primary care patients
During the period from November 28, 2020, to August 14, 2021, the Primary Care Clinic at Northwestern Medicine (Chicago, Illinois, USA) prescribed VitalSightTM to 288 elderly patients (65 or older) with hypertensive disorders or other related indications. For 238 BP readings senders among these patients, we extracted the measurement results from their electronic medical records.
Group B: Middle-aged and elderly patients with hypertensive complications
A pilot study was conducted at Northwestern Medicine (Chicago, Illinois, USA) from February 8, 2024, to January 31, 2025, involving 70 hypertensive patients with a history of cerebral stroke or cardiovascular, renal, diabetic, or other disorders. For 69 participants who sent BP readings using VitalSightTM, we extracted the measurement results from their electronic medical records. The VitalSightTM was set to send a text message prompting the user to take two readings, one in the morning and one in the evening if the number of readings was fewer than the specified minimum.
The use of these datasets for research purposes has been approved by the Northwestern University Institutional Review Board and the Northwestern Medicine data steward. Both datasets are shared after de-identification in accordance with U.S. laws and regulations such as HIPAA.
4. Results
4.1 Distributions of measurement time periods
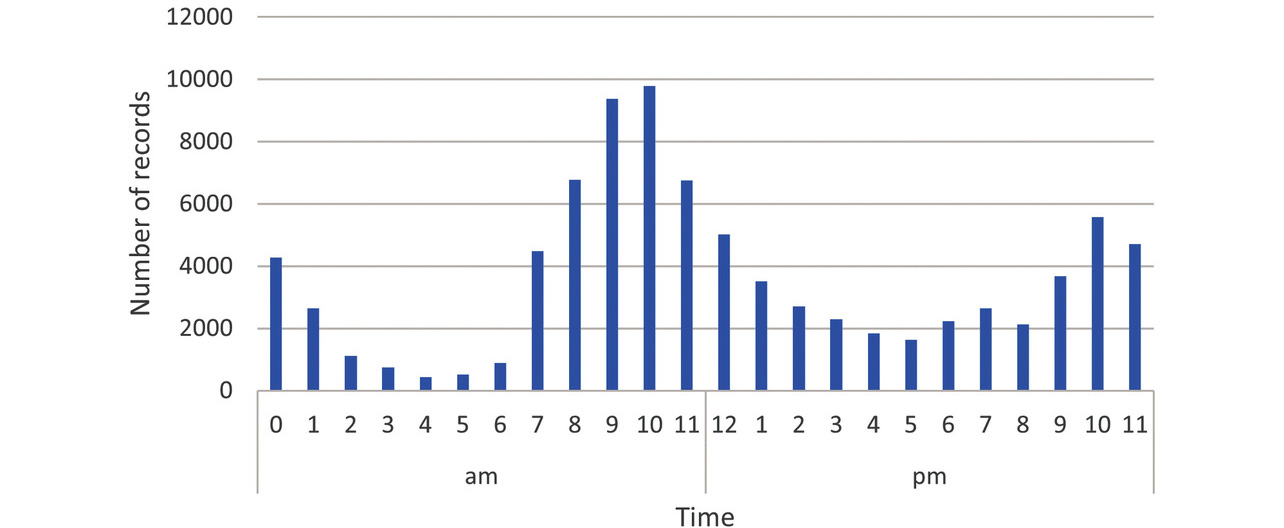
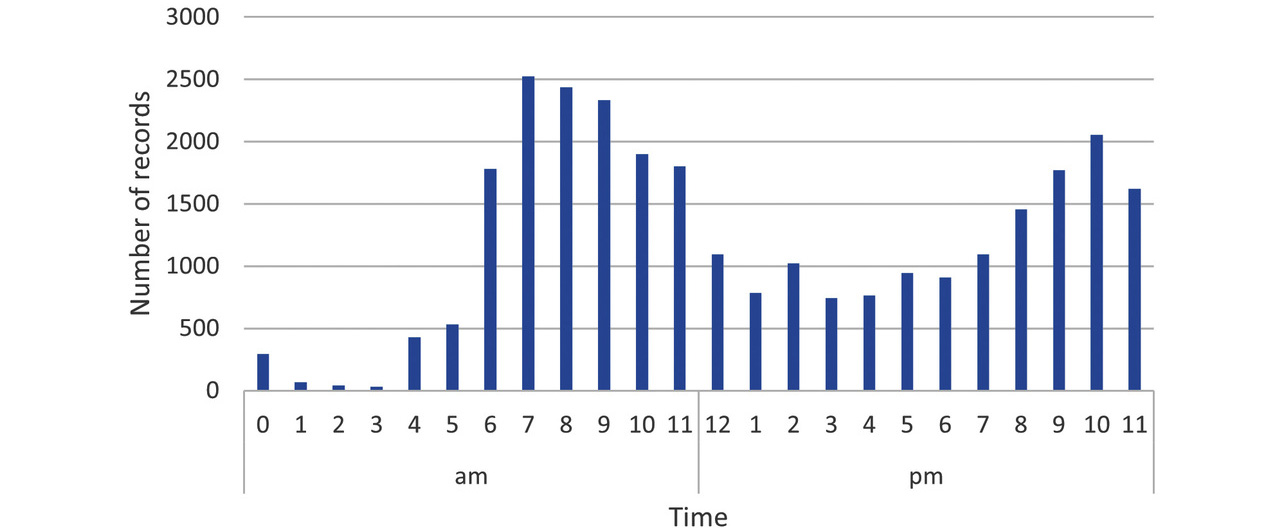
Before verification, we checked the distributions of all the measurement time periods for both groups. Figs. 2 and 3 show the distributions of the number of readings per hour as histograms without identifying individuals for all readings taken in Groups A and B, respectively. As shown in these figures, measurement time periods are broadly distributed across the 24 hours, including late-nocturnal, matutinal, and diurnal hours, though there are peaks in the morning and evening.
4.2 Algorithm application
First, we applied the proposed method to the Groups A and B datasets to determine whether highly frequent time periods were selected for each group.
Figs. 4-9 each show a typical histogram of the actual measurement frequency for each personalized time period. In each figure, the horizontal axis represents time in 15-minute increments, while the vertical axis represents the frequency.
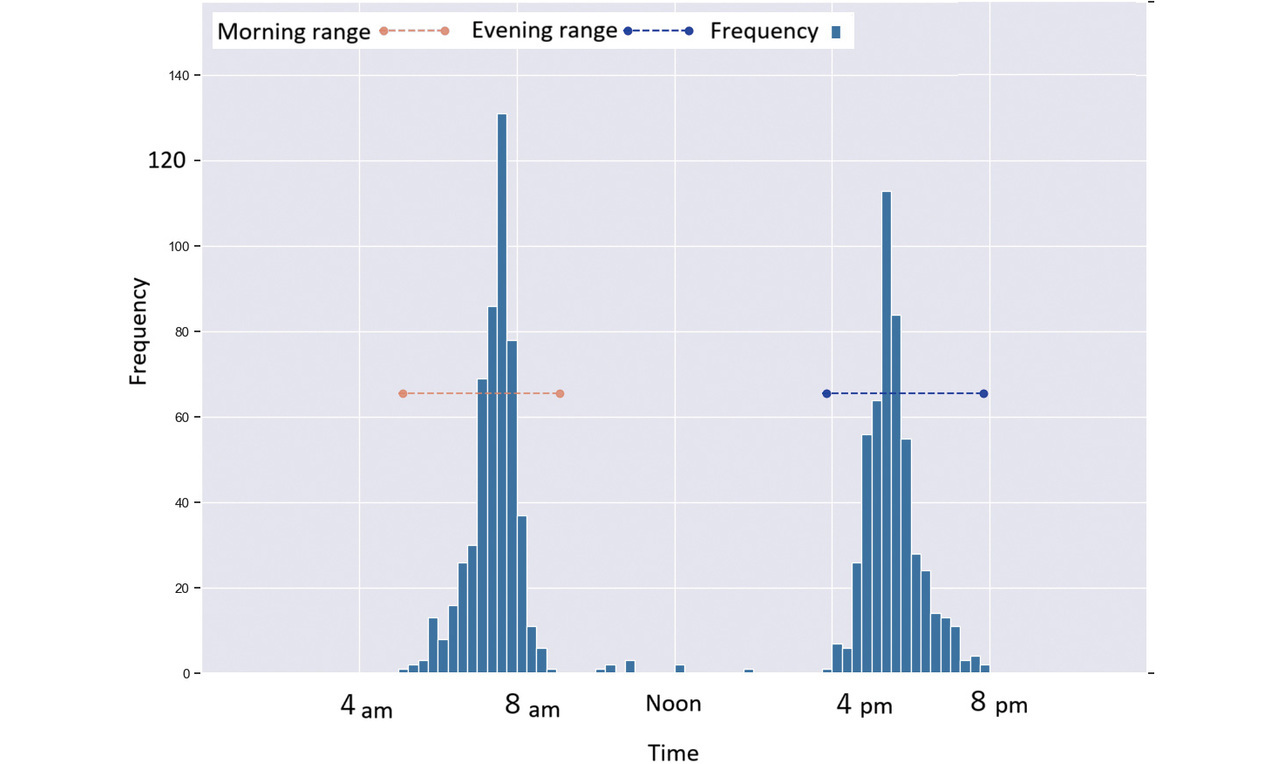
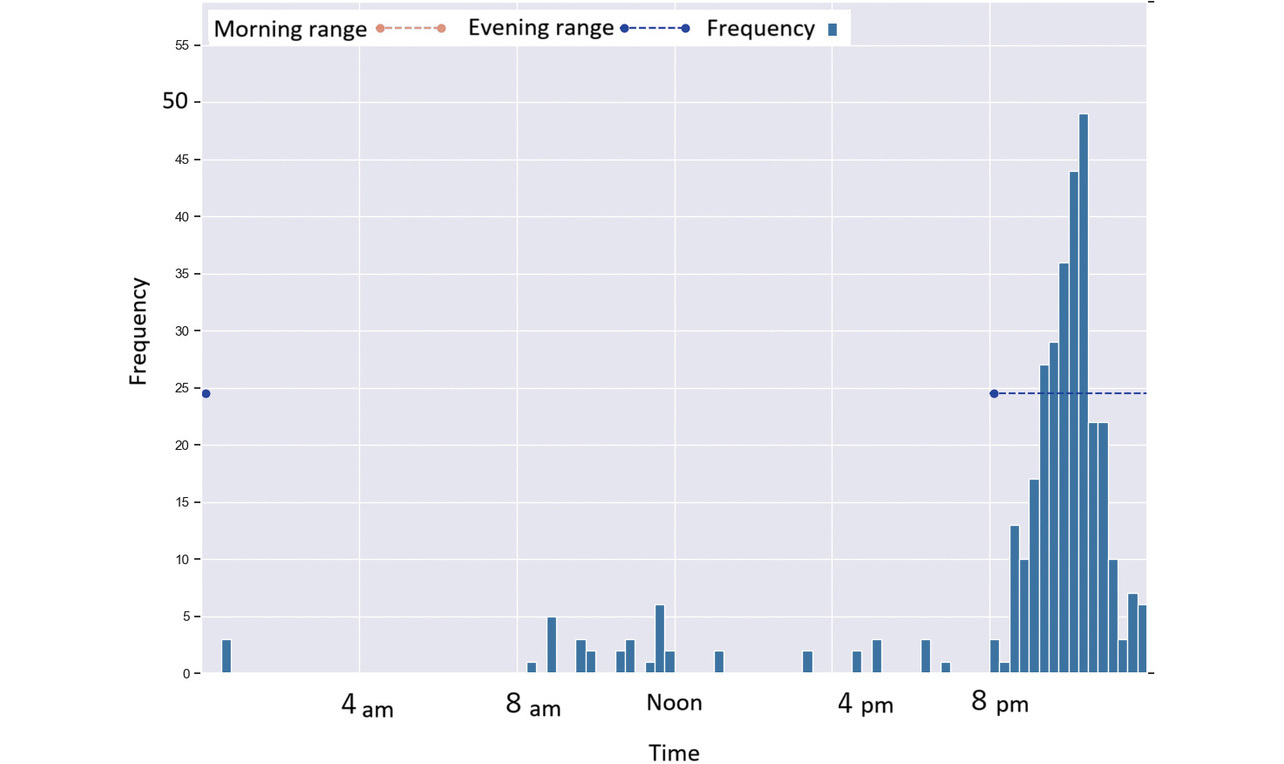
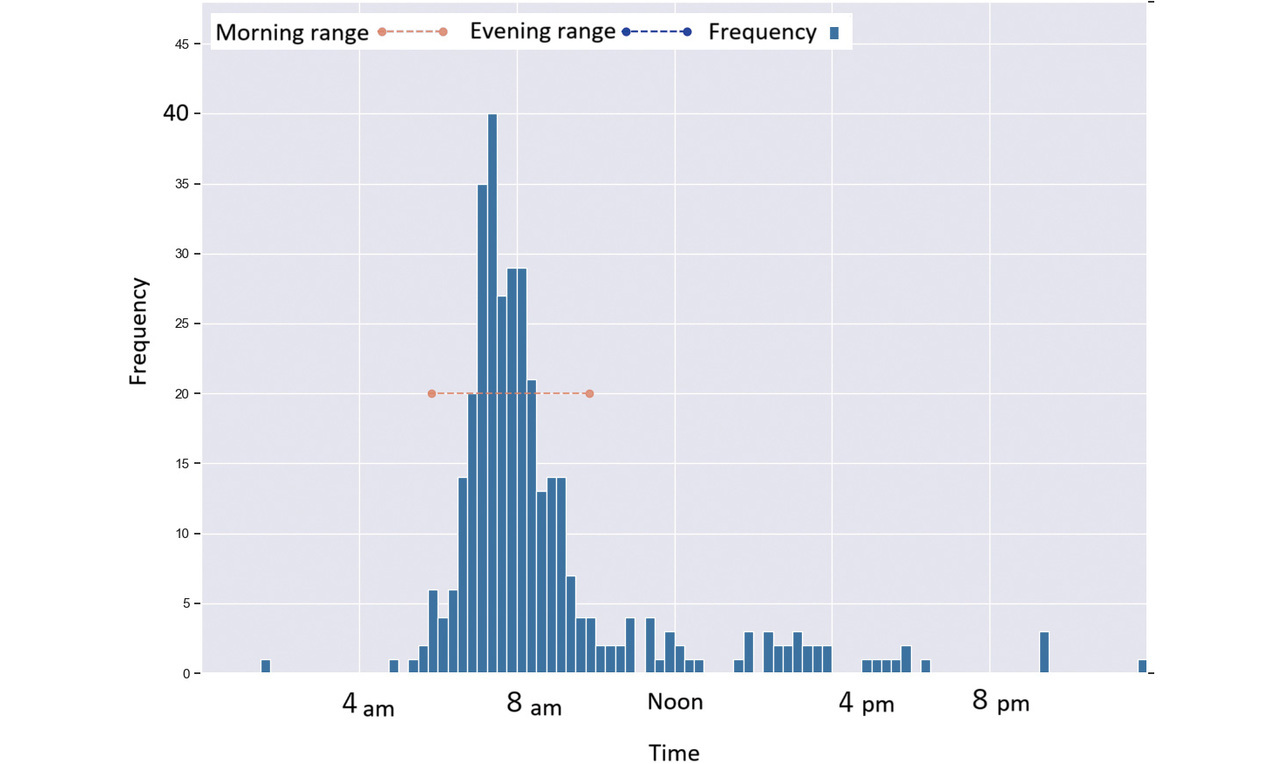
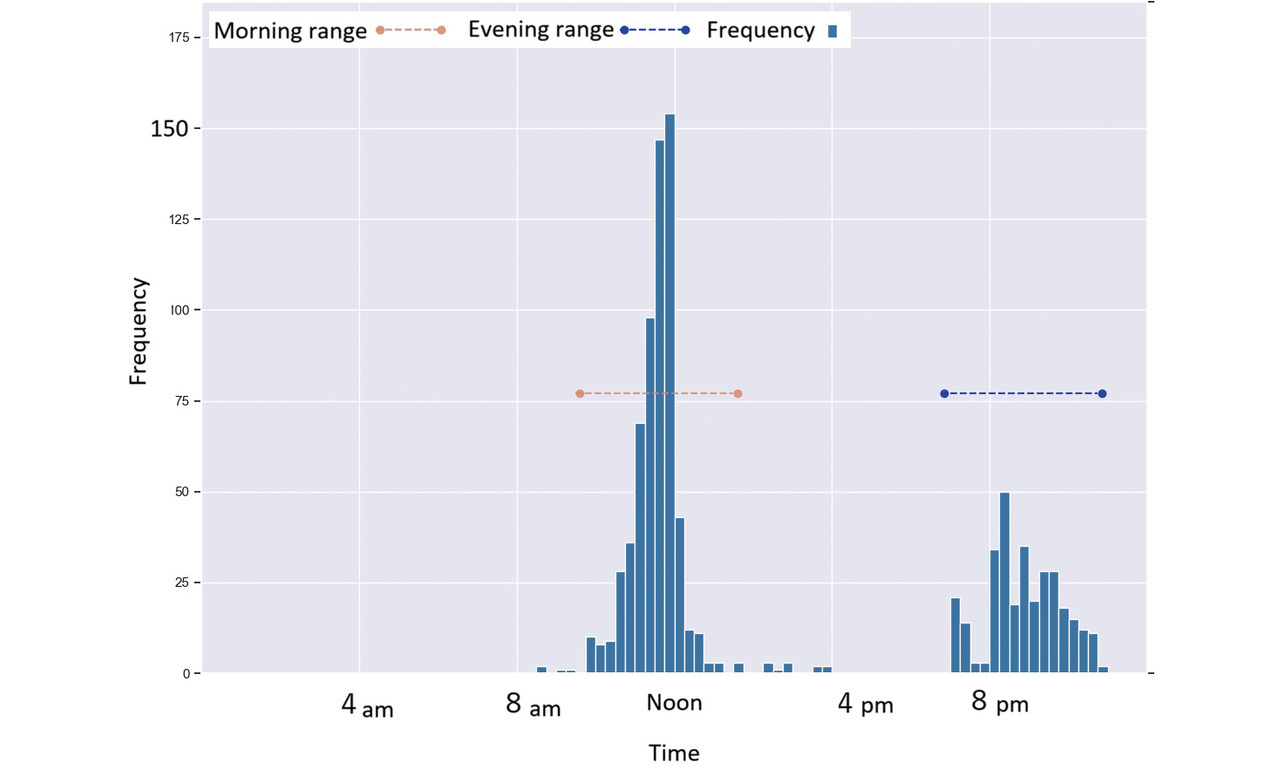
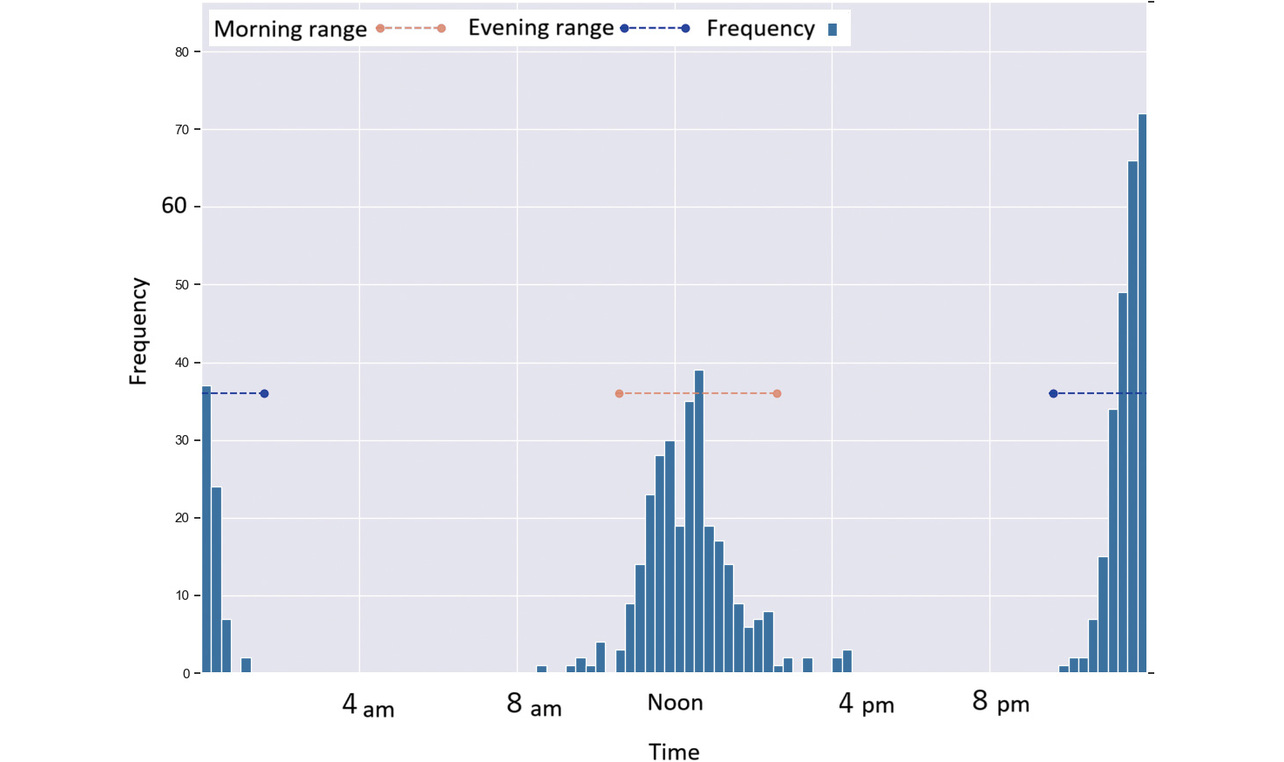
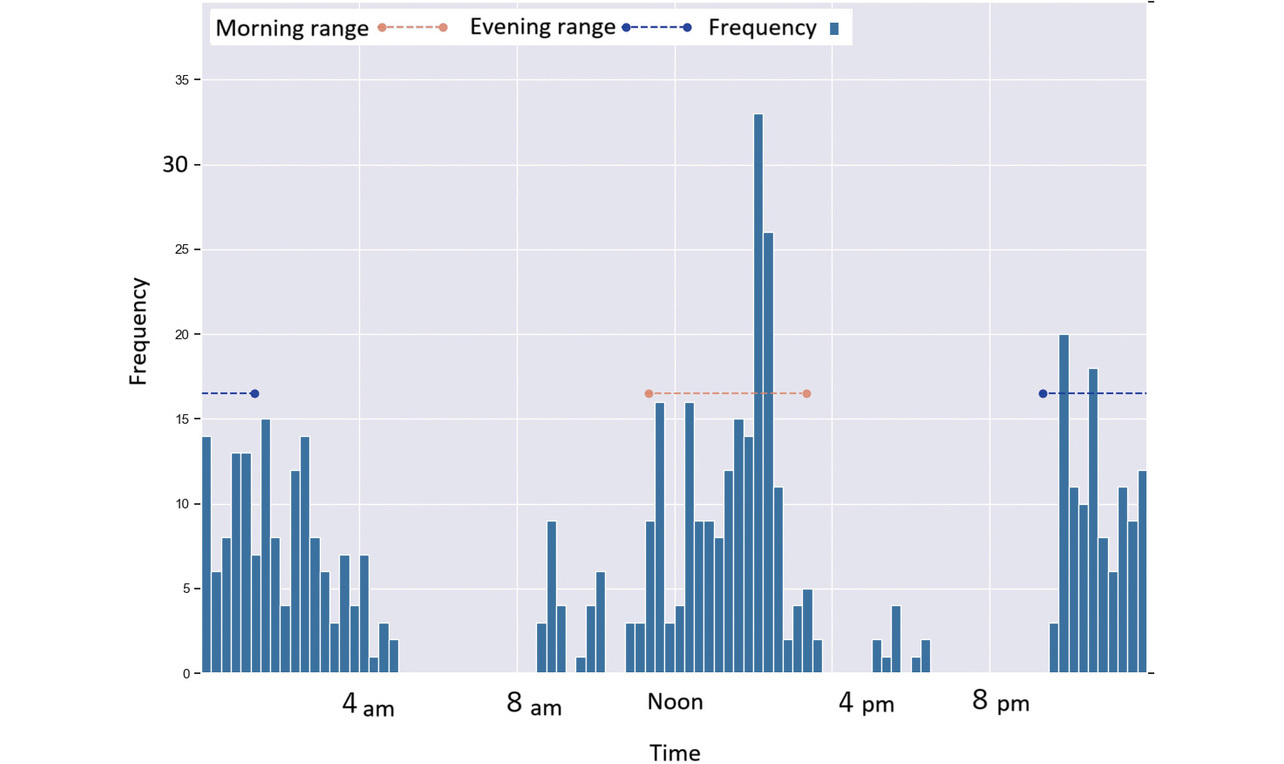
In these figures, the red or blue dashed line with a circle at each end represents a time period determined as morning or as evening for each per the proposed method.
Fig. 4 shows a case where a subject took readings primarily during concentrated time periods in the morning and evening.
Fig. 5 shows a case where a subject took readings primarily during concentrated time periods in the evening.
Fig. 6 shows a case where a subject took readings primarily during concentrated time periods in the morning.
Fig. 7 shows a case where a subject took readings primarily during concentrated time periods around noon and in the evening.
Fig. 8 shows a case in which a subject took readings around noon and 0 hours (midnight).
Fig. 9 shows a case in which a subject took readings after noon and during late-night hours, though the measurement time varied considerably.
Table 1 shows the counts of cases/persons with readings straddling noon or midnight, confirming the existence of the fourth problem presented in Subsection 2.3.
| # of persons w/ readings straddling noon (%) | # of persons w/ readings straddling midnight (%) | |
|---|---|---|
| Group A | 123 (52%) | 72 (30%) |
| Group B | 18 (26%) | 10 (14%) |
4.3 Verification results
Tables 2 and 3 show the results of applying the proposed method to Groups A and B, respectively, to segment measurement results into personalized time periods and then average the resulting proportions for each group. As shown by these tables, for each group, the proposed method increased the proportion of measurement results segmented into morning or evening, which the fixed-time method would have segmented into ad hoc and excluded, while reducing the proportion of measurement results segmented into ad hoc. A Wilcoxon rank-sum test showed statistically significant differences between the two methods for each group. These results indicate that the proposed method increased the proportion of measured results segmented into personalized time periods, compared with the fixed-time method.
| Mean of proportions segmented into morning | Mean of proportions segmented into evening | Mean of proportions segmented into ad hoc | |
|---|---|---|---|
| Fixed-time method | 24% | 26% | 50% |
| Proposed method | 52% | 26% | 22% |
| Mean of proportions segmented into morning | Mean of proportions segmented into evening | Mean of proportions segmented into ad hoc | |
|---|---|---|---|
| Fixed-time method | 37% | 28% | 36% |
| Proposed method | 46% | 31% | 23% |
4.4 Discussion
Among the American patients who participated in the remote monitoring study, many took readings intensively at two different times of day. However, no uniformity in measurement timing was observed among the patients. The peak hours were 9 a.m. and 7 a.m. for Groups A and B, respectively. Group A showed a somewhat sharper peak than Group B, suggesting that differences in age or group also translate into different hours of daily life. Besides, each group showed many readings distributed over the hours from 10 a.m. to 6 p.m.
Therefore, the fixed-time method can only analyze some patients’ data and, as a result, risks losing other patients’ measurement results that fall outside the fixed times.
Moreover, nearly half the patient population takes readings during the midday and overnight time periods, including noon and midnight. Hence, using the fixed-time method for an analysis with distinction between the forenoon and afternoon hours would inappropriately result in readings losing the meaning of such distinctions as morning/evening or before taking medications/before supper.
Not only are these points problematic from the perspective of medication efficacy assessment, but they also may lead to making an incorrect decision when considering the time for taking medicine.
The proposed method successfully detected personalized patterns in taking readings and, at the same time, increased the proportion of readings classified into morning or evening compared with the fixed-time method. Plausibly, therefore, this method delivers the desired effect.
An analysis of personalized time periods requires a measurement dataset from multiple days to several weeks. When the purpose is to evaluate readings, for example, for medication efficacy assessment, the proposed method will use mean values averaged over at least two occasions during three-day to one-week periods. Hence, no problem is likely to arise.
The case in Fig. 9 may be an example in which the time of BP measuring varied significantly, resulting in outliers that would otherwise have fallen within either time period. This issue suggests the need to propose a method to increase or personalize the span of each time period by adjusting the parameters described in Subsection 3.1. On the other hand, it is recommended to take BP readings before taking any medication. This recommendation may have led to increased variability in the time that medicine was taken among patients who took doses immediately after BP measurement. Conversely, the recommendation may have been instrumental in skipping doses among patients who did not take medication immediately after BP measurement. From the standpoint of encouraging patients to make a habit of taking BP readings and medication at specific times, it may be undesirable to introduce variability in the time of BP measurement. This point needs further consideration.
5. For more widespread use in the future
5.1 Value of the color-coded graphing of BP readings by the proposed method
Fig. 10 shows an example of color-coded graphing of the weekly means of BP readings and pulse rates from actual cases, sorted by the proposed method into morning, evening, or ad hoc. The blood pressure bar chart consists of bars indicating the systolic BP at the top end and the diastolic BP at the bottom end. Bar A indicates the morning BP value, while the round dot on the downward extension of Bar A represents the pulse rate taken at the same time. Similarly, Bar B indicates the evening BP value while Bars C and D show the ad hoc BP readings.
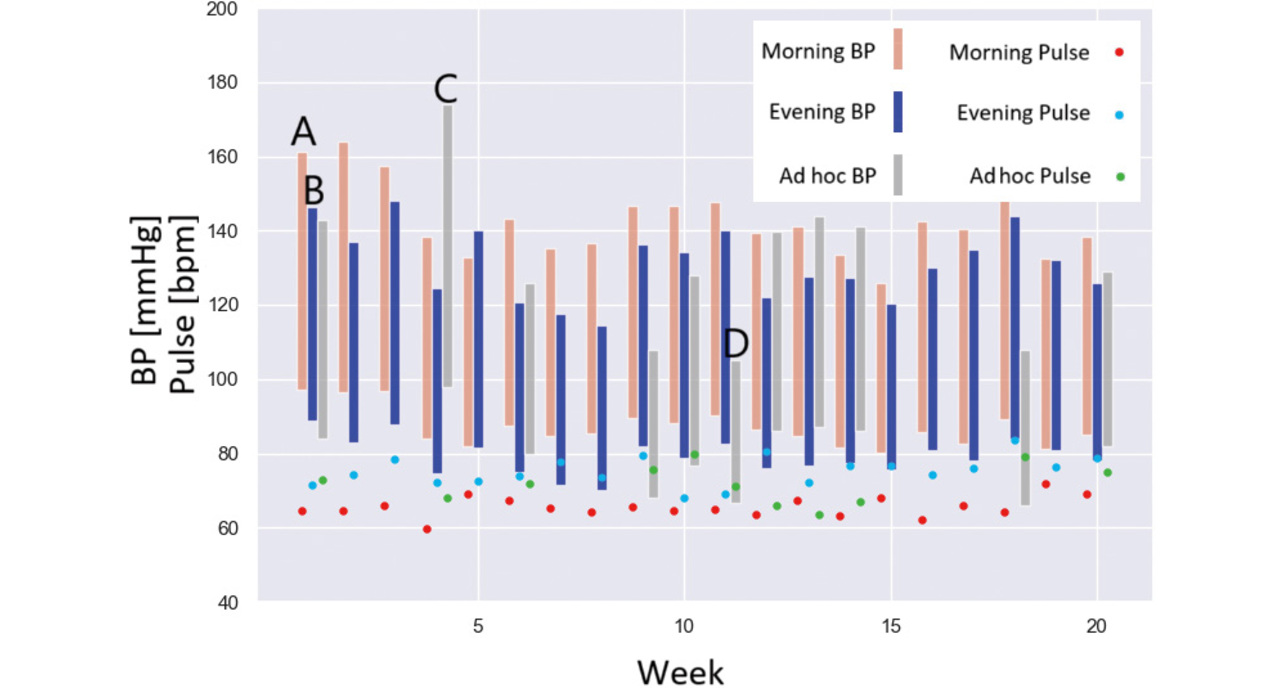
The chart shows that this case patient initially had high blood pressure, underwent a gradual BP drop with repetitive ups and downs, and often had higher BP in the morning than in the evening. Hence, the healthcare provider is expected to exercise creativity to improve medication administration to lower morning BP.
Besides, Bar C shows a BP reading higher than typically measured. At the same time, Bar D indicates a low BP condition, thereby suggesting that the patient may have experienced a symptom, such as dizziness, and taken readings outside the usual time. Based on this reasoning, the healthcare provider can consider whether to change the medication or the conditions for taking it.
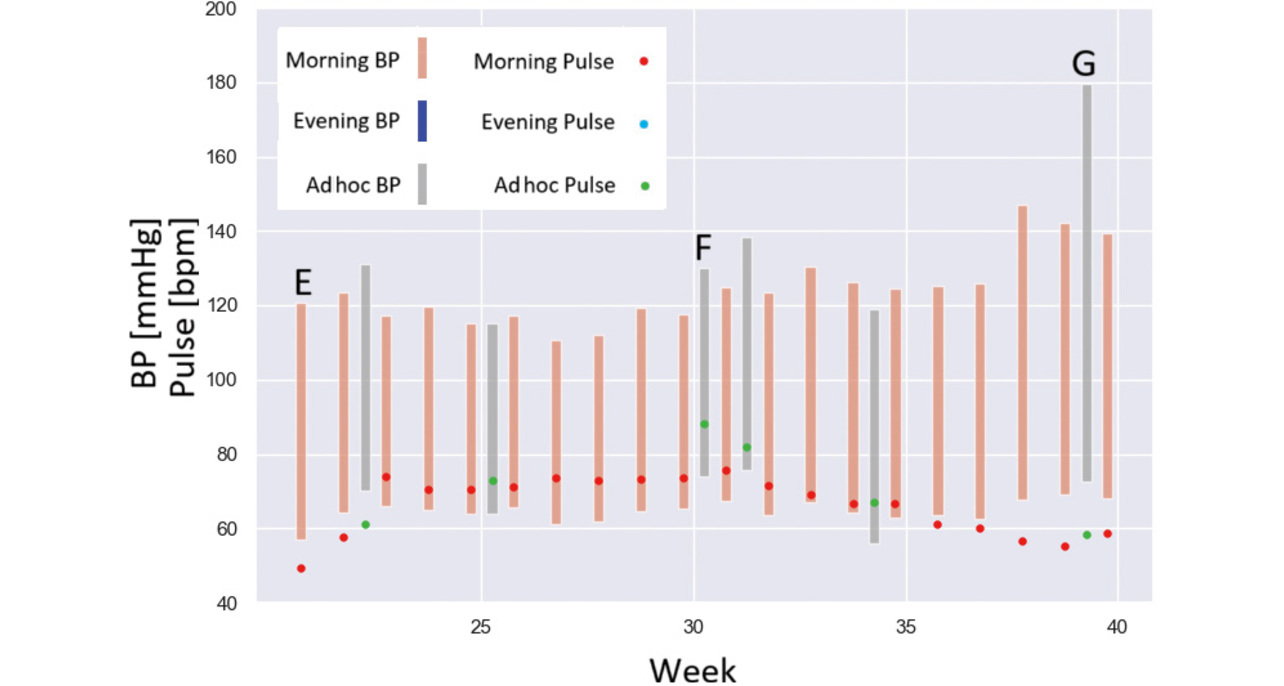
Fig. 11 shows a similar example of graphing for a different case. Bar E shows the morning BP value, indicating that the patient usually took only morning BP readings. Bar F indicates an ad hoc time period and shows a pulse rate higher than typically measured, suggesting that the patient may have experienced a symptom, such as palpitations, and taken readings outside the usual time. Similarly, Bar G shows a BP reading higher than typically measured, suggesting the patient may have experienced a symptom. Based on this reasoning, the healthcare provider can consider symptomatic coping methods or PRN instructions, among other things.
5.2 Summary
By making the conscious use of at-home BP measurement time periods to calculate the mean value for each time period, we solved the following four challenges with the conventional method, thereby enabling the automatic calculation of morning or evening BP readings under ordinary life conditions for each patient.
- There is no guarantee that patients will take measurements during the fixed time periods.
- Readings excluded for falling out of the fixed time periods may have significant implications, posing the risk of false negatives.
- Elderly persons and shift workers do not necessarily show a well-defined pattern of getting up and going to bed.
- The same time period may be segmented into either morning or evening.
For patients instructed by their physician to take readings in the morning or evening hours as per the guidelines, the values measured during these time periods would be used for diagnosis or to assess medication efficacy.
Readings taken during ad hoc time periods suggest that the patients may have experienced symptoms, such as dizziness or palpitations, and taken readings outside the usual time. As such, these readings should be assessed on a case-by-case basis.
From the above, the proposed method is promising because it imposes no additional workload on healthcare providers, allows them to check medications for excessive or insufficient efficacy easily, and provides patients with finely tailored symptomatic care.
For these functions and effects to be adopted for active use in remote monitoring and other systems and to win widespread endorsement from healthcare practitioners, their effectiveness must be verified through clinical evaluation.
Moving forward, we will delve deeper, identify additional challenges, propose solutions, and contribute to hypertension treatment and the onset prevention of cardiovascular disorders.
The author would like to express his heartfelt gratitude to Dr. Stephen D. Persell, Dr. Lucia Petito, Mr. Yaw Peprah, and Ms. Ji Young Lee at Feinberg School of Medicine, Northwestern University, for conducting the clinical evaluations on VitalSightTM as our collaborators, and for providing us with the obtained data.
References
- 1)
- E. Harris, “Majority of people live with uncontrolled hypertension worldwide,” JAMA, vol. 330, no. 16, p. 1515, 2023.
- 2)
- U.S. Department of Health and Human Services. “The Surgeon General’s Call to Action to Control Hypertension.” U.S. Department of Health and Human Services /Enhancing the health and well-being of all Americans. https://www.hhs.gov/sites/default/files/call-to-action-to-control-hypertension.pdf(Accessed: Feb. 12, 2025).
- 3)
- H. K. Wall et al., “Improving blood pressure control in the United States: At the Heart of Million Hearts 2027,” Am. J. Hypertens., vol. 36, no. 8, pp. 462-465, 2023.
- 4)
- A. P. Smith et al., “Target: BPTM: A national initiative to improve blood pressure control,” Hypertension, vol. 80, no. 12, pp. 2523-2532, 2023.
- 5)
- K. L. Margolis et al., “Effect of home blood pressure telemonitoring and pharmacist management on blood pressure control: a cluster randomized clinical trial,” JAMA, vol. 310, no. 1, pp. 46-56, 2013.
- 6)
- D. Shimbo et al., “Self-measured blood pressure monitoring at home: a joint policy statement from the American Heart Association and American Medical Association,” Circulation, vol. 142, no. 4, pp. e42-e63, 2020.
- 7)
- H. Sato, “Hypertension patient remote monitoring and its social implementation in the U.S.,” (in Japanese), Trans. Instit. Syst., Control and Inform. Engineers, vol. 67, no. 6, pp. 224-229, 2023.
- 8)
- L. C. Petito et al., “Remote physiological monitoring for hypertension in primary care: a prospective pragmatic pilot study in electronic health records using propensity score matching,” JAMIA Open, vol. 6, no. 1, pp. ooac111, 2023.
- 9)
- S. D. Persell et al., “Prospective Cohort Study of remote patient monitoring with and without care coordination for hypertension in primary care,” Applied Clinical Informatics, vol. 14, no. 3, pp. 428-438, 2023.
- 10)
- L. C. Petito et al., “Blood pressure outcomes at 12 months in primary care patients prescribed remote physiological monitoring for hypertension: a prospective cohort study,” J. Hum. Hypertens., vol. 37, no. 12, pp. 1091-1097, 2023.
- 11)
- J. Yatabe et al., “The current state and future of internet technology-based hypertension management in Japan,” Hypertension Research, vol. 44, pp. 276-285, 2021.
- 12)
- P. K. Whelton et al., “2017 ACC/ AHA/ AAPA/ ABC/ ACPM/AGS/ APhA/ ASH/ ASPC/ NMA/ PCNA Guideline for the prevention, detection, evaluation, and management of high blood pressure in adults: a report of the American College of Cardiology/American Heart Association task Force on Clinical Practice Guidelines,” Hypertension, vol. 71, no. 6, pp. e13-e115, 2018.
Bluetooth® and Bluetooth Low Energy are trademarks or registered trademarks of Bluetooth SIG, Inc., USA.
The names of products in the text may be trademarks of each company.