
















Establishment of a Power Consumption Simulation Method for Manual Assembly Lines
- Production Technology
- Manual Work
- Assembly Line
- Electric power Simulation
- Cell Line
Manual assembly lines are required to improve not only productivity but also energy efficiency1). In manufacturing sites, improvement activities are being conducted to address variations in the 4M factors—Man (operator), Machine (equipment), Material, and Method. However, in cell production systems (cell lines), the influence of operator-related factors on productivity is significant, and appropriately reflecting these human factors in simulations remains a technical challenge.
In this study, a power consumption simulation model capable of incorporating operator skill levels was developed for a cell line in our factory. As a result, the model achieved a power consumption prediction accuracy target of 95% and enabled visualization of energy losses. Moreover, the design effort for simulation model creation, previously non-standardized, was reduced from six days to three.
This paper describes a power consumption simulation method for cell lines that reflects variations in manual operations.
1. Introduction
Balancing productivity and energy efficiency is one of the major challenges that production engineers face on the assembly lines. In recent years, manufacturing sites have increasingly implemented simulation technologies for production forecasting2). They have also applied these technologies to KPI visualization and energy-saving initiatives in production activities involving air-conditioning facilities and even entire factories3). However, few cases exist in which simulation technology has been applied to cellular manufacturing lines that rely primarily on manual assembly by operators. Methods that account for the inherent variability of manual work have yet to gain widespread use. In addition, cellular manufacturing lines account for only a small share of a factory’s overall power consumption. This situation makes it difficult to determine whether the expected energy savings justify the investment (“break-even point”). As a result, many manufacturers stop at simplified estimates based on empirical rules and fail to develop and implement solutions to reduce energy losses.
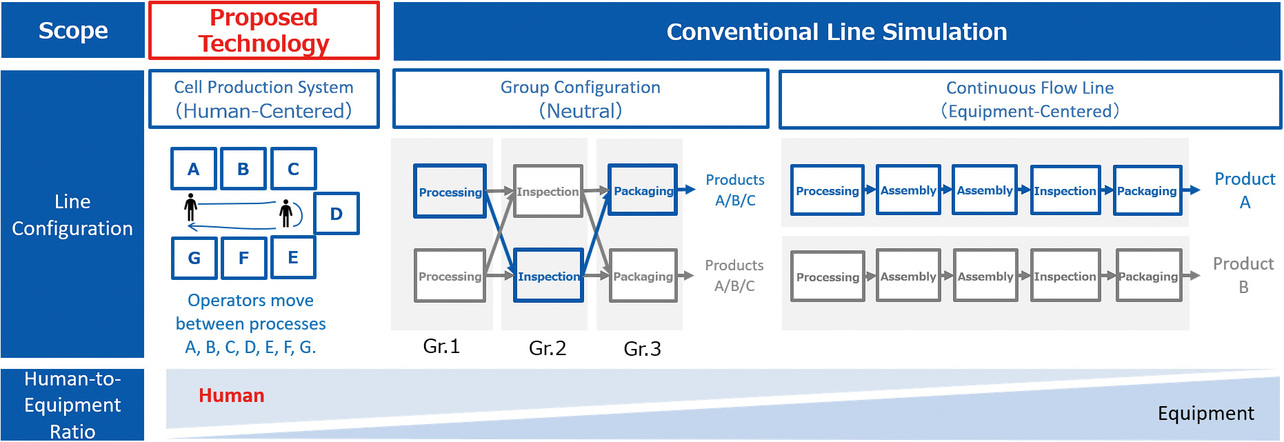
Hence, a simulation methodology capable of accurately visualizing short-term effects would help address the challenge of balancing productivity and energy efficiency. This paper proposes a simulation methodology for predicting power consumption on cellular manufacturing lines with particular attention to variations in the Four-M factors, especially those related to operators (Fig. 1).
2. Technical challenge
Cellular manufacturing lines are typically designed for high-mix, low-volume production. While these assembly lines offer high flexibility in task allocation and layout configuration, their design and launch demand a broad perspective from production engineers. Furthermore, on-site data varies widely in format and collection methods, and data evaluation practices are highly personalized, hindering the standardization of simulation methodologies. Traditionally, the mainstream line simulation method (hereafter “conventional simulation”) has been equipment-centric, reproducing process sequences based on each piece of equipment’s power consumption, operating rate, and idle time. Conventional simulations struggle to distinguish between tasks that depend on operator skill and those that do not, making it difficult to accurately account for the inherent variability of manual work. Furthermore, conventional simulations of equipment-centric configurations do not readily accommodate the characteristics of cellular manufacturing lines, which are prone to variations in the Four Ms due to operators. The challenge of balancing productivity and energy efficiency requires a quantitative evaluation method and a visualized timeline that identifies when and where energy losses occur. Hence, developing a simulation model that accounts for the inherent variability of manual work is positioned as a production engineering challenge across all phases of a cellular manufacturing line from launch to improvement activities.
3. Technical content
3.1 Simulation model building for cellular manufacturing lines
The power consumed in a cellular manufacturing line fluctuates not only because of the Four Ms (Man (operator), Machine (equipment), Material, and Method) but also because of the work environment (Environment), including the equipment layout or a spatially conditioned layout. In cellular manufacturing lines, in particular, their layout strongly affects the operator’s walking path and product dwell time, making it indispensable to perform a 4M+1E analysis that includes the work environment. Accordingly, this paper defines these factors as follows:
- Man: Operator’s skill level, walking path, and walking speed
- Machine: Machine/equipment type, operation time, and power consumption
- Material: Material (member/part) type and number of manufacturing lots
- Method: Work procedure and processing method (recipe)
- Environment: Layout and other work environment parameters
Using Siemens-made material-flow simulation software Plant Simulation4), we built a simulation model of a cellular manufacturing line in one of our factories (Fig. 2).
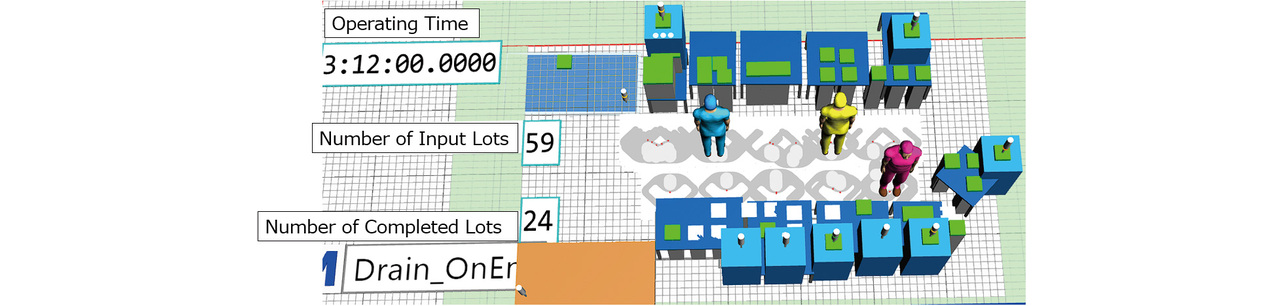
Data for each constituent were entered into the model to run the simulation and obtain power consumption over a given time. The simulation execution procedure is shown below (Fig. 3):

- (1) Data collection: Obtain power measurement data from semi-automated equipment. If doing so is difficult, the specified equipment value may be used instead.
- (2) Data preprocessing: Outlier elimination, filtering, and correction.
- (3) Integration into model: Enter the preprocessed data into the simulation model.
- (4) Parameter setting: Set the number of operators, the work time per unit, the number of production lots, etc.
- (5) Simulation execution: Simulate to obtain such output values as consumed power.
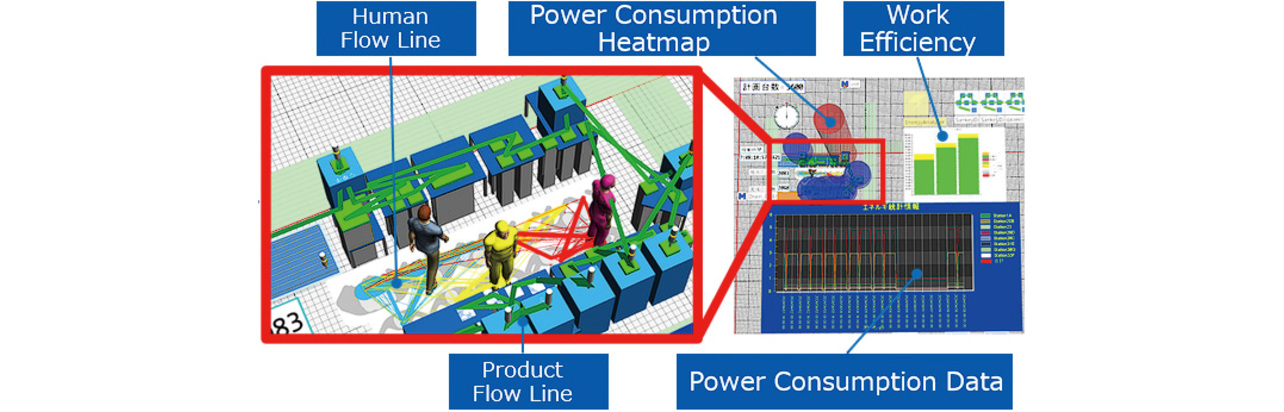
- (6) Visualization: Visualize the results with a heatmap or graph (Fig. 4).
- (7) Improvement proposal review: Develop a review proposal for the procedure/layout based on the visualization results.
The visualized data shall include the KPIs (work efficiency and power consumption) required to balance productivity and energy efficiency (Fig. 4).
3.2 Modelling of operator skill levels
Conventional simulation models stop at an analysis on an individual-equipment basis and struggle to account for operator skill levels. On cellular manufacturing lines, variations in the Four Ms due to operator skill levels significantly affect production activities, making it indispensable for simulation models to account for skill levels. Hence, we built a simulation model to reproduce variations in the Four Ms due to operator skill levels with the unit of analysis at the task level rather than the equipment level. The parameters reflected in operator skill levels are as follows:
- Working speed: Skill coefficient (e.g., novice=0.8; average =1.0; and skilled=1.2)
- Walking speed: Individually set according to each operator’s physical characteristics/work area
- Traveling distance: Automatically calculated based on the layout and the workspace
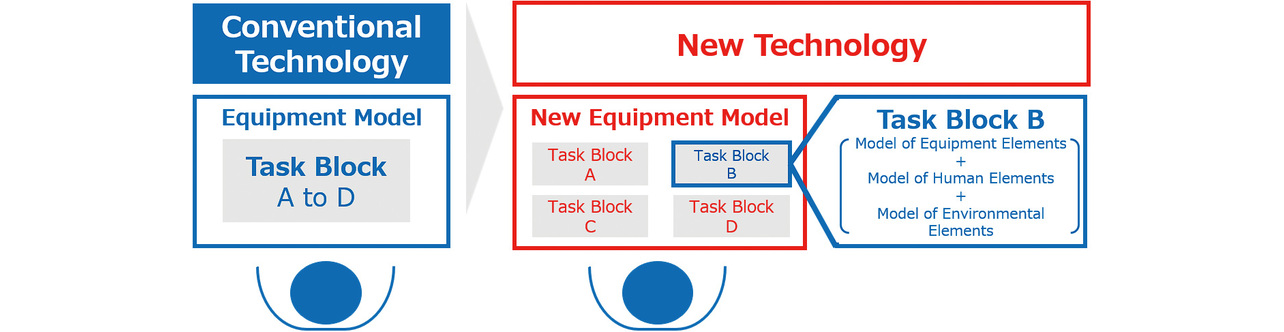
The conventional simulation modelling method conflates multiple tasks into a single parameter under a single equipment model, resulting in reduced accuracy. Our proposed simulation modelling method keeps the individual tasks within each equipment model separate as task blocks and assigns corresponding equipment/task parameters to them to improve accuracy. These segmented minimum units of analysis are defined as task blocks (Fig. 5).
Moreover, we developed arrow diagram functionality to reduce the model design effort and integrated it as a plug-in into the simulation model developed in this study. Individual task blocks are connected in an arrow diagram to determine task sequence dependencies and parallel processability (Fig. 6).

In addition to PIP loading/unloading to and from the automated equipment, this diagram shows other tasks, such as preparation, transfer, or inspection during automatic feeding, and encompasses synchronous and asynchronous timing conditions. Existing data in an operation schedule and a Gantt chart are used and checked against a timeline based on the set timing and the product dwell status to identify bottlenecks and to set the skill coefficient. For example, if a delay in inspection cascades to the following transfer, the simulation skill level is adjusted to the actual operator so that labor allocation can be reviewed to improve productivity. Then, the existing data and the obtained simulation output are compared to evaluate the integrity of the process transition and validate the simulation model.
3.3 Streamlining the model design effort
Segmentation into tasks creates a trade-off between increased design effort and improved accuracy. To address this issue, we broke down the cellular manufacturing line into constituent cells and elements and recombined them into reusable modules (Fig. 7).
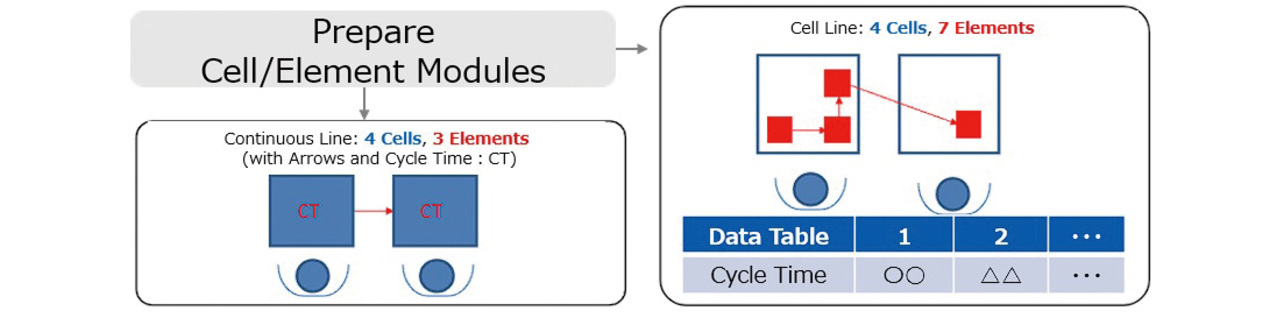
- Cell: A production-run unit with one operator or one equipment unit is counted as one cell.
- Element: The minimum unit consisting of a cell-to-cell relationship (cycle time and process flow <arrow>) is counted as one element.
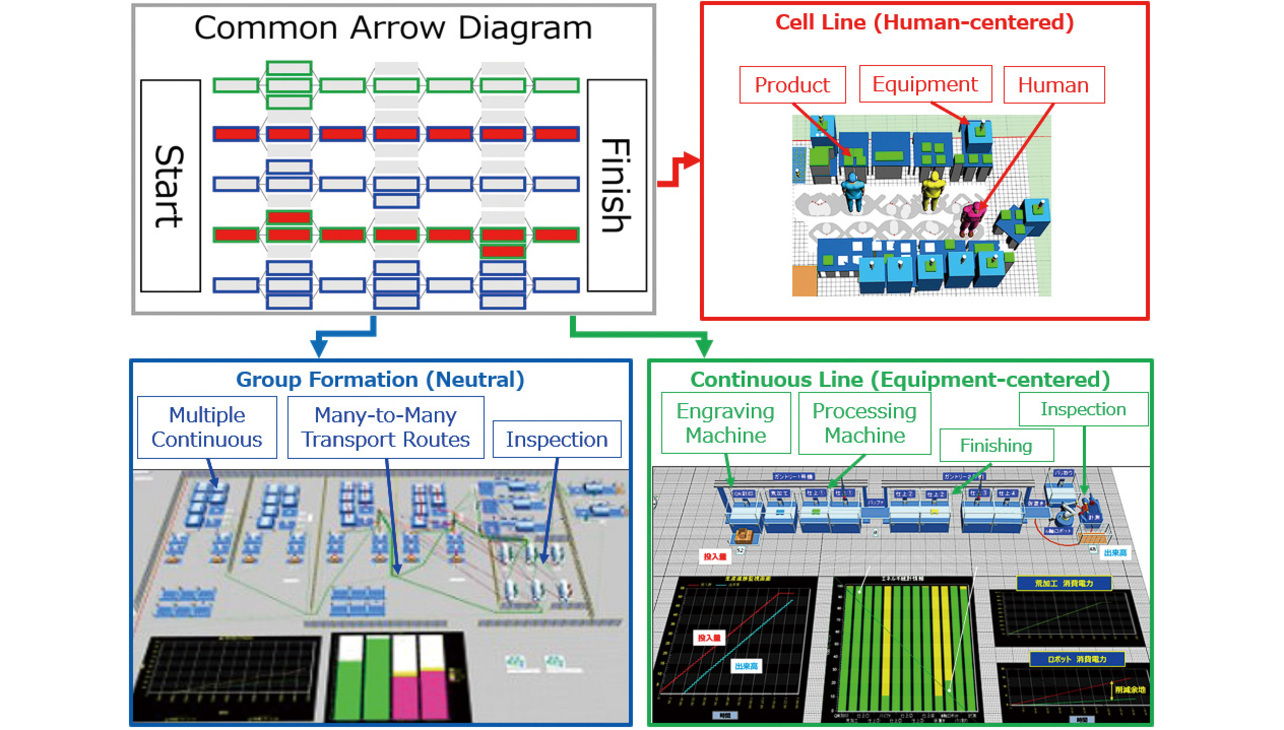
This definition led us to adopt a line-configuration-blind, generalized structure that enables the creation of reusable modules in both continuous manufacturing and cellular manufacturing lines. For example, the cellular manufacturing line in Fig. 7 consists of four cells and seven elements with a data table for the centralized control of the task in each cell. Task numbers, task contents, and cycle times are managed and referenced in tabular format for automatic generation of task blocks, thereby improving the design efficiency. Moreover, the vector connectivity of each element (cycle time and arrow) limits the scope of correction for a process sequence change or an operation pattern change, thereby minimizing the redesign effort. Furthermore, we developed a simulation methodology that immediately incorporates task dependencies and parallel processing configurations into models based on common arrow diagrams (Fig. 8).
4. Results and discussion
4.1 Results
We verified the prediction accuracy of our proposed simulation method for cellular manufacturing line power consumption over the nine days from Nov. 12 to 20, 2024. The prediction error and prediction accuracy used as the metrics for accuracy verification are defined as follows:
- Prediction error (%): (|consumption − predicted consumption|) ÷ consumption × 100
- Prediction accuracy (%): 100 − prediction error
The conventional simulation model represented equipment status as either running or stopped without accounting for the inherent variability of manual work and had a prediction error of 7.8%. On the other hand, our simulation model used individually set operator skill levels (novice=0.8; average=1.0; and skilled=1.2) to account for the processing time required for each task process (Table 1).
| Operator | Conventional (sec) | Proposed (sec) | Skill level coefficient |
|---|---|---|---|
| A | 82 | 99 | 1.0 → 0.8 |
| B | 122 | 109 | 1.0 → 1.2 |
| C | 106 | 106 | 1.0 → 1.0 |
As a result of skill-level adjustments, the equipment status was split into three segments: operation, weekday downtime, and weekend downtime, thereby reducing the prediction error to 4.5% (Fig. 9).
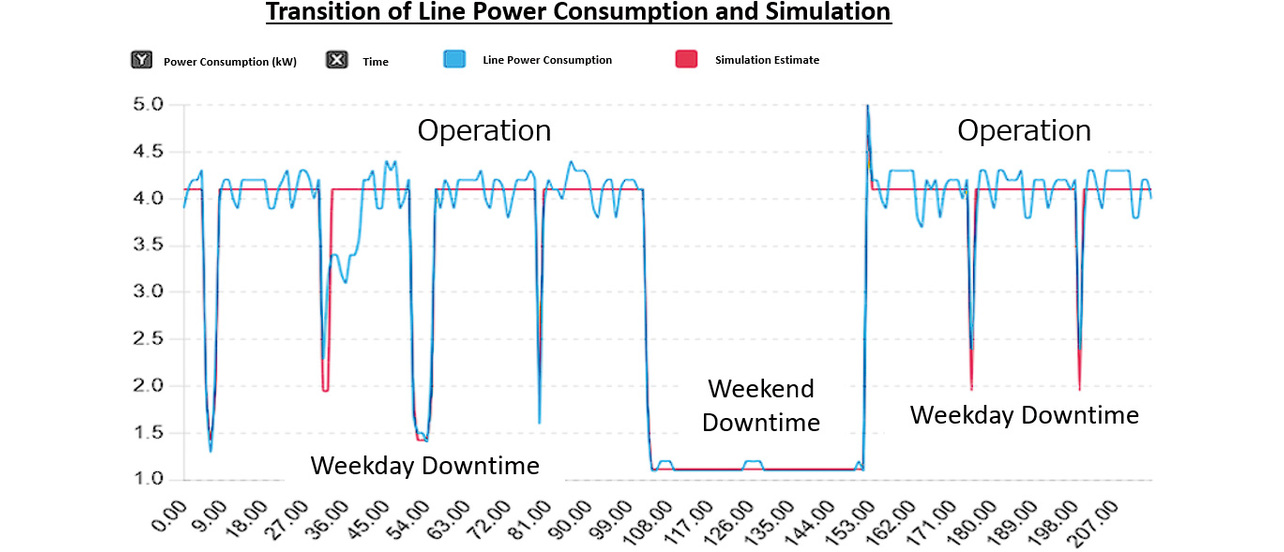
Variability in skill level alters the intra-process processing sequence or the timing of non-operation time, resulting in variations in equipment idle time and, in turn, affecting power consumption. The simulation model built for this study accurately accounted for each operator’s walking path, skill, task sequence, and equipment operation status, achieving a prediction accuracy of 95.5%. Moreover, based on the power consumption heatmap visualization, we analyzed the operation time (available ⇔ engaged) and the non-operation time (OFF) with a focus on equipment with a high consumption ratio. For the cellular manufacturing line of our selected size, we identified an energy-saving margin of approximately 10% in the non-operation time (Fig. 10).
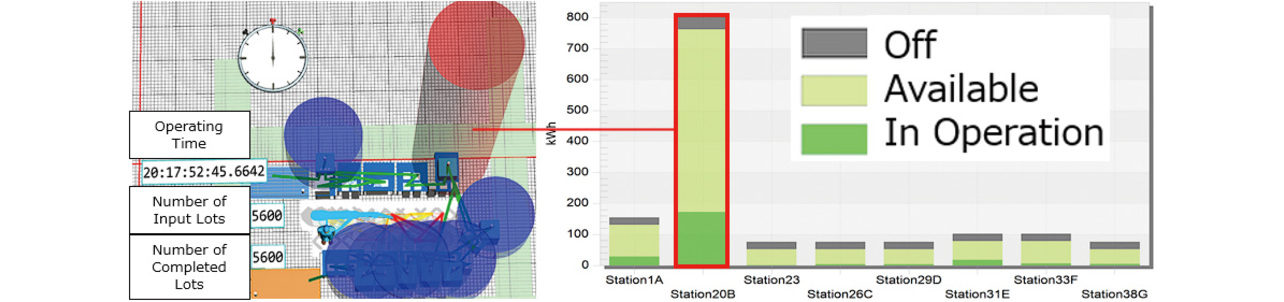
Our proposed method uses a heatmap to indicate semi-automated equipment (e.g., holding with heating and material cooling in resin forming machines). Standby power consumption also occurs while waiting for feeds; field management through equipment power ON/OFF control and timer control is effective for further energy savings5,6).
On the other hand, the conventional simulation methodology requires individual design for each process, the manual setting of process sequences, and ad-hoc definitions of data structures. For the cellular manufacturing line of our selected size, the required design effort was six man-days. Our proposed simulation methodology enhances the reuse rate of design data and enables their deployment to configurations beyond cellular manufacturing lines. As a result, the design effort was reduced from six man-days to three, yielding a 50% reduction (Table 2).
| Design process | Conventional (man-days) |
Proposed (man-days) |
Reduction effect attributable to |
|---|---|---|---|
| Process-specific model design | 1.2 | 0.2 | Reusable cell/element modules |
| Task sequence definition | 1.5 | 0.5 | Reusable arrow diagrams |
| Data structure/input design | 1.5 | 0.8 | Data table-based centralized control |
| Verification/correction | 0.8 | 0.8 | ― |
| Visualization design | 0.5 | 0.2 | Use of visualization template |
| On-site review/Adjustments & responses | 0.5 | 0.5 | ― |
| Total | 6 | 3 | ― |
4.2 Discussion
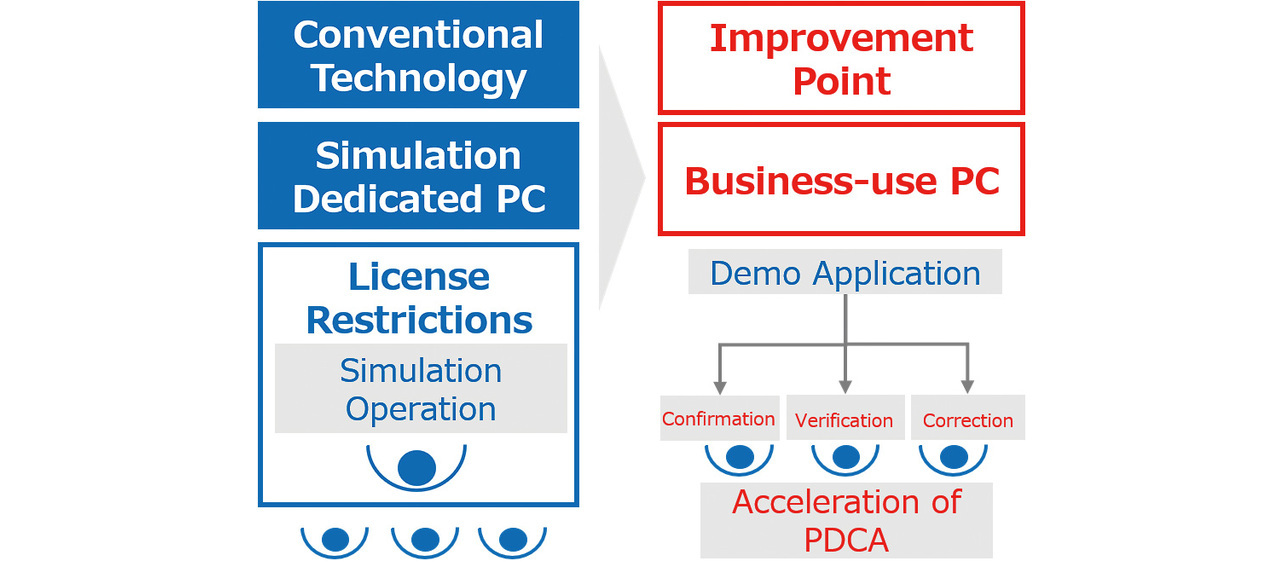
Our proposed simulation methodology advances over its conventional counterpart by enabling the quantitative reproduction of irregular variations in walking paths and task sequences, which are due to operators and inherent to cellular manufacturing lines. This advancement contributes to energy efficiency improvement through task layout and walking path reviews. In addition, the simulation model and design procedure developed in this study can be deployed not only to cellular manufacturing lines but also to other forms of high-mix, low-volume production on manual assembly lines. The arrow diagram-based structured task sequencing is particularly effective in enhancing the efficiency of visualization and redesign of process sequences, providing a technological element that adds flexibility to address design changes. With regard to data acquisition, operation schedules stored in an existing manufacturing execution system (MES) or point-of-production (POP) system, as well as Gantt charts kept ready on-site, can be used to run high-accuracy simulations while minimizing additional investment, albeit some cases may require introducing new sensing technology7). However, commercial simulation software has license restrictions or poses a high challenge to the uninitiated, often limiting its use to specific engineering sections/departments. To solve these restrictions, we developed a dedicated demo application for direct operation/checking by everyone involved (Fig. 11).
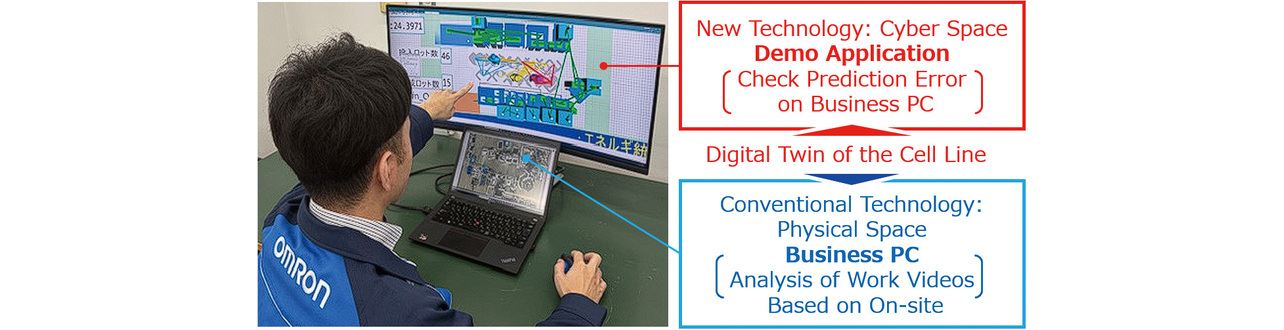
Moreover, the PDCA cycle for on-site improvement can be accelerated by applying a digital twin of the cellular manufacturing line in the cyber-physical space (Fig. 12).
5. Conclusions
This study aims to improve energy efficiency and reduce model design efforts for cellular manufacturing lines. Our established simulation methodology accounts for on-site 4M+1E data with high accuracy. The simulation model developed in this study incorporates variable factors in operational practices, such as operator-specific walking paths, task sequences, skill differences, and equipment operation status. As a result, the prediction accuracy of power consumption exceeds 95%. Moreover, the results of segmentation and analysis of task sequences and non-operation time indicate an energy-saving margin of up to 10% due to equipment idle time and product dwell time. Meanwhile, with a modular design that combines cell/element unit definitions and arrow diagram functionality, the required design effort for the cellular manufacturing line of our selected size was reduced from the conventional six man-days to three man-days. In addition, the demo application introduced in this study provides an execution environment for everyone involved to review improvement proposals directly, thereby accelerating PDCA. From the above, a line simulation methodology has been established that supports (a) high-accuracy simulation modelling through 4M+1E on-site information integration and (b) simulation execution with skill levels accounted for8).
6. Postscript and prospects
The new simulation model developed in this study accounts for variations in the Four Ms due to the operator (Man) specific to cellular manufacturing lines, enabling high-accuracy prediction of power consumption in assembly lines. This model enables quantifying energy losses and planning specific improvement measures. A modular design methodology, introduced alongside a demo application, provides an execution environment for shop-floor-driven provision of practical energy-saving technological solutions. Moving forward, we will verify the applicability of these outcomes at manufacturing sites with different line sizes and in different manufacturing sectors. We will also pursue their linkage with real-time data through AI and IoT. Ultimately, this work aims to evolve the methodology into a system capable of automatically estimating operator skills and optimizing overall factory operations9).
References
- 1)
- OMRON Corporation. “What is ‘Energy Productivity Enhancement’ OMRON Aims at?” (in Japanese), Control Equipment. https://www.fa.omron.co.jp/solution/energy-productivity/ (Accessed: Nov. 10, 2025).
- 2)
- M. Kotake and N. Sugiyama, “Application of production simulation technologies to production line design and production forecasting,” (in Japanese), Toshiba Rev., vol. 69, no. 9, pp. 8-11, 2014.
- 3)
- T. Moriwaki, “Effectivity of energy measurement and successive energy conservation promotion activities with factory energy management systems,” (in Japanese), Mitsubishi Electr. Tech. Rep., vol. 94, no. 7, pp. 23-27, 2020.
- 4)
- Siemens AG. “Plant Simulation.” SIEMENS. https://plm.sw.siemens.com/ja-JP/tecnomatix/plant-simulation-software/ (Accessed: Nov. 10, 2025).
- 5)
- S. Ito et al., “Realization of energy-saving top-runner factory through energy-saving solution technology,” (in Japanese), Panasonic Tech. J., vol. 57, no. 1, pp. 25-30, 2011.
- 6)
- T. Nakai and S. Ashida, “On-site data utilization for energy productivity enhancement,” (in Japanese), Instrum. Autom., vol. 52, no. 5, pp. 5-14, 2024.
- 7)
- OMRON Corporation. “EQS-AD10-E EQ ANDON / Advantages.” (in Japanese), Control Equipment. https://www.fa.omron.co.jp/products/family/3236/ (Accessed: Nov. 10, 2025).
- 8)
- Waseda University. “Joint R&D with OMRON Corporation Starts.” (in Japanese), https://www.waseda.jp/top/news/92147 (Accessed: Nov. 10, 2025).
- 9)
- Cabinet Office. “Basic Program for Science and Technology.” (in Japanese), Cabinet Office Website. https://www8.cao.go.jp/cstp/kihonkeikaku/5honbun.pdf?utm_source=chatgpt.com (Accessed: Nov. 10, 2025).
The names of products in the text may be trademarks of each company.