


Sensor Technology to Realize Continuous Blood Pressure Monitoring
- Continuous blood pressure monitoring
- Non-invasive blood pressure monitoring
- Tonometry method
- MEMS pressure sensor
- Stress simulation
OMRON HEALTHCARE Co.,Ltd. is developing new technology to enable beat-by-beat blood pressure monitoring. The conventional oscillometric equipment was unable to measure blood pressure continuously and detect rapid blood pressure changes. Therefore, the prediction of cerebral and cardiovascular disease risks is expected to improve from the development of beat-by-beat blood pressure monitoring. The tonometry method is the beat-by-beat blood pressure measurement technology by which the pressure sensor is held to the skin directly. Accordingly, the pressure sensor must be sealed within potting resin to improve vibrational resistance. However, the sensor characteristics and the production yield were being deteriorated by the stress from the potting resin. To counter this, the authors developed a new MEMS pressure sensor consisting of 46 sensing elements with ASIC. Moreover, new packaging and assembly methods were developed to preserve the highest precision of the characteristics of 46 pressure sensor elements and improve their production yield.
1. Introduction
Nowadays, the culture has been established to utilize the information of blood pressure for heart disease treatment, management, and prevention by measuring it not only at hospitals but also at home. Reasons for the popularization of blood pressure measurement at home include the development of the oscillometric method, which does not require users to have special knowledge or techniques of blood pressure measusrement 1) 2), the promotion of studies which showed the importance of blood pressure measured at home represented by the Ohasama Study 3), and the advancement of blood pressure measurement apparatus such as the automation and downsizing of instruments and the improvement of usability.
On the other hand, even today when home sphygmomanometers have become popular and medical treatments for high blood pressure have evolved, it is known that there are still cases where appropriate antihypertensive treatment is not performed 4) . In the oscillometric method, because blood pressure is measured by wrapping a cuff around the upper arm or wrist for compression to interrupt the blood flow, it takes several tens of seconds for one measurement. However, it is considered that there are fluctuations in blood pressure with a high risk of developing cerebrovascular and cardiovascular diseases which cannot be detected by the oscillometric method, because the blood pressure actually varies beat by beat. Therefore, OMRON HEALTHCARE Co.,Ltd. is working on the development of instruments, which can measure beat-by-beat blood pressure continuously, and making efforts to contribute further to present medical treatment for high blood pressure 5).
As an instrument which measures beat-by-beat blood pressure continuously in a non-invasive way, there is a product using the tonometry method called “JENTOW” 6). The tonometry method is a method of measuring the pressure pulse wave by pressing pressure sensors directly against the skin to calculate the blood pressure from the pressure pulse wave. While JENTOW is a large stationary instrument, OMRON HEALTHCARE Co.,Ltd. is currently developing the continuous blood pressure measurement technology to realize a wrist-wearable instrument. It is also making efforts to expand the measurable environment, improve usability and enhance measurement stability, etc.
In this paper, we describe the MEMS pressure sensor which was newly developed to realize the continuous blood pressure measurement technology, as well as its package structure and assembly method, based on OMRON HEALTHCARE Co.,Ltd.’s expertise on blood pressure measurement and OMRON Corporation’s sensor development technology.
2. Continuous blood pressure measurement and sensor technologies
2.1 Tonometry method
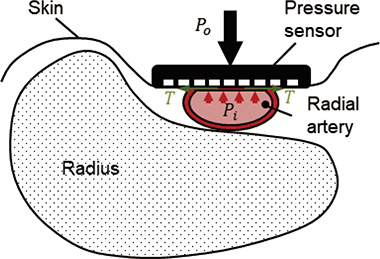
Fig. 1 shows the diagram of tonometry method. Unlike the oscillometric method in which the cuff worn on the upper arm or wrist compresses blood vessels, in the tonometry method, the pressure sensors are pressed directly against the skin to measure the pressure pulse wave and to calculate the blood pressure. If the pressure sensors are pressed against the skin above an artery, the dynamic equilibrium on the pressed surface can be expressed by the equation considering the thickness of the blood vessel wall based on Laplace’s law 7).
-
 (1)
(1)
 is the circumferential tensile force on the blood vessel wall,
 is the blood pressure,
 is the external pressure, and
 and
and
 are the curvature radii on the sensor pressing surface on the inner and outer walls of blood vessel, respectively. Equation (1) can be transformed to equation (2).
-
 (2)
(2)
As Figure 1 shows, if the blood vessel is squashed flat on the sensor pressing surface,
 and
and
 hold and equation (2) can be approximated like equation (3).
-
 (3)
(3)
In other words, if the blood vessel can be pressed with appropriate pressing force, the pressing force (i.e., the pressure detected by the pressure sensors) becomes equivalent to the blood pressure. Therefore, if the pressure sensors are retained with the optimum pressing force, it is possible to measure the blood pressure continuously without interrupting the blood flow and to measure the pressure pulse waveform which is equivalent to the blood pressure waveform measured by inserting a catheter into the blood vessel. In addition, the conditions of the equation (3) are established best when the pressure detection element is located directly above the blood vessel. Therefore, to use the tonometry method, it is necessary to use pressure sensors with multiple pressure detection elements to correctly determine the relationship between the blood vessel position and the pressing position.
2.2 Requirements for sensor technology
As described in Section 2.1, because the tonometry method is characterized by the direct pressing of pressure sensors against the skin, the requirements for sensors using this method are fundamentally different from blood pressure measurement using the oscillometric method.
The first requirement is the number of pressure sensors. In the tonometry method, it is necessary to press the pressure sensors directly against the skin and determine the blood vessel and pressure sensor positions correctly, to detect the pressure pulse wave transmitted to the surface of the skin directly above the center of the blood vessel. Therefore, in the case of the radial artery of the wrist, a few dozen pressure sensor elements need to be placed at intervals of hundreds of micrometers. In addition, sphygmomanometers based on the oscillometric method are only required to ensure the accuracy of a single pressure sensor which measures the pressure in the cuff. On the other hand, in the case of the tonometry method, it is necessary to assure the accuracy of all pressure sensors which are placed at narrow intervals.
The second requirement is a special packaging. The sensor, mainly used in the oscillometric method, is a pressure sensor (MEMS pressure sensor) made by the semiconductor process, which measures the pressure in the cuff using the air as a medium for pressure transmission. On the other hand, in the case of the tonometry method, it is necessary to protect the semiconductor sensor chips with highly biocompatible resin for the purpose of pressing the MEMS pressure sensors directly against the skin. As a result, the material which transmits the pressure is not the air, but rather the resin. General resistance type semiconductor pressure sensors detect mechanical deformation of the sensor area using a semiconductor strain gauges that convert it into an electric signal. Therefore, if any force other than the pressure which should be detected is applied to the sensor, an error occurs. For this reason, when packaging, anything that may possibly put stress on the sensor chips or cause residual stress is eliminated as much as possible before mounting. However, the tonometry method requires a special packaging technology in which resin, that may deteriorate the characteristics, needs to be applied to the pressure sensor surface intentionally.
2.3 Issues with conventional instruments
Table 1 shows the issues with conventional pressure pulse wave or blood pressure measuring instruments based on the tonometry method. The issues are broadly divided in terms of sensor, sensor mounting and the entire system.
| No. | Category | Issue |
|---|---|---|
| 1 | Sensor | There are a large number of electrodes and the mounting yield drops. The resistance to noise is poor. |
| 2 | Sensor mounting | Applying the resin deteriorates the sensor characteristics. Applying the resin causes a drop in yield. |
| 3 | System | The instrument is large and the measuring environment is limited. |
Conventional multi-element MEMS pressure sensors have a simple structure in which multiple piezoresistive elements are formed on the diaphragm. The number of electrodes required is dependent on the number of elements formed. As a result, the large number of electrodes was the cause of deterioration in mounting yield in the process. In addition, the wires needed to be pulled directly out from the piezoresistive elements to the circuit board in the subsequent stage, which caused deterioration in sensor properties and noise resistance.
In terms of mounting, there was a problem of deterioration in sensor properties and mounting yield, because the sensor was stressed by the expansion and shrinkage of resin due to heat and the shrinkage of resin during curing and the resin needs to be applied directly to the pressure sensor surface.
Furthermore, because there is also the problem that the measuring environment is limited in the case of a conventional stationary type instrument, wrist-wearable instruments need to be small. The causes of an increase in device size include an increase in the circuit size, because multiple pressure sensors are processed as well as because countermeasures need to be taken on the circuit in the subsequent stage due to the low noise resistance of the sensors. As a result, there was also a problem which needed to be solved in the entire system including the sensors.
Based on the above, when developing a new continuous sphygmomanometer, the following two main types of developments are required to solve the aforementioned problems related to the sensor:
- The development of a multi-element MEMS pressure sensor with superior sensor properties and noise resistance for which the mounting yield can be improved
- The development of a new sensor package structure and assembly method which retain superior properties, as well as enable stable production, even if a resin is applied to the surface of the above multi-element MEMS pressure sensor
3. Development of sensor chip and assembly method
3.1 Development of sensor chip
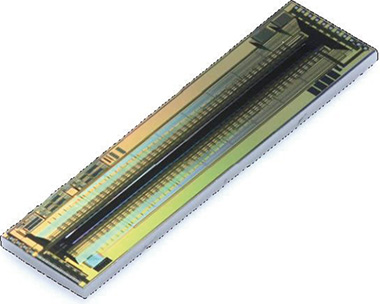
For the drastic improvement of the properties and mounting yield of the pressure sensor for the aforementioned continuous sphygmomanometer, we developed a new multi-element MEMS pressure sensor (hereinafter referred to as “sensor chip”) as shown in Fig. 2 The sensor chip we developed, which is 11.5 mm in length, 3.0 mm in width and 400 μm in thickness, has a diaphragm measuring 9.5 mm long, 0.26 mm wide and 5 μm thick in the center, and piezoresistance is formed on the diaphragm. If the diaphragm deforms under pressure, the stress is generated depending on the deformation amount, and this stress changes the electric conductivity, i.e., resistivity, in the piezoresistance. By forming a bridge circuit with the piezoresistance, the variation in resistance depending on the pressure is detected in the electric voltage. The pressure sensor we developed has 46 bridge circuits of piezoresistance on the diaphragm at short intervals of 200 μm and multiple temperature sensors on the sensor chip. Placing multiple temperature sensors on the sensor chip enables the direct measurement of the sensor chip temperature, but not the atmospheric temperature. this sensor can be used for the temperature correction of pressure conversion formula. Furthermore, the sensor chip developed is also equipped with ASIC (Application Specific Integrated Circuit), and a multiplexer, operational amplifier and filter circuit are mounted on the sensor chip. Equipping all conventional peripheral circuits in the sensor chip has the following advantages:
- Equipping a multiplexer enables the reduction of the number of electrodes, decreases the production difficulty of postprocess and enhances the mounting yield.
- Equipping an operational amplifier enables the amplification of the outputs of the respective pressure sensor elements with a short wiring length, as well as the impedance conversion, resulting in the enhancement of noise resistance.
- The circuit size can be reduced in the subsequent stage, realizing a reduction in the entire system size.
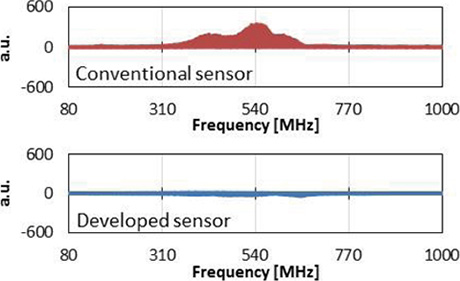
Table 2 shows a comparison of the number of electrodes between a conventional sensor and the new sensor. The conventional sensor in the Table 2 is a pressure pulse wave measuring instrument based on the tonometry method, which is called a CAP/FAP sensor. Compared to the conventional sensor, the new sensor has a larger number of pressure and temperature sensor elements, but the number of electrodes in the new sensor is reduced to less than one-third of that in the conventional sensor. In addition to equipping an operational amplifier and filter circuit to enhance the noise resistance, the noise resistance was enhanced further by protecting the sensor chip except for the diaphragm with a metal shield as shown in Fig. 2 , Fig. 3 shows the results of the EMS (Electro-Magnetic Susceptibility) test conducted on the conventional and new sensors, respectively. In the test, a carrier wave of 80–1,000 MHz, a modulation wave of 2 Hz and a field intensity of 3 V/m were used as the test conditions. The vertical axis of Fig. 3 shows the degree of the influence of electromagnetic wave irradiation, and the horizontal axis shows the frequency of the carrier wave irradiated. We can find that the new sensor itself has a higher level of noise resistance.
| Instrument | No. of elements | No. of electrodes |
|---|---|---|
| Conventional sensor | 30 ch for pressure + 4 ch for temperature | 72 |
| New sensor | 46 ch for pressure + 2 ch for temperature | 22 |
3.2 Proposal of new package structure
In blood pressure measurement based on the oscillometric method, the pressure in the cuff is directly transmitted to the semiconductor pressure sensor through the medium of air. On the other hand, in continuous blood pressure measurement based on the tonometry method, it is necessary to press the pressure sensor directly against the skin, as already stated. Therefore, the pressure sensor needs to be sealed with highly biocompatible resin (hereinafter referred to as “potting”). However, if the elastic modulus of the resin used for potting is too low, the deformation amount will be high and the pressure will not be transmitted properly. For these reasons, it is necessary to select a resin with hardness to some extent. On the other hand, if the elastic modulus is too high, potting the pressure sensor with the resin generally deteriorates the properties significantly, because the resin makes stress reside in the sensor chip during curing and also expands and shrinks with changes in the atmospheric temperature. Therefore, it is necessary to develop a new package structure and assembly method which will not cause deterioration in properties even if the pressure sensor is potted with a resin with a high elastic modulus. In particular, it is important to conduct packaging to ensure uniformity for all 46 pressure sensors, as well as pressure measurement accuracy.
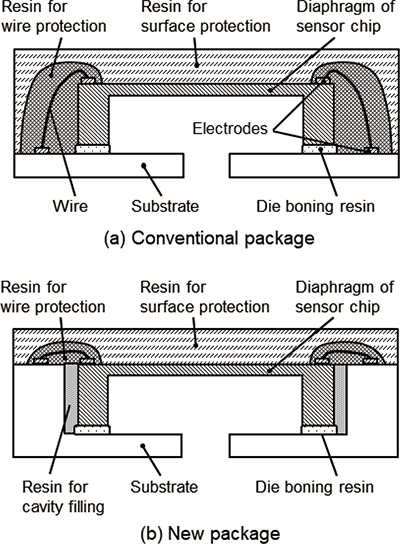
In order to extract signals from the sensor chip, we chose wire bonding from among various assembly methods. There is a background that wire bonding has responded to the reduction in electrode terminal pitch due to a decrease in chip size. Also wire bonding has the advantage of low cost and high productivity 8) generally. On the other hand, in the case of general wire bonding, packaging needs to be performed to prevent the wire from being stressed. However, as previously mentioned, resin for protecting the wire is also required, because the sensor is pressed directly against the skin for continuous blood pressure measurement. In summary, as Fig. 4 (a) shows, potting needs to be performed using a resin with a high stress intensity for protecting the wire and a resin with superior biocompatibility for covering the entire sensor chip. In other words, it is necessary to apply two different highly elastic resins with different properties.
As mentioned above, a highly elastic resin needs to be chosen as the wire protection resin to prevent wire disconnection. However, in the prior evaluation, non-uniform properties of the 46 pressure sensors and significant deterioration in temperature properties were observed. As a result that the structure shown in Fig. 4 (a) caused compression of the wire protection resin in the direction of the short side of the sensor chip as well as residual tensile stress. Therefore, it is necessary to choose a new structure, assembly method and resin which minimize the stress generated by the wire protection resin. The authors invented a structure in which the sensor chip is die-bonded on a bathtubshaped ceramic substrate, in order to reduce the amount of the wire protection resin, as well as to minimize the stress applied to the sensor chip by the wire protection resin as shown in Fig. 4 (b). Because the ceramic substrate has a cavity, it is possible to minimize the amount of the wire protection resin with a high elastic modulus by fixing the sensor chip in this cavity and then filling the gap between the ceramic substrate and the sensor chip with a resin with a low elastic modulus that is less susceptible to stress (hereinafter referred to as “filling resin”). Furthermore, it is considered that residual stress due to the wire protection resin is less likely to be generated, because the wire protection resin is only applied to the sensor chip surface. In the following section, we describe the optimization of the bathtub-shaped substrate in detail.
3.3 Optimization of structure through stress simulation
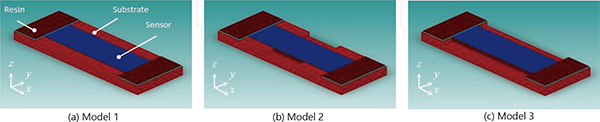
We conducted a stress distribution simulation to optimize the structure of the bathtub-shaped substrate we proposed, in which the stress due to the expansion and shrinkage of the wire protection resin has the least influence on the sensor chip. As Fig. 5 shows, we prepared three types of simulation models. Model 1 is a simple bathtub structure Fig. 5 (a), Model 2 is a structure from which the central part of the bathtub is eliminated Fig. 5 (b), and Model 3 is a structure which has a bathtub only for the wire protection resin and has no wall in the central area Fig. 5 (c). The sensor chip had the physical properties of a silicon semiconductor, and the bathtub substrate had those of a ceramic. In addition, the wire protection resin had an elastic modulus of 470 MPa and a thermal expansion coefficient of 51 ppm/°C. We analyzed how the stress was distributed on the sensor chip when the temperature was fluctuated by 50°C.
Fig. 6 shows the results of simulating the stress distribution generated on the diaphragm of Models 1–3. The horizontal axis L in Fig. 6 represents the distance from the center of the diaphragm, and the pressure sensors are placed between −4,500 and 4,500 μm at intervals of 200 μm on an actual sensor chip. The vertical axis in Fig. 6 represents the stress in the direction of the y axis, and the positive and negative values represent compression stress and tensile stress, respectively. In Fig. 6, (a), (b) and (c) show the results of Models 1–3, respectively. The line marked “Reference (Old package)” shows the stress distribution simulation results of the conventional package, which are not included in the simulation models in Fig. 5 but are shown in Fig.
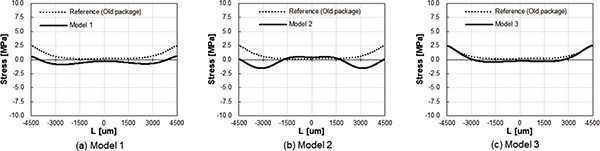
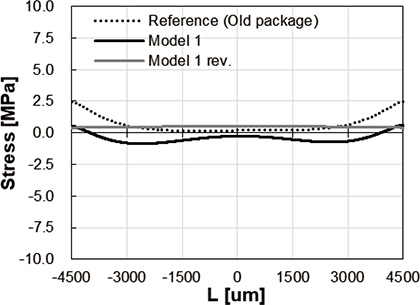
4 (a) and described for reference. Compared to the conventional package, in the case of Model 1, the average value of the stress is close to zero, and the variation among the pressure sensor elements is small. In the case of Model 2, the average value of the stress applied to the diaphragm is close to zero, but the variation among the pressure sensor elements is the same as that of the conventional package. The stress distribution in Model 3 is the same as that of the conventional package, which means there is little effect of structural change. From these results, it is considered that the bathtub structure of model, in which the sensor chip is completely surrounded by walls, is less susceptible to the stress generated by the wire protection resin and can maintain the properties of the respective pressure sensor elements uniformly, without deteriorating the sensor properties. Furthermore, without going into detail, fine adjustment of various parameters related to the structure in Model 1 enables a stress distribution close to flat as shown in Fig. 7.
3.4 Optimization of wire protection resin
To package the sensor chip we developed using the bathtubshaped ceramic substrate, it is necessary to select several types of resins for the respective applications as previously explained. Table 3 summarizes the names and applications of the respective resins.
| Name | Application |
|---|---|
| Die bonding resin | To bond a sensor chip and a ceramic substrate together |
| Filling resin | To fill the gap between a sensor chip and a ceramic substrate to prevent a wire protection resin from entering |
| Wire protection resin | To protect wires |
| Surface protection resin | To ensure the protection of the sensor chip and biocompatibility of the parts which contact the human body to transmit pressure |
Although a detailed description of the selection process is omitted in this paper, resins with a low elastic modulus should be selected as die bonding and filling resins, considering their applications in order to prevent the influence of residual stress. And a resin which has superior biocompatibility, as well as mechanical properties which enable the measurement of the pressure pulse waves of arteries, should be selected as a surface protection resin. In this paper, the process of selecting the wire protection resin is described below. Concerning the wire protection resin, there is a trade-off that a resin with a low elastic modulus is preferred to reduce the residual stress in the sensor chip as much as possible, while a resin with a high elastic modulus is preferred to protect the wires. In addition, if the wires are covered with a resin with a high elastic modulus, it may be possible that the expansion and shrinkage of resin due to temperature add stress not only to the sensor chip, but also to the wires, and this will lead to wire disconnection. For this reason, it is difficult to draw a conclusion only through a simulation. Therefore, it is necessary to actually mount the sensor on a bathtub-shaped ceramic substrate to confirm the actual value.
The authors mounted a sensor chip on the developed bathtubshaped ceramic substrate to evaluate sensor properties (offset, pressure sensitivity, linearity and temperature properties of each item) and mounting yield. Concerning the conditions for the wire protection resin, we created prototype samples for evaluation, using two types of resins which were an epoxy-based resin with a high elastic modulus and silicon-based resin with a low elastic modulus. We chose the silicon-based resin with a higher elastic modulus among silicon-based resins from the perspective of wire protection, although it had a lower elastic modulus than epoxybased resins. Although a detailed explanation on the sensor properties is omitted in this section and a description about the final product is provided in the next section, the sensor properties of both epoxy-based and silicon-based resins were good and, the variation among pressure sensor elements was small. However, of the prototype samples mounted with the epoxy-based wire protection resin, wire disconnection was observed in 53 percent (8/15). On the other hand, there was no prototype samples mounted with the silicon-based wire protection resin which caused wire disconnection. In the process where the ceramic substrate is mounted to an FPC (Flexible Printed Circuits) substrate by reflowing (at 260°C) to extract the wires after applying and curing the wire protection resin, we found the prototype samples, which were made using the epoxy-based resin, caused wire disconnection. The wire disconnection was caused by a large shearing force applied to the wire, which was generated by the expansion and shrinkage of the epoxy-based resin with a high elastic modulus due to temperature changes. On the other hand, in the samples which were made using the silicon-based resin as the wire protection resin, no wire disconnection was observed even after conducting a thermal shock test (the sample was subjected to temperatures of −20°C and 60°C for 60 minutes as one cycle, and the cycle was repeated five times) and a solder heat resistance temperature cycle test (the peak temperature of 260°C was repeated three times), as well as a pressure test at a pressure higher than the actual design pressure (a pressure of 500 mmHg was applied ten times). As a result, it was shown that the siliconbased wire protection resin we chose caused no reduction in productivity even in the case of a deterioration in mounting yield due to wire disconnection, etc., and also had sufficient strength to protect the wires even under actual usage conditions.
4. Evaluation of the properties of the sensor module
In this paper, an item, which is made by mounting a sensor chip on a bathtub-shaped ceramic substrate and applying a surface protection resin to it so that it can directly contact the human body, is called a “sensor module.” The property evaluations on the sensor module developed can be broadly divided into the following two types:
A) Pressure-temperature property
B) Pressure pulse wave measurement characteristic
The pressure-temperature property is evaluated by applying pressure to the sensor module surface (on the surface protection resin side) while changing the temperature conditions. The pressure pulse wave measurement characteristic is evaluated by actually pressing a sensor module to a human body to check whether the intra-arterial pressure, i.e., blood pressure waveform, can be measured. However, we developed a phantom which can simulate transdermal blood pressure measurement on a human wrist and conducted evaluation using it.
4.1 Evaluation of pressure-temperature property
Fig. 8 shows the representative values of offset and sensor sensitivity property when the pressure is applied at a temperature of 5, 15, 25, 35 and 45°C. Offset means the sensor output when open to the atmosphere, and sensor sensitivity is calculated using the sensor output when a pressure of 300 mmHg is applied, both of which are the input conversion values of the sensor chip. In addition, Figure 9 shows the results of converting the results shown in Fig. 8 into the temperature coefficient of offset (TCO) and the temperature coefficient of sensor sensitivity (TCS). We calculated TCOs and TCSs at temperature ranges of 5–15°C, 15–25°C, 25–35°C and 35–45°C so that the difference in properties of the respective temperature ranges can be determined. The horizontal axes in Fig. 8 and 9 represent the number of pressure sensor elements.
The design specifications of the offset and sensor sensitivity of the sensor chip are typ. −2.5 mV/V (−7.5–2.5 mV/V) and typ. 31 μV/mmHg/V (23.2–38.8 μV/mmHg/V), respectively. The results in Fig. 8 show that all pressure sensor elements are within the range of specifications. In addition, we can also find that the properties of both offset and sensor sensitivity did not change significantly depending on the temperature.
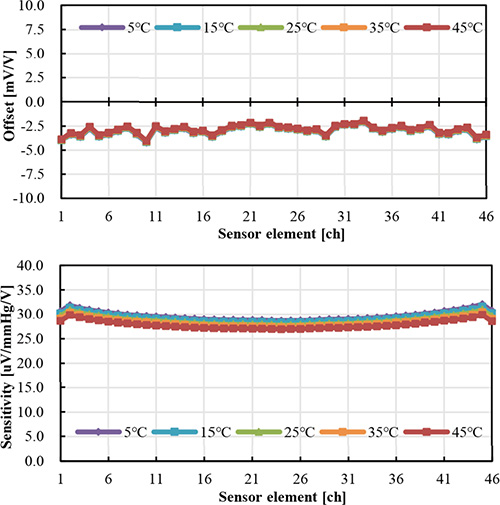
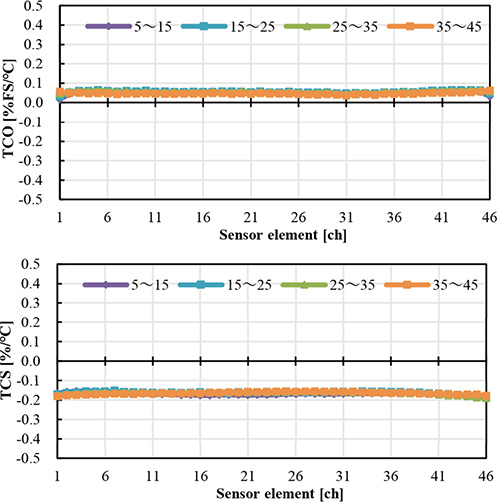
On the other hand, in the case of offset and sensor sensitivity in Fig. 8, it seems the properties are changing gradually from the pressure sensor element in the center to the one at either end. However, this is not because of the influence of the surrounding resin, but rather because of the property dependent on the shape of the diaphragm of the sensor chip. And the same tendency is observed in the property evaluation on the sensor chip alone before being mounted. Thus, this is not deterioration of the property due to mounting. Furthermore, in Fig. 9, the TCO and TCS are approximately 0.05 %FS/°C and 0.2 %/°C, respectively. This means that the influence of temperature on offset and sensor sensitivity is a property with a small temperature coefficient as well as uniformity, for the respective pressure sensor elements or the respective temperatures ranging from the low temperature side to the high temperature side. In addition, the design specifications for the TCO and TCS of the sensor chip are typ. 0.036 %FS/°C (−0.034–0.107 %FS/°C) and typ. −0.203 %/°C (−0.353–−0.107 %/°C), respectively, showing that they are within the range of design specifications. If they are influenced by deterioration in properties due to mounting, the influence of the wire protection resin, which has the highest elastic modulus among the resins used for packaging, must appear as a thermal property. In addition, although the influence of the wire protection resin must be significant in the pressure sensor elements at both ends because it is only applied to both ends of the sensor chip, such tendency is not observed in the results shown in Fig. 9. Therefore, it was shown that the new package structure and assembly method, which we proposed based on the results of stress distribution simulation, enabled the application of a wide variety of resins around the sensor while keeping the properties of all 46 pressure sensor elements in good condition.
4.2 Evaluation using a wrist phantom
Although we applied pressure and temperature to the sensor module to evaluate its properties as a general pressure sensor in Section 4.1, the conditions were different from those where the sensor module is directly pressed against a human body, because the pressure was applied by the air and was static. Therefore, we not only conducted the evaluation of properties as a general pressure sensor, but also developed a wrist phantom, which is close to actual conditions and has superior reproducibility, to conduct evaluation. Fig. 10 shows the sensor evaluation system based on the wrist phantom we developed. The wrist phantom is composed of a tube simulating the radial artery, a rubber sheet simulating the skin, and a rubber sheet simulating the tissue, as shown in Fig. 10 (a). The composing elements were selected in advance with the material parameters which can simulate a living body in a mechanical manner. The simulated blood vessel is filled with water, and the pressure simulating the arterial pulse of human body is applied from outside as shown in Fig. 10 (b).
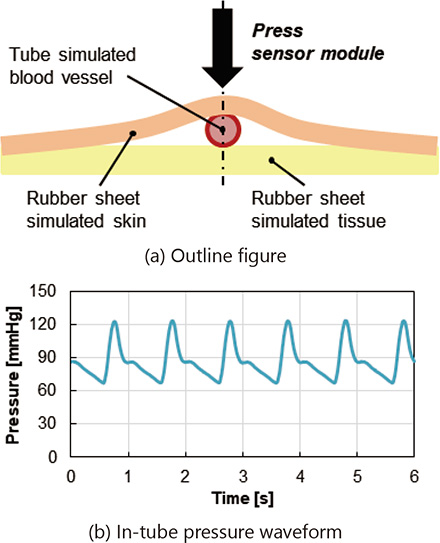
Pressing the sensor module we developed against this phantom enables the simulation of the condition where the sensor module is pressed against the skin above the radial artery of a human wrist. In addition, unlike the case of a human body, the pressure in the simulated blood vessel continues to pulse with a steady rhythm with no fluctuation. Since it enables highly reproducible evaluation, as well as easy measurement of inner pressure waveform, the waveform measured with the sensor module we developed and the inner pressure waveform can be easily compared.
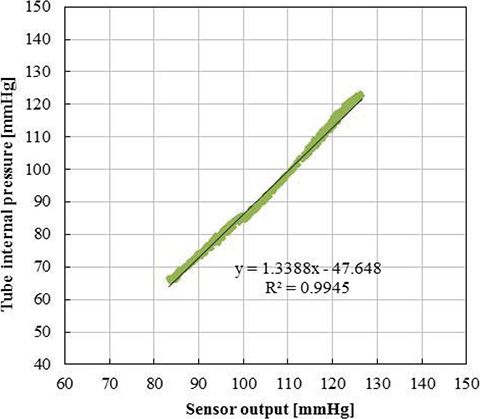
As an evaluation, we pressed the sensor module against the wrist phantom at a given pressure. Fig. 11 shows the relationship between the output of the pressure sensor element which is placed directly above the simulated blood vessel and the pressure in the simulated vessel in this case. Fig. 11 showed that the waveform which was measured with the sensor module we developed correlated with the pressure waveform in the simulated blood vessel, with a high determination coefficient in the optimum pressing condition determined according to the tonometry method. This means that the sensor chip and sensor module we developed have superior static pressure-temperature properties as a pressure sensor and also can reproduce the blood pressure waveform in the artery with high accuracy, in applications where the sensor module is pressed directly against the human body to measure the pressure pulse wave through the skin.
5. Application to continuous blood pressure measurement
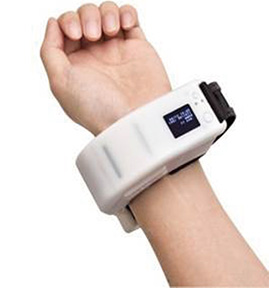
On April 18, 2016, OMRON HEALTHCARE Co., Ltd. put out a press release stating that it had developed a technology for measuring beat-by-beat blood pressure continuously only on a wrist 5). The device shown in Fig. 12 is a prototype continuous sphygmomanometer which was developed based on this technology. And this technology is equipped with a preproduction sample of the sensor module we have described in this paper. A clinical study to continuously measure beat-bybeat blood pressure waveform during sleep has been initiated, and is contributing to the development of entirely new indicators which could not be measured before. For example, as a result of pressing the sensor module we developed against the skin during nocturnal sleep to measure beat-by-beat blood pressure continuously, it was found that the arrest of breathing due to sleep apnea syndrome caused sudden blood pressure elevation 9). As mentioned in the Introduction, a continuous sphygmomanometer called “JENTOW” 6) was developed and a study on non-invasive continuous blood pressure measurement was conducted in the past. However, there were issues such as the limited measurement environment due to the large instrument size and the deterioration in mounting yield in the production process attributable to the fabrication of the sensor module. The shrinking of the circuit in the subsequent stage, which was achieved by incorporating the peripheral circuit into the sensor chip through the equipping of ASIC, as well as the reduction of circuit size, which was achieved by the elimination of the need for countermeasures in the subsequent stage through the improvement of noise resistance, contributed to the downsizing of the continuous sphygmomanometer as one of the factors of the evolution of the device. Furthermore, because the mounting cost is high in the packaging of semiconductor sensors, if the mounting yield deteriorates, the cost will rise, which can be a barrier to the mass marketing of the device. In this context, it is considered that the drastic improvement of the sensor module properties and mounting yield contributes to a reduction in the cost of a newly developed device and also leads to the diffusion of the device and the acceleration of clinical study.
6. Conclusion
In continuous blood pressure measurement utilizing the tonometry method, a special sensor, in which the pressure sensors are arranged in an array, is required. Conventional multi-element MEMS pressure sensors had issues such as deterioration in mounting yield due to many electrodes for extracting signals as well as high difficulty in the subsequent stage, large subsequent circuit size due to poor noise resistance, and etc. To address these issues, we developed a new multi-element MEMS pressure sensor equipped with ASIC, achieving the drastic improvement of the above issues. In addition, although the application of materials, which generate stress and deteriorate the properties such as resin, is generally avoided as much as possible when mounting in the packaging of pressure sensors, it was required to actively apply a resin to the pressure sensor chip in continuous blood pressure measurement utilizing the tonometry method. As a result, deterioration in sensor properties and mounting yield due to application of resin was an issue. Therefore, we developed a new packaging structure which does not deteriorate the sensor properties even if a resin is applied, as well as its assembly method. As a new package structure, we proposed mounting the sensor chip on a bathtub-shaped ceramic substrate with a cavity, rather than on a flat substrate. For the optimization of the new package structure, we took advantage of the stress distribution simulation to derive the optimum structure which requires short time and low cost. As a result of making a sample based on the structure which we derived through the stress distribution simulation and selecting the wire protection resin, as well as other resins which were not described in detail in this paper, we succeeded in maintaining superior pressure-temperature properties of all 46 pressure sensor elements in the sensor module which was mounted as a package. Furthermore, we also developed a wrist phantom so as to not only evaluate static properties as a pressure sensor, but also to conduct evaluation by pressing the sensor directly against the skin, which is a condition specific to continuous blood pressure measurement utilizing the tonometry method. Unlike the human body, which changes constantly, we could conduct evaluation of a sensor module under a highly reproducible environment, by constructing a phantom which is equivalent to pressing the pressure sensor against the skin above the radial artery in the wrist. As a result, we could confirm that the sensor module we developed showed superior properties in applications where blood pressure waveforms are measured based on the tonometry method. Currently, we are promoting the development of an assembly method toward mass production so that we can produce the sensor module we developed stably, and are planning to promote the development and evaluation continuously together with the device. By incorporating the sensor module we developed as a core of continuous sphygmomanometer, we will continuously take on challenges toward “Zero onset of cerebral vascular and cardiovascular diseases,” which is OMRON HEALTHCARE’s new mission.
References
- 1)
- H. Kubota. “History of blood pressure”, The Japanese journal of medical instrumentation, Vol.80, No.6, p.615-621, 2010.
- 2)
- O. Shirasaki. “ Roles and advancements of blood pressure monitors in cardiovascular medicine”, The Japanese Journal of Medical Instrumentation, Vol.80, No.6, p.622-631, 2010.
- 3)
- J. Imai, T. Okubo, M. Kikuya, J. Hashimoto. “Katei Ketsuatsu No Rinsyou Ouyou (Clinical Application of Home Blood Pressure)”, The Journal of the Japanese Society of Internal Medicine, Vol.93, No.9, p.202-209, 2004.
- 4)
- E. Rapsomaniki, A. Timmis, J. George, M. Rodriguez, A. Shah, S. Denaxas, I. White, M. Cauleld, J. Deaneld, L. Smeeth, B. Williams, A. Hingorani, H. Hemingway. “Blood Pressure and Incidence of Twelve Cardiovascular Diseases: Lifetime Risks, Healthy Life-Years Lost, and Age-Specific Associations in 125 Million People”, Lancet, Vol.383, No.9932, p.1899-1911, 2014.
- 5)
- Omron Healthcare Co., Ltd.. “Omron Healthcare develops the world’s first technology to enable continuous Beat By Beat® blood pressure monitoring with a wrist-attached device”, https://www.-healthcare.omron.co.jp/english/news/2016/0418.html. (Cited: February 19th, 2018,)
- 6)
- T. Sato, M. Nishinaga, A. Kawamoto, T. Ozawa, H. Takatsuji. “Accuracy of a continuous blood pressure monitor based on arterial tonometry”, Hypertension, Vol.21, No.6, p.866-874, 1993.
- 7)
- T. Azuma, S. Oka. “Mottomo Ippan Tekina Kekkanheki Chouryoku Riron (General Theory of Vascular Wall Tension)”, The Journal of Japanese College of Angiology, p.390-392, 1982.
- 8)
- R. Haruta. “Semiconductor Packages with Leadframe”. Journal of The Surface Finishing Society of Japan, Vol. 60, No. 4, p.225-231, 2009.
- 9)
- K. Kario. “Evidence and Perspectives on the 24-hour Management of Hypertension: Hemodynamic Biomarker -Initiated ‘Anticipation Medicine’ for Zero Cardiovascular Event”, Progress in Cardiovascular Diseases, Vol.59, No.3, p.262-281, 2016.
The names of products in the text may be trademarks of each company.