Corporate
|
Global
Corporate
|
Global
Consolidated Results
Net sales decreased; however, operating income increased, driven by the improvement in gross profit margin and the effects of the Structural Reform Program NEXT 2025. Net income attributable to OMRON shareholders increased, reflecting one-time expenses of JPY 22.0 billion incurred to optimize the number and capacity of our workforce, loss on impairment of goodwill of JPY 11.7 billion related to the Data Solution Business, and a JPY 12.3 billion in gain on valuation of investment securities.
* Unit: Billions of yen
* Figures in parentheses represent changes from the previous fiscal year

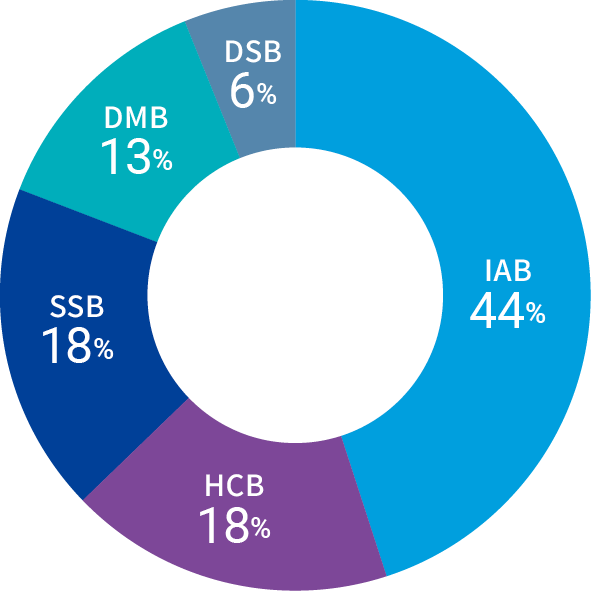
(Billions of yen)
Net Sales
360.8 (-8.3%)
145.9 (-2.6%)
145.6 (+2.8%)
105.4 (-7.8%)
42.7 (−)
* Figures in parentheses represent changes from the previous fiscal year
* Percentage changes are not presented for the Data Solution Business (DSB), as JMDC Inc. became a consolidated subsidiary on October 16, 2023, and such changes do not provide valid ratios for comparative purposes.
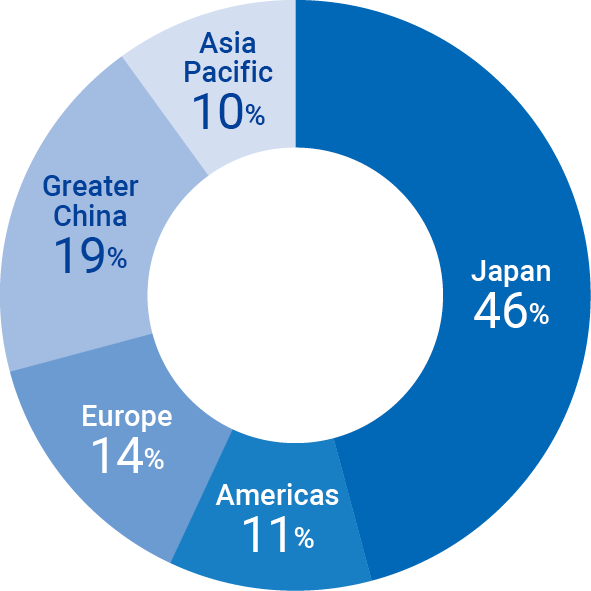
(Billions of yen)
Net Sales
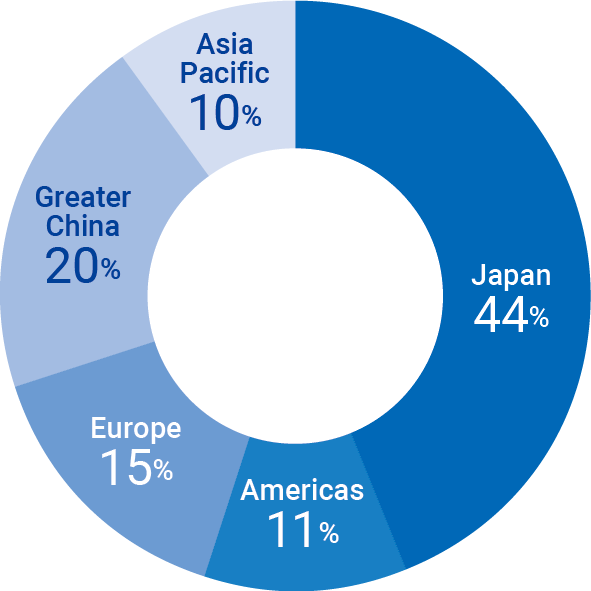
357.1(+1.7%)
84.7(-1.6%)
119.4(-7.4%)
160.0(-7.0%)
80.5(-0.2%)
* Figures in parentheses represent changes from the previous fiscal year
* Including direct exports to Japan
(Billions of yen)
FY2024
1,361.8
427.4
771.9
162.5
934.4
1,361.8
(Billions of yen)
FY2024
55.8
-47.9
7.9
-4.6
Under NEXT 2025, which runs from April 2024 through September 2025, we are steadily making progress in implementing five management measures.
To resume growth of the Industrial Automation Business, its current strategy and plan will be revamped from the perspectives of a customer-driven approach and effectiveness. Specifically, we will review resource allocation and accelerate the implementation of measures during the structural reform period to maximize the operating income margin of the Industrial Automation Business and establish a growth foundation to achieve the growth envisaged under SF2030.
Following completion of the analysis of the root causes of poor performance and the formulation of a structural reform plan, we established 10 task forces to complete the structural reform. Progress has been generally in line with the plan toward completion in September 2025.
We will strengthen the resilience of each business to changes in the business environment and optimize each portfolio of businesses, products, and areas to achieve sustainable profitable growth. At the same time, led by the Data Solution Business HQ, we will accelerate the creation of the data solution business in the industrial automation, healthcare, and social systems, solutions and service business domains by leveraging JMDC Inc.’s capabilities.
We completed the reassessment of all businesses and executed initiatives such as prioritizing investment in growth businesses and areas, pursuing profitability improvement in low-profit businesses, and considering the termination of such businesses. In addition, to generate synergies with JMDC Inc. across all business companies, we accelerated the study and implementation of co-creation in the Industrial Automation Business, the Healthcare Business, and the Social Systems, Solutions and Service Business.
In order to establish a workforce and labor cost structure that will enable us to expand customer value and achieve profitable growth, we will promote headcount and capacity optimization globally.
A total of 2,526 employees in Japan and overseas retired or agreed to retire, completing the optimization of workforce size. In addition, we implemented optimal placement of management personnel and measures to strengthen their capabilities.
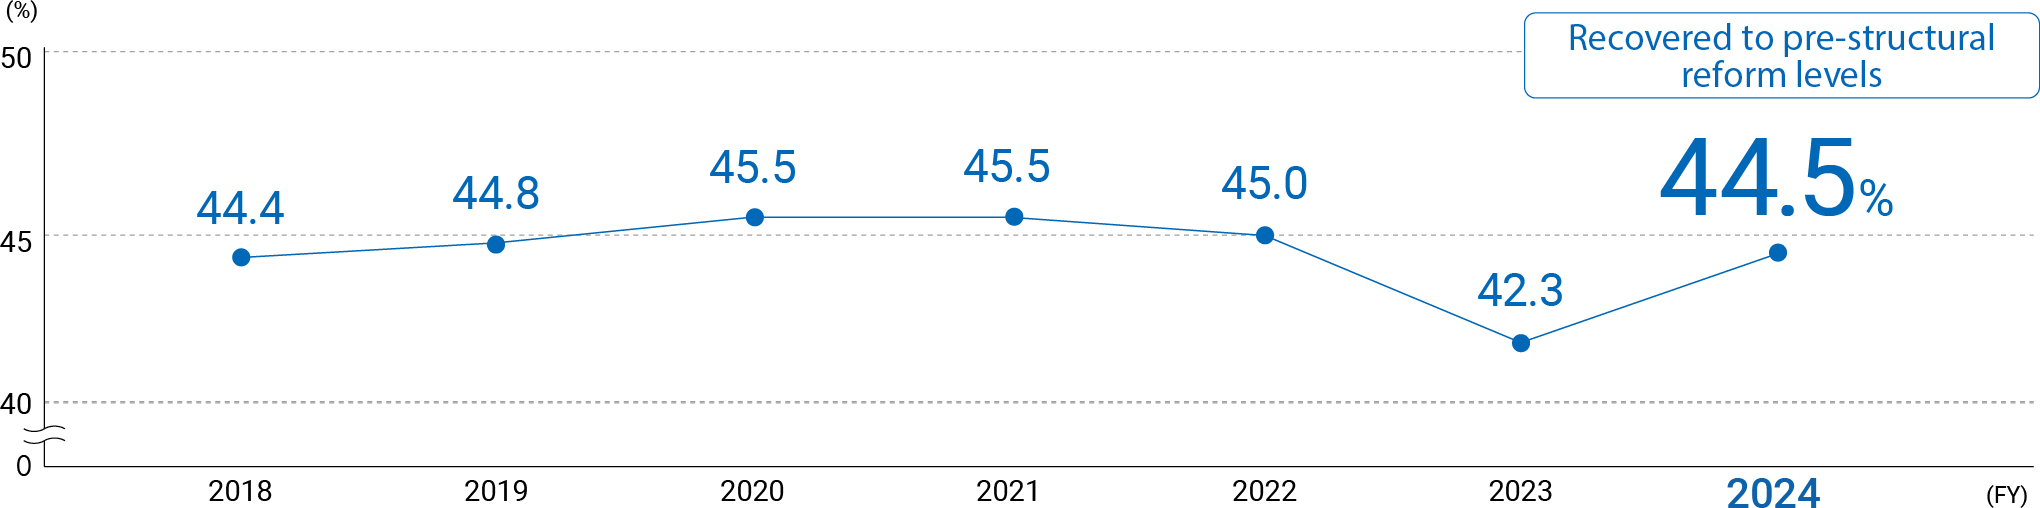
We will pursue maximization of fixed cost productivity throughout the Group. Specifically, by introducing and thoroughly implementing fixed cost discipline, we intend to achieve a ratio of selling, general and administrative expenses to net sales of less than 30% over the medium term (less than 28% when excluding the impact of inclusion of JMDC Inc. within the scope of consolidation; the actual result for fiscal 2023 was 32.0%).
As a result of thoroughly implementing fixed cost management based on the new fixed cost discipline, as well as promoting new initiatives to improve fixed cost productivity, such as consolidation of purchasing of indirect materials and consolidation of sites, we achieved a reduction in fixed costs of approximately JPY 26.0 billion in fiscal 2024.
The Company intends to introduce and execute measures to orient management, business, and headquarters management toward customer-driven thinking and behavior.
After setting the customer-driven approach as the companywide guideline, KPIs to embody customer-driven thinking and actions were set and introduced in all divisions. In addition, we developed and began implementing new human resource policies to enable management to embody customer-driven thinking and behavior.
* Unit: Billions of yen
Increase sustainability-related sales*3, an indicator of contributions to the resolution of the three social issues, by 45% vs. FY2021
+29%
(vs. FY2021)
Increase the ratio of women in managerial roles to 18% or higher (OMRON Group worldwide)
20.5%
Employ persons with disabilities at 28 overseas sites and maintain the ratio of employees with disabilities at 3% in Japan
Executed overseas monitoring; Japan: 3.5%
Reduce Scope 1 & 2 GHG emissions by 53% vs. FY2016
74% reduction (vs. FY2016)
Achieve Carbon Zero at all 76 sites in Japan
Achieved at all sites
Conduct human rights due diligence in line with the UNGP and build a human rights remedy mechanism into the value chain
Established a PDCA cycle framework for human rights due diligence and embedded its operation
Continue implementing sustainability initiatives steadily to maintain our listing in the Dow Jones Best-in-Class World Index*4
Selected for Dow Jones Best-in-Class World Index
100% participation by global managers in management training to effectively capitalize on the capabilities of diverse human resources
Japan: 91%
In all regions, introduce a training program covering the basic knowledge required for digital transformation: statistics, data analytics, AI, and others
Introduced in all areas
Make full use of digital tools to reduce use of paper
58% reduction
(vs. FY2019)
Top management of each region declares their commitment to their host community in accordance with the OMRON Sustainability Policy
Declared in each region and implemented
*1 Non-financial targets (8) to (10) were decided by employee vote.
*2 Figures presented for the non-financial targets are the initial SF 1st Stage targets set in fiscal 2022.
*3 Net sales of focus domains that lead to “achievement of carbon neutrality,” “realization of a digital society,” and “extension of healthy life expectancy.”
*4 Renamed from “Dow Jones Sustainability World Index (DJSI World)” on February 10, 2025
OMRON has been highly evaluated by ESG ratings organizations throughout the world , as evidenced by its inclusion in six ESG indices adopted by the Government Pension Investment Fund (GPIF) for ESG investment.

Rated “A -” for “Climate Change” and “B” for “Water Security” by CDP

Dow Jones Best-in-Class World Index Has been a component of the world-renowned Dow Jones Best-in-Class World Index for the eighth consecutive year since 2017 (also a component of the Dow Jones Best-in-Class Asia Pacific Index for 15 consecutive years since 2010)
Selected as a member in “S&P Global Sustainability Yearbook 2025” for the fifth consecutive year
FTSE4Good Index Series *5 Selected for the ninth consecutive year since 2016
Earned a Gold rating from EcoVadis SAS, placing it in the top 5% for sustainability performance
MSCI Selection Indexes *6 Selected for 10 consecutive years since 2015
*5 FTSE Russell (Registered trademark of FTSE International Limited and Frank Russell Company) hereby certifies that OMRON Corporation has qualified for inclusion in the FTSE Blossom Japan Sector Relative Index as a result of independent research. The FTSE Blossom Japan Sector Relative Index is widely used to create and evaluate sustainable investment funds and other financial products.
*6 Renamed from “MSCI ESG Leaders Indexes ” in February 2025.
THE INCLUSION OF OMRON CORPORATION IN ANY MSCI INDEX, AND THE USE OF MSCI LOGOS, TRADEMARKS, SERVICE MARKS OR INDEX NAMES HEREIN, DO NOT CONSTITUTE A SPONSORSHIP, ENDORSEMENT OR PROMOTION OF OMRON CORPORATION BY MSCI OR ANY OF ITS AFFILIATES.
Consolidated Results (Plan)
We plan to complete Structural Reform Program NEXT 2025 and achieve increased revenue and profit. In addition, taking into account the potential business impact of U.S. trade policy, we have incorporated into our plan a risk range of up to JPY 15.0 billion in net sales and up to JPY 9.0 billion in operating income for our main businesses.
* Unit: Billions of yen
* Figures in parentheses represent changes from the previous fiscal year
(Billions of yen)
Net Sales
371.0 (+2.8%)
150.0 (+2.8%)
152.0 (+4.4%)
110.0 (+4.3%)
50.5 (+18.2%)
* Figures in parentheses represent changes from the previous fiscal year
(Billions of yen)
Net Sales
382.5(+7.1%)
91.0(+7.4%)
119.5(+0.1%)
161.0(+0.6%)
81.0(+0.6%)
* Figures in parentheses represent changes from the previous fiscal year
* Including direct exports to Japan


