


Simulation Technology to Quantify Arc Interruption Phenomena
- High electrical durability relay
- Simulation technology to quantify arc interruption phenomena
- Analysis for electromagnetic and thermal phenomena
- Energy management device for environmental usage
- Improvement for arc interruption
In recent years, the growing interest in environmental problems has stimulated the urgent spread and efficiency improvement of renewable energy. Energy efficiency increases the rated voltage and the current of electrical devices, and the devices require higher interruption capability of relays. In order to achieve higher interruption capability, we have to understand the mechanism of arc discharge generated between electrical contacts at arc interruption and establish control methods for arc interruption.
In this study, we tried to construct arc plasma simulation technology based on the magneto-hydrodynamics model in order to measure arc behavior quantitatively and figure out the arc interruption mechanism in detail.
We replicated the arc behavior measurement by this CAE technique. Furthermore, we revealed the mechanism of the magnetic blowout arc interruption. We will contribute to the elucidation of arc plasma mechanism and control method of arc behavior.
1. Introduction
Against a backdrop of a growing awareness of the environmental issues of global warming and the soaring crude oil prices, markets are expanding for renewable energies and electric vehicles. In energy management equipment or battery control circuits used in such fields, DC relays (hereinafter referred to as “relays”) are used from the viewpoint of high insulation properties and low resistance.
When the contacts of a relay open, dielectric breakdown occurs between them, causing an arc discharge (hereinafter referred to as “arc”). An arc is a phenomenon in which an electric current flows through a gaseous medium, such as air, when the electrical conductivity of the gas increases 2) from gas molecular ionization and dissociation, which occur when the gas reaches a high temperature of several thousand degrees Celsius or more 1). During this time, the current induces Joule heating by which the temperature of the arc-conducting path is maintained so that the arc continues to exist. While the arc exists, a high-temperature condition occurs, causing damage to the inside of the enclosure of the relay or wear to the contacts. Such damage to equipment may result in a serious accident such as a fire. In recent years, interruptions at higher voltages of several hundred volts or larger currents of several hundred amperes have become a standard requirement. Safe and reliable arc interruption has now become more important than ever before.
The important technical challenge to interrupting a high-voltage or large direct current in a limited space is how to predict and control the arc behavior that occurs when two electrodes are separated from or brought into contact with each other. Included among factors that affect arc behavior are the temperature and pressure fields during arc discharge and the flow field generated mainly by a Lorentz force3) that occurs to the arc.
So far, electrical waveform measurements and high-speed cameras have been used to observe and understand arc behavior. Such methods of observation, however, do not reduce the difficulty in understanding temperature fields, pressure fields, and flow fields as factors that affect arc behavior. Then, in search of a possible solution to this problem, we turned our attention to computer-aided engineering (CAE)-based simulation technology. The use of CAE allows analysis of temperature fields, pressure fields, and flow fields and quantitative evaluation of their impacts on arc behavior. This leads to the understanding of the mechanism leading up to arc interruption and provides a highly useful tool for relay performance improvement.
Accordingly, this time, we addressed developing an arc simulation technology, which is a CAE-based combination of thermal fluid analysis and electromagnetic field analysis. The object of the simulation was the arc behavior that occurs during contact opening and closure. Our simulation technology was developed based on the standard functions of general-purpose thermal fluid analysis software.
The rest of this paper is organized to present the effort as follows:
Chapter 2 explains the assumptions and governing equations for describing arc behavior.
Chapter 3 describes the detailed settings of the analysis model and validates the arc simulation technology based on comparison with measured results.
Taking note of the experimental fact that the arc interruption time becomes shorter with an increase in magnetic flux density,
Chapter 4 discusses the relationship between magnetic flux density and arc duration based on the results of analysis under conditions with several different levels of magnetic flux density.
Chapter 5 presents the remaining challenges and prospects for our analysis model.
2. Arc simulation methodology
2.1 Working assumptions on arcs
The main assumptions for developing arc simulation technology are as follows:
- (1) Local thermodynamic equilibrium (LTE) holds at all points in the numerical space. To put this differently, all temperatures, such as electronic, gas, and excitation temperatures, can be equally expressed as the same kind of temperatures. All reactions, such as ionization and dissociation, are in equilibrium state4).
- (2) For flow fields, turbulent flows are taken into consideration (Transition SST model).
- (3) The electrodes do not melt or deform.
Let us explain here the local thermodynamic equilibrium model. While various dissociations, excitations, ionizations, and recombinations may be co-occurring in an arc, a high-pressure arc at 1 atm or higher pressure will be in a near thermal equilibrium state. Therefore, the electrons, neutral particles, and ions in the arc can be assumed equal in temperature to each other. The equilibrium state, however, may vary from one point in the arc to another. Hence, such a state is called local thermodynamic equilibrium5).
2.2 Governing equations
By assuming a local thermodynamic equilibrium, an arc can be treated as an electromagnetic thermal fluid. The behavior of the arc as an electromagnetic thermal fluid can be described using the laws of conservation of mass, momentum, and energy listed below6). The thermodynamic and transport properties of the gas can be treated as temperature-dependent physical property values in the equations.
| Law of conservation of mass | |
 |
(1) |
| Law of conservation of momentum | |
 |
(2) |
| Law of conservation of energy | |
 |
(3) |
| Law of conservation of electric charge | |
 |
(4) |
| Ohmʼs law | |
 |
(5) |
| Vector potential | |
 |
(6) |
| Magnetic field | |
 |
(7) |
| Electrical circuit equation (Kirchhoffʼs law) | |
 |
(8) |
where  is density [kg/m3],
  is velocity vector [m/s],
  is time [s],
  is pressure [Pa],
  is viscous stress tensor [Pa],
  is gravitational acceleration vector [m/s2],
  is electric current density vector [A/m2],
  is magnetic flux density vector [T],
  is enthalpy [J/kg],
  is thermal conductivity [J/m·K],
  is temperature [K],
  is electrical field vector [V/m],
  is radiation loss [W/m3)],
  is electrical conductivity [S/m],
  is electric potential [V],
  is vector potential,
  is vacuum magnetic permeability [H/m],
  is power supply voltage [V],
  is load resistance [Ω],
  is arc current [A], and
  is arc voltage [V].
Our analysis model assumes air as the gas to be filled into the space surrounding the electrodes (hereinafter “arc-quenching space”). The values for air mass density, viscosity, thermal conductivity, specific heat, electrical conductivity, and radiation loss were originally reported in, and are reproduced for use herein from Thermal Plasma7).
3. Validation of the analysis model
3.1 About the analysis model
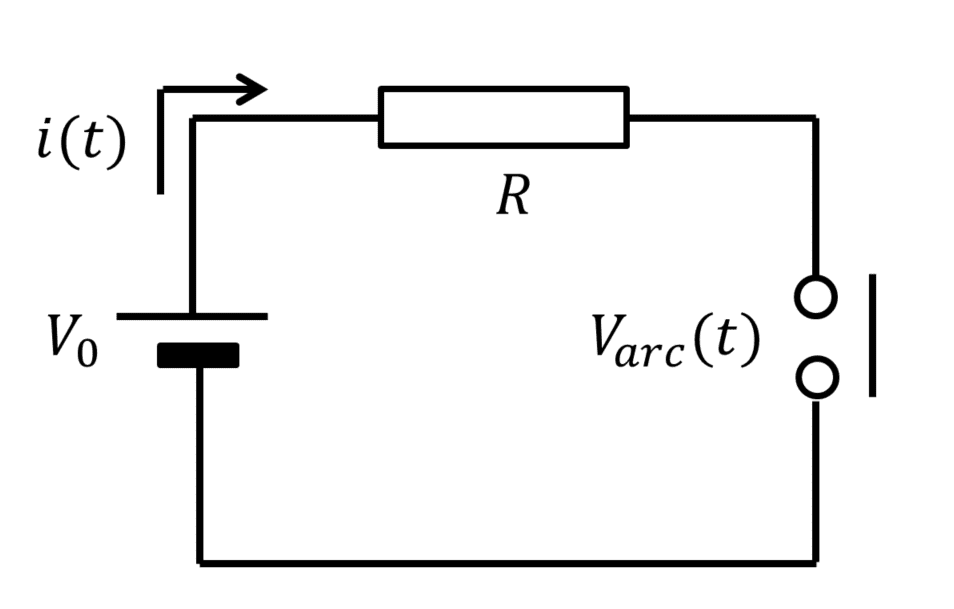
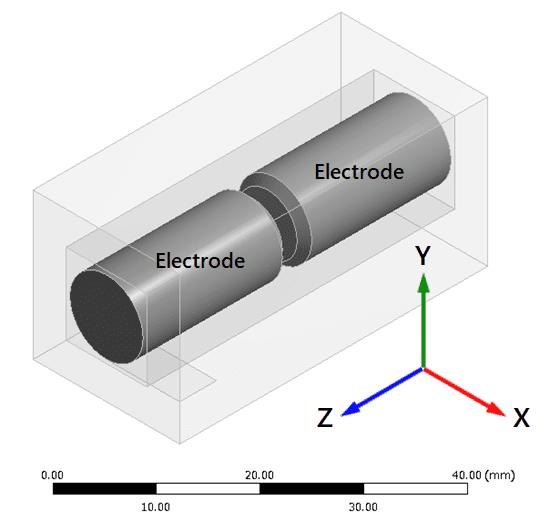
Our arc simulation technology assumes a DC arc. Fig. 1 shows the DC electrical circuit containing the contacts that provide the basis for creating the analysis model shown in Fig. 2. Table 1 shows the setting values used for the analysis model.
| Item | Setting value |
|---|---|
| Dimensions of the space | 42 mm×20 mm×20 mm |
| Electrode length | 20 mm |
| Electrode diameter | Φ5 mm |
| Contact-to-contact distance | 2 mm |
| Load condition | 200 V, 60 A |
| Magnetic flux density | Uniform magnetic flux in +Y direction |
The usual method of DC arc interruption is magnetic arc quenching in which a magnet is placed in the arc-quenching space to elongate and quench the arc by Lorentz force. Our analysis model follows suit and includes a uniform magnetic flux field in its arc-quenching space.
3.2 Reproduction of arc behavior
Fig. 3 shows what a typical arc looks like when magnetically quenched. In Fig. 3, the upper panel shows the sequence of CAE-generated temperature contour diagrams of the arc (temperature of 5,000 K or more), while the lower panel contains a series of photographic measurements of the actual shape of the arc taken with a high-speed camera. The results of the analysis of the change in the arc shape from arc generation between the contacts to the completion of arc interruption reproduce well the results of the experiment.
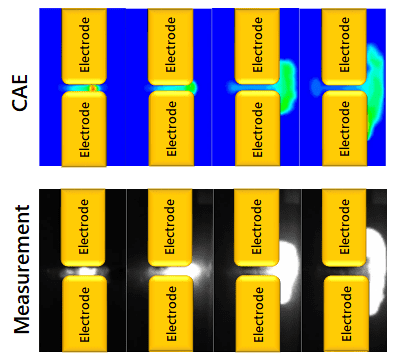
Fig. 4 shows the arc current and voltage waveforms during arc interruption. The analysis results reproduce well the experimental results, including the increase in arc voltage and the decrease in arc current. Based on the comparison of these results, we concluded that arc behavior was successfully reproduced.
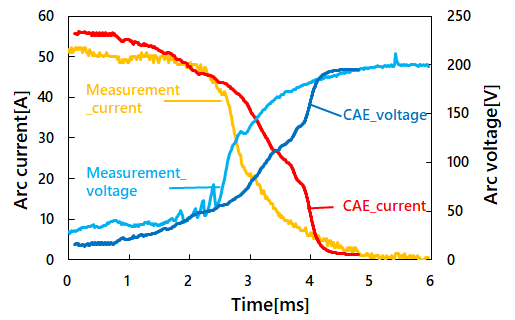
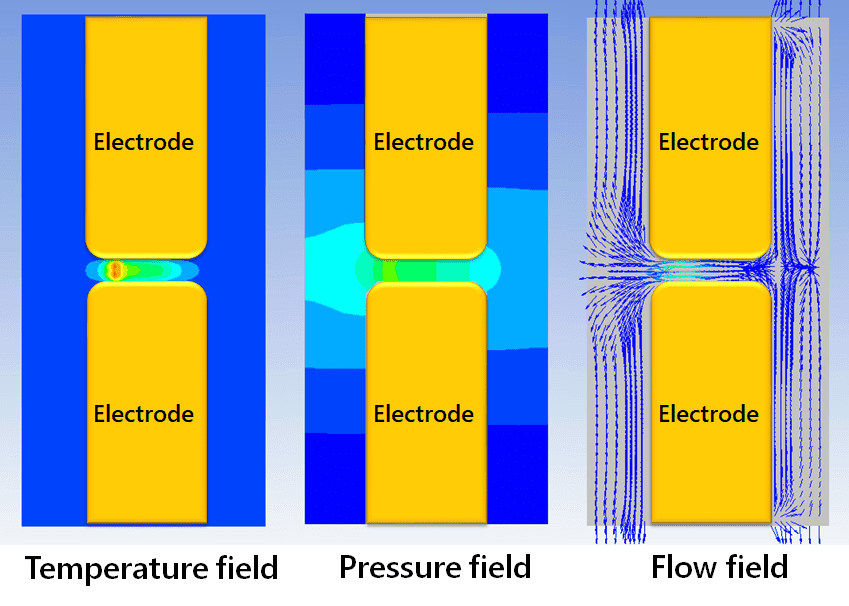
Fig. 5 shows the contour diagrams of the temperature, pressure, and flow fields. The arc simulation technology developed this time enables visualization of the three-dimensional behavior of arcs, their temperature, pressure, and flow fields, which have been known to be difficult to confirm by actual measurement.
4. Elucidation of the mechanism of magnetic arc quenching
4.1 Consideration on the improvement of interruption performance
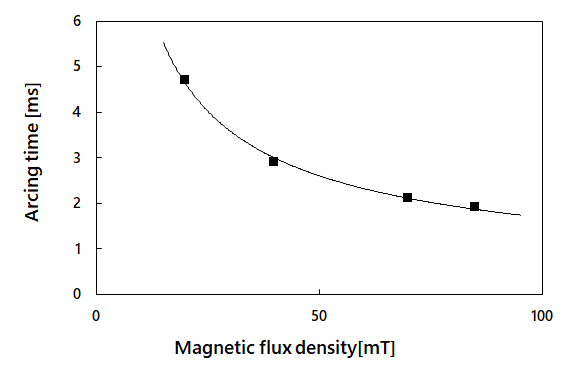
As explained above, magnetic arc quenching is the usual method of high-capacity or large-current DC arc interruption. It is known as an experimental fact that an arc can be interrupted at an early stage with an increased magnetic flux density. Hence, in this study, arc discharge analysis was performed at four levels of magnetic flux density (20 mT, 40 mT, 70 mT, and 85 mT) to grasp the relationship between the magnetic flux density and arc behavior.
4.2 Relationship between the arc duration and the arc shape
Fig. 6 shows the relationship between the magnetic flux density and the arc duration. The figure reveals that the arc duration decreases with the increase in magnetic flux density. Because no linearly decreasing relationship holds between the magnetic flux density and the arc duration, convergence to a certain value is expected. Therefore, the permanent magnet to be selected must have a certain level of magnetic flux density. It is, however, expected that the arc interruption time will converge to a certain value once a certain threshold is exceeded.
The arc simulation technology developed this time allows easy acquisition of three-dimensional data, which are supposedly difficult to collect by actual measurement. Then, we turned our attention to the arc shape, which has close relevance to arc interruption. The arc length and the arc thickness (hereinafter “arc diameter”) are in particular of significant relevance to the arc resistivity. Hence, the nature of their relationship must be clarified.
Fig. 7 shows the relationship between the magnetic flux density and the arc length. As regards the CAE simulation results, the arc length was calculated from the isosurface of the temperature field (5,000 K) immediately before arc interruption at each level of magnetic flux density. In the actual measurement, each image was examined to identify the center of the arc from a region with high light emission intensity. Then, based on the length of the centerline, the arc length was determined. Fig. 7 reveals that, in both the analysis and the actual measurement, the arc length tended to decrease with the increase in magnetic flux density.
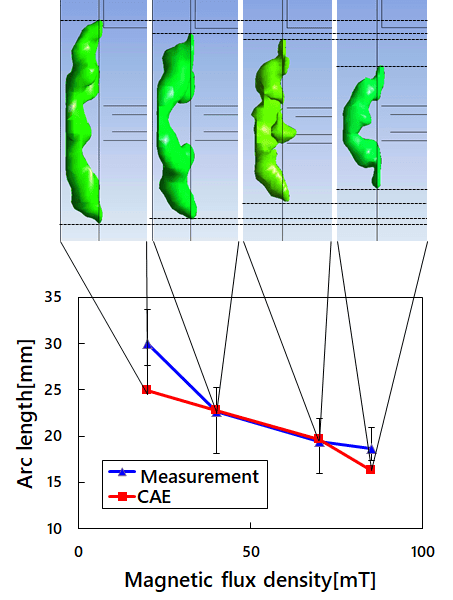
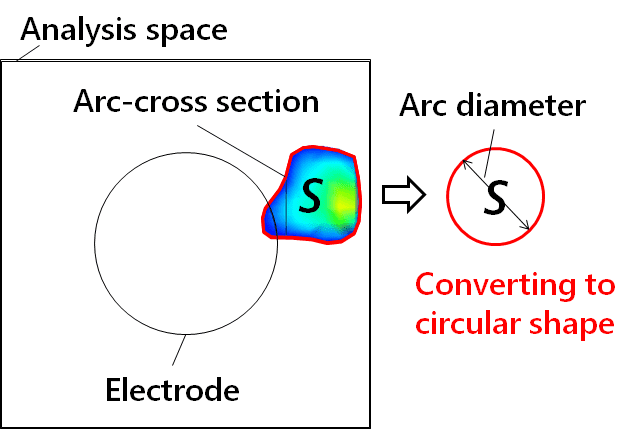
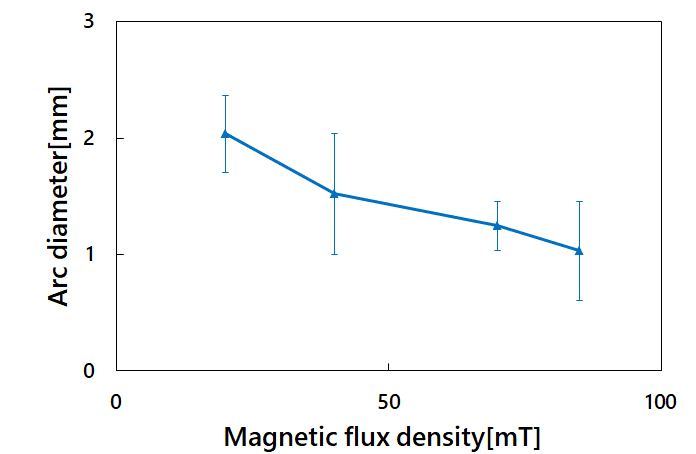
Fig. 8 shows the definition of an arc diameter. An arc diameter is defined as the diameter of a circular shape converted from the cross-sectional area of an arc (temperature of 5,000 K or more) cut in the vertical direction with respect to the center axis of the terminal. Fig. 9 shows the relationship between the magnetic flux density and the arc diameter. The arc diameter herein means one immediately before arc interruption at each level of magnetic flux density. Fig. 9 reveals that the arc diameter tends to decrease with the increase in magnetic flux density.
4.3 Discussions and elucidation of the mechanism
The section immediately above analytically showed that the arc length and the arc diameter decrease with the increase in magnetic flux density. It is generally known that for an arc to be interrupted, the arc resistance,  must be increased to increase the arc voltage up to power supply voltage 8). Conventionally, an arc length required for arc interruption has been estimated from the load current and voltage9)-10).When an arc is elongated, the arc resistance increases, resulting in eventual arc interruption.
In magnetic arc quenching, however, it is known from actual observations and analysis results that an arc length decreases with the increase in magnetic flux density. Hence, the arc interruption mechanism in magnetic arc quenching cannot be explained, relying exclusively on the load current, load voltage, and arc length. Then, using the arc diameter and temperature field data made available by the arc simulation technology developed this time, we reexamined the arc interruption mechanism in magnetic arc quenching.
The arc resistance, can be expressed by the following equation:
 |
(9) |
where ,  , and
, and  stands for electrical conductivity [S/m], arc length [m], and arc cross-sectional area [m2], respectively.
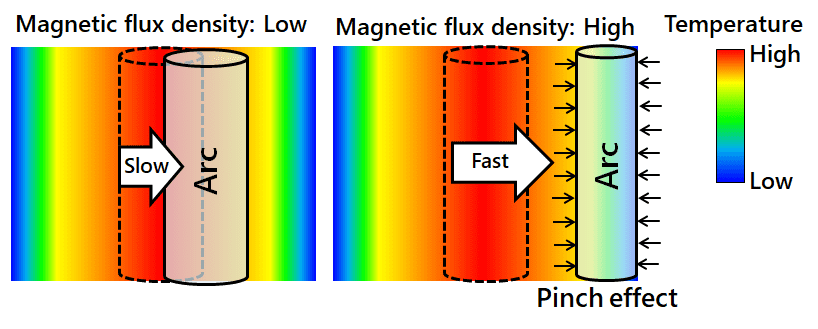
This equation suggests that an increase in Lorentz force with an increased magnetic flux density leads to a decreased arc diameter, i.e., a decrease in arc cross-sectional area, followed by an increase in arc resistance, whereby arc interruption at a short arc length is achieved. Fig. 10 schematically shows the mechanism of the effect of the magnetic flux density on the arc diameter. When the magnetic flux density increases, the Lorentz force acting on the arc increases, resulting in a higher arc traveling speed. Consequently, as shown in Fig. 10, the region around the arc is exposed to low-temperature air all the time. This helps to induce a thermal pinch effect11) that causes the arc diameter to shrink. The thermal pinch effect seems to have caused a decrease in arc cross-sectional area, followed by an increase in arc resistance, thereby resulting in rapid arc interruption.
In this study, the mechanism of magnetic arc quenching was quantitatively elucidated using the arc simulation technology developed this time.
5. Conclusions
We worked on the development of the arc simulation technology presented above, considering that quantitative evaluation of, for example, temperature fields, pressure fields, and flow fields, which had not been sufficiently grasped by the conventional evaluation method based on actual observation, would be useful in improving the performance of relays. Based on the results of actual measurement of arc behavior on two-dimensional cross-sections and on a comparison with current and voltage waveforms during arc interruption, we validated the arc simulation technology and completed its development.
This technology has enabled visualization of the three-dimensional behavior of arcs, their temperature fields, and pressure fields. This study investigated the mechanism in which the arc interruption time decreases with the increase in magnetic flux density. When a Lorentz force on an arc increases, the arc traveling speed increases, thereby cooling the region around the arc. We concluded that the resulting decrease in arc cross-sectional area led to an increase in arc resistance, thereby resulting in a reduced arc interruption time.
This paper examined the mechanism of arc interruption with its focus on the three-dimensional arc shape data and arc temperature fields. In the future, we will also investigate the effects of pressure and flow fields on arc behavior and establish a control method effective to improve arc interruption performance. Through this effort, we will develop a relay able to interrupt high-voltage or large-current arcs safely and reliably in order to contribute to the realization of a renewable energybased society.
References
- 1)
- Y. Aoyama et al., “Spectroscopic analysis for the arc quenching effect of ablation gas on arc immobility phenomena,” in Proc. Thirty-Sixth IEEE Conference on Electrical Contacts, and the Fifteenth International Conference on Electrical Contacts, Aug. 1990.
- 2)
- Y. Cressault et al., “Influence of metallic vapours on the properties of air thermal plasmas,” Plasma Sources Science and Technology, Vol. 17, pp. 1-9, 2008.
- 3)
- M. Haruki et al., “Effect of Magnetic Blowout and Air Flow on Break Arcs Occurring between Silver Electrical Contacts with Copper Runners,” in Proc. IEICE Trans Electron, Sept. 2017, Vol. E100-C, No. 9.
- 4)
- W. Takayuki and T. Shinichi, “Electromagnetic Thermal Fluid Model of Thermal Plasmas” (in Japanese), J. Plasma Fusion Res, Vol. 87, No. 8, pp. 514-521, 2011.
- 5)
- IEEJ Publication Committee for Electrical Discharge Handbook, Electrical Discharge Handbook (in Japanese), Institute of Electrical Engineers of Japan, p. 1945, 2003.
- 6)
- T. Shinichi, T. Manabu, N. Kazuhiro, K. Fusaki, S. Keiichi, and Y. Kei, “Numerical Simulation of Energy Balance in Argon-Helium Mixed Gas Tungsten Arc” (in Japanese), Journal of High Temperature Society, Vol. 32, No. 1, pp. 69-73, 2006.
- 7)
- M.I. Boulos, P. Fauchais, and E. Pfender, Thermal Plasma Fundamentals and Applications. Vol. 1, Plenum Press, 452p., 1994.
- 8)
- M. Yusuke, E. Hideki, Y. Ritsu, F. Yoshihisa, O. Ryosuke, and I. Yoji, “Miniaturization Technology of Main Relay for High Current of EV and HEV,” (in Japanese), Panasonic Technical Journal, Vol. 61, No. 1, pp. 72-76, 2015.
- 9)
- H. Ayrton, The Electric Arc. New York: D. Van Nostrand, p. 528, 1902.
- 10)
- S. Mitsunori, Electric Contacts - Materials and Characteristics (in Japanese). Nikkan Kogyo Shimbun, p. 191, 1984. ISBN- 10:4526017299.
- 11)
- T. Manabu and T. Shinichi, “A Study of Thermal Pinch Effect of Welding Arcs” (in Japanese), Quarterly Journal of the Japan Welding Society, Vol. 25, No. 2, pp. 336-342, 2007.
The names of products in the text may be trademarks of each company.