


Application of monitoring technology for social infrastructure (1)
- monitoring
- Power-saving, low power
- wireless
- acceleration
- strain
In 2022, over 40% of bridges with a bridge length of 2 m or more have reached an aging era exceeding 50 years after completion of bridges in Japan. In addition, engineers of the baby-boomer generation retire and the technical shortage to maintain and manage domestic bridges is getting serious. The Ministry of Land, Infrastructure and Transportation positions 2013 as the first year of maintenance, and implements many measures, and is also focusing on utilizing the latest technology. Among them, the monitoring system with sensor technology has been drawing attention as a technology for monitoring the damage of the bridge which can be substituted for the civil engineer.
Since 2013, in order to make use of OMRON’s sensor technology in the civil engineering field, we have been developing a monitoring system for bridges with civil engineering knowledge of Tokyo Institute of Technology through academic-industry collaboration. In this paper, we introduce the results of the system development for applying to the site environment where the bridge is placed and efficiently collecting necessary sensor data.
1. Introduction
Since the Sasago Tunnel collapse in December 2012, road structure inspection services have been more important than ever before. In addition, Japan will enter the era of aged road structures by 2022. This is particularly the case with bridges. In 2022, 40 percent or more of bridges with a length of 2 meters or more will exceed 50 years of age after completion1). Therefore, the Ministry of Land, Infrastructure and Transport has set 2013 as Year One of Social Capital Maintenance1) and has established the Guidelines for Periodic Bridge Inspections2) and the Guidelines for Periodic Road-Bridge Inspections3) as measures for road bridge inspections. These Guidelines clearly provide for these inspections to be implemented every five years, including proximity visual inspections and, if necessary, tactile and hammering inspections. As understanding has deepened of the status of deterioration of bridges through the application of these Inspection Guidelines and measures coordinated with the Life Extension Repair Plan, bridge maintenance projects, including repairs and reinforcements, have been steadily executed.
Against this background, we established a joint research chair with the Tokyo Institute of Technology in June 2013 in order to apply sensor technology to bridge maintenance, and since then have been working on the development of a system applicable to maintenance as an attempt to amalgamate data analysis technology developed by the Tokyo Institute of Technology based on structural engineering, earthquake engineering, and maintenance engineering with OMRON Groupʼs proprietary sensing technology and wireless network technology4).
This paper presents the technical means devised to enhance field applicability of a monitoring system designed to ensure safety between periodic inspections, validate the continuous performance of structures, and detect sudden earthquake- or typhoon-induced damage. The results of a demonstration test are also presented.
2. Challenges to the bridge monitoring system
Bridge monitoring is usually required at sites located in mountainous areas, remote areas, and other environments inconveniently located for access by people. Even in cities, bridge monitoring sites are often found in places difficult to reach, such as elevated bridges or overpasses. Most of these sites are inconveniently located to secure power supplies and provide frequent maintenance. Moreover, cable installation may disrupt bridge inspections or construction work, such as repairs, and hence should be avoided as much as possible. Conventionally available measurement techniques are either on-site measurements with analog sensors wired to measuring devices (data loggers) or remote data monitoring based on the internet function of measuring devices. These methods require on-site power supplies and installation of sensor cables and associated equipment, thereby leading to poor adaptability to the site environment and difficulties in long-term installation. As a result, only short-term measurements can be performed, resulting in failure to achieve safety assurance between inspections or to support both continuous and sudden damage detection. Thus, the major challenges to a bridge monitoring system are power supply availability and cable-free, long-term operation. The system required is one that can overcome these challenges.
3. Monitoring system envisioned by OMRON
3.1 Concept of monitoring
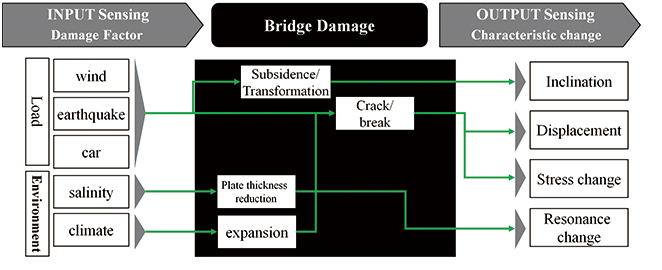
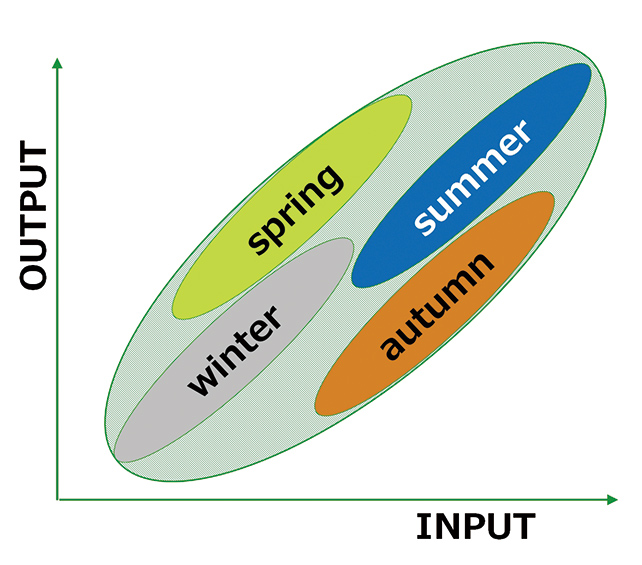
Responses (outputs) to damage factors (inputs) acting on a bridge from outside may vary depending on the state of damage to the bridge. We expect that correlative analyses of inputs and outputs measured by sensors will allow us to grasp the state of damage to a bridge5),6) (Fig. 1). The inputs to be measured include loads acting on the bridge from outside (such as winds, earthquakes, or vehicular traffic), as well as airborne salt and temperature and humidity acting on it from the surrounding environment, while the outputs to be measured are inclination, displacement, displacement, stress change, resonance point change, and other factors. These measured values may vary depending on the environmental conditions, such as insolation or live load, or the measuring method. Variations thus resulting are expected to become key elements in the evaluation of measurement results. Fig. 2 shows the conceptual image of correlation characteristics, including variations. It is thought that the correlation values vary between seasons or between day and night and change even within a distribution.
We assume that the basis of this monitoring can only be provided by a grasp of characteristics, including variations, during continuous measurement.
3.2 System configuration
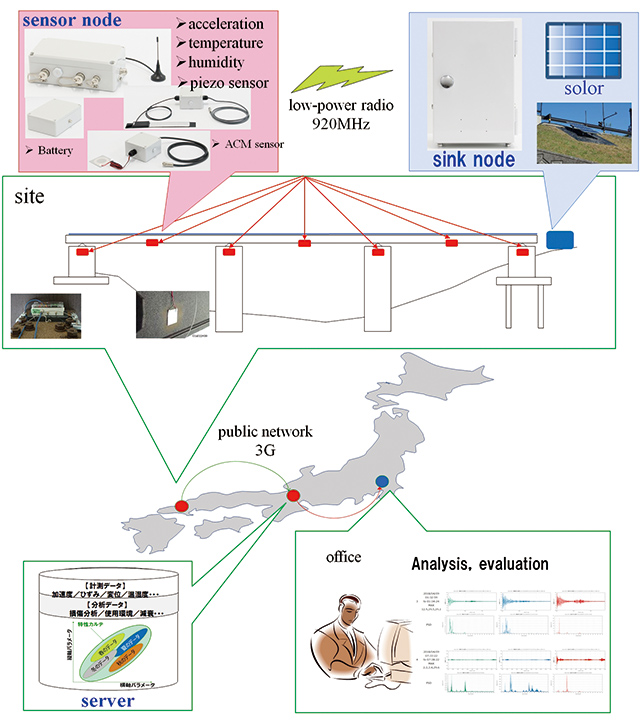
Fig. 3 shows the configuration diagram of the implemented system. The rest of this section presents the major advantages of the measurement system for on-site application.
1) Power-saving and assured reliability in outdoor environments
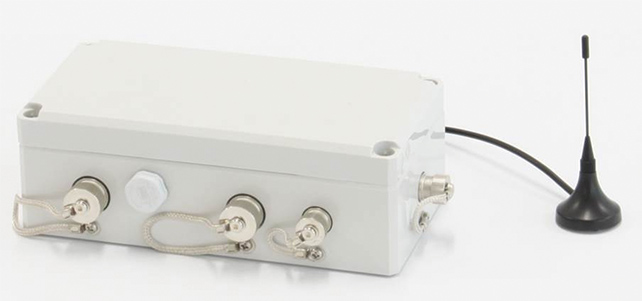
Sensors with power consumption as low as possible have been adopted and equipped with a periodic measurement function used two to three times per day, thereby serving as powersaving measuring devices. The measuring devices (hereinafter “sensor nodes”) connectable to a multiple number of sensors and equipped with a wireless communications function run on a battery for five or more years, meet the requirements for both protective structure (IP65) and condensation prevention, and support long-term outdoor operation. Fig. 4 shows the external appearance of a sensor node.
2) Easy-to-install wireless remote monitoring
The sensor nodes in the bridge under measurement support a 920 MHz proprietary wireless protocol for data transmission. Transmitted data are collected at base stations (hereinafter “sink nodes”) and forwarded via a public line (3G/LTE) to a server for storage at a remote site. The administrator monitors and browses measurement data from different sites over the Internet.
Thanks to such wireless communication, cabling work is no longer necessary. As a result, the system installation work can now be completed in approximately five days, instead of approximately one month required for the conventional system.
3) Trigger measurement function
Each sensor node is equipped with a Earthquake measurement function triggered by preliminary earthquake tremors in addition to a periodic measurement function triggered by time. Moreover, when a typhoon or the like is expected to come, measures are implemented, such as collection of an appropriate amount of data at a short cycle, to allow efficient monitoring even during an emergency.
4) Support of various types of degradation-induced damage
The sensor nodes are configured to allow external connection of the sensors, such as strain sensors and atmospheric corrosion monitor (ACM) type corrosion sensors, in addition to acceleration and temperature-humidity sensors so that necessary measurements can be performed to suit the site environment. Additionally, GPS-based high-precision time sinkhronization is used to reduce the time error between sensor nodes to within 5 ms or less so that the data necessary for frame analysis, such as vibration modal analyses, can be obtained by multi-site measurements.
4. Elementary technologies for the monitoring system
In the monitoring of the social infrastructure, acceleration data are useful in displacement analyses, structural identification, structural parameter analyses, and other measurements, while strain data are useful in live load measurements and in local condition evaluations of neutral axes, girder strains, and other factors5),6). To achieve the accuracy required to evaluate the degradation-induced damage to a bridge, acceleration and strain sensor data sampling must be performed at 200 Hz so that the main measurement range will fall within the low-frequency area (up to approximately 50 Hz). To enable battery-powered operation of this system, we have adopted sensors that have power consumption as low as possible while retaining the required accuracy. In addition, the time synchronization for achieving synchronization between sensor nodes at a low system cost has also been implemented using our proprietary technique. The rest of this chapter outlines the acceleration sensors, strain sensors, and time synchronization technology used in the system.
4.1 Acceleration sensors
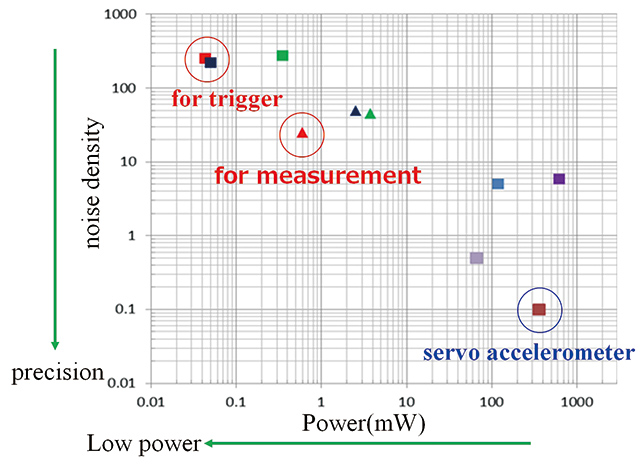
Acceleration sensors are important sensors that measure the vibration characteristics of the structures necessary for their characteristics evaluations. Conventionally, high-precision servo-type accelerometers, such as those found in seismometers, have been used. For application to monitoring, however, they have too high a power consumption and too high a price. For the purpose herein, we performed a comparative evaluation of the sensor nodes and a servo-type accelerometer in terms of characteristics and accuracy to adopt sensors that best serve their respective purposes.
1) Comparison of the characteristics of the acceleration sensors
Each sensor node is equipped with two acceleration sensors, one for the trigger and the other for the measurement. As shown in Fig. 5, the least-power-consuming one was adopted as the sensor for the trigger. Adopted as the sensor for the measurement was one that has power consumption as low as possible while retaining the accuracy sufficient to allow the grasp of behavior during maintenance. Accordingly, all sensors other than the low-power-consumption acceleration sensor for the trigger are usually kept in sleep mode to minimize the power consumption of the system as a whole.
2) Comparison of acceleration sensors in terms of activation method
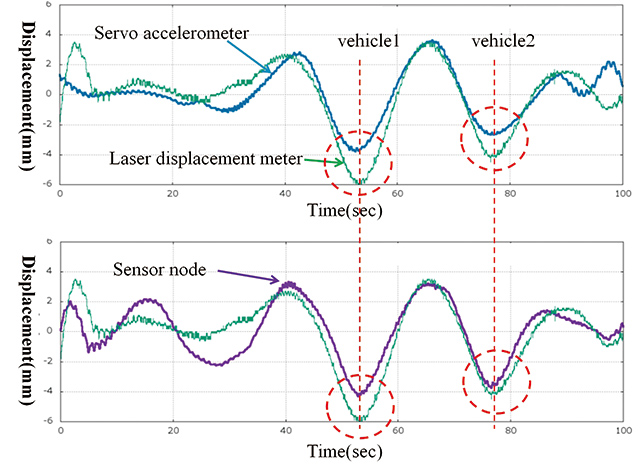
For an acceleration sensor to detect minute vibrations, the key element is its noise characteristics. In the case of displacement measurements in particular, errors in the low-frequency area have a significant influence. Fig. 6 shows the results of comparisons in terms of the displacement calculated by secondorder integration of the acceleration. Using as the true value the actual reading of a laser displacement gauge, the girder displacement was determined from the acceleration reading of the servo-type accelerometer and from that of the sensor node at the same point to compare the results. The conversion errors of the displacements due to Vehicle 1 and Vehicle 2 passing by are far smaller than the displacements due to them and are, therefore, found negligibly insignificant in the bridge characteristics evaluation: the servo-type accelerometer showed an amplitude ratio error of 0.81 and a correlation coefficient error of 0.83 while the sensor node showed an amplitude ratio error of 1.00 and a correlation coefficient error of 0.8.
4.2 Strain sensor
A strain sensor is used to measure the stress acting on a member around a damaged spot in order to grasp the local condition in a structure. Conventionally, strain measurements were taken using strain gauges made of metallic resistance materials, the resistance value of which varied proportionally to the change in strain. Strain gauges, however, have problems with durability and power consumption and, hence, cannot be used for our intended monitoring. Therefore, we have adopted a piezoelectric element-based, low-power-consumption piezoelectric-strain sensor (hereinafter “piezoelectric sensor”)7). Fig. 7 shows the external appearance of the piezoelectric sensor:
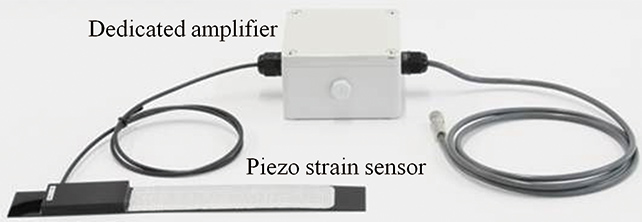
1) Advantages of the piezoelectric sensor
The piezoelectric sensor consists of a piezoelectric element (PVDF) producing electric charge in proportion to the strain and can be used for strain measurements almost without the need for a power supply. The electric charge output from the piezoelectric sensor is converted via a dedicated amplifier to voltage for measurement by the sensor node connected thereto. In the dedicated amplifier, optimization is performed by each circuit, thereby achieving an electric current consumption of 0.3 mA, which is 1/100 of the electric current consumption of 30 mA by a typical strain gauge.
This piezoelectric sensor is a dedicated dynamic strain sensor that measures the dynamic responses to the forces exerted on a bridge from the vibrations caused by vehicles passing nearby or earthquakes. It best serves, in terms of power consumption and durability, the long-term measurement needs required of our monitoring system.
2) Measurement accuracy of the piezoelectric sensor
The piezoelectric sensor is designed to convert the electric charge it produces to voltage via a charge amplifier. The amplifier circuit characteristically functions as a filter that causes attenuation on the lower and higher frequency sides as shown in Fig. 8. A girder strain measured at the bridge is a halfwavelength vibration forcibly caused by a passing vehicle. Therefore, the frequency of the signal that occurs as the sensor output voltage is determined from the span length and the traveling speed of the vehicle. Assuming that the span length is 50 m, the girder strain due to a vehicle passing by at a speed of 40 km/h will be 0.111 Hz. In the case of a vehicle traveling at 5 km/h, the value will be 0.014 Hz.
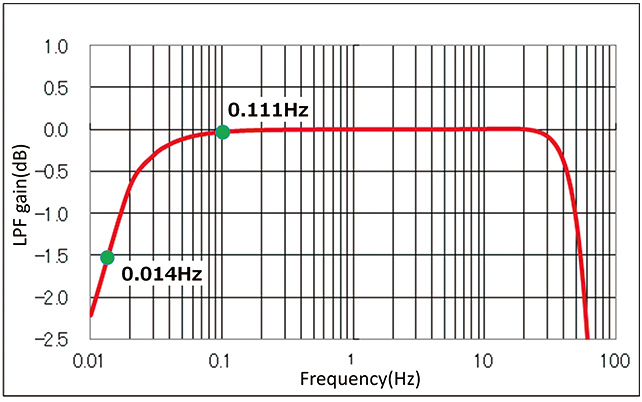
For vehicles traveling at normal speeds, the sensor can provide a sufficient level of accuracy for a characteristics evaluation. However, when low-speed travel occurs because of traffic congestion, the output is significantly attenuated. Therefore, taking into consideration the measurement location and the evaluation method, a special measure should be implemented. Avoidance of measurements near stop lines may be an option. It is also acceptable to estimate the speed from the times measured at several points, so that the estimated speed can replace the data from low-speed travel and can be excluded from the scope of the evaluation.
4.3 High-precision time synchronization technology
1) Time correction method
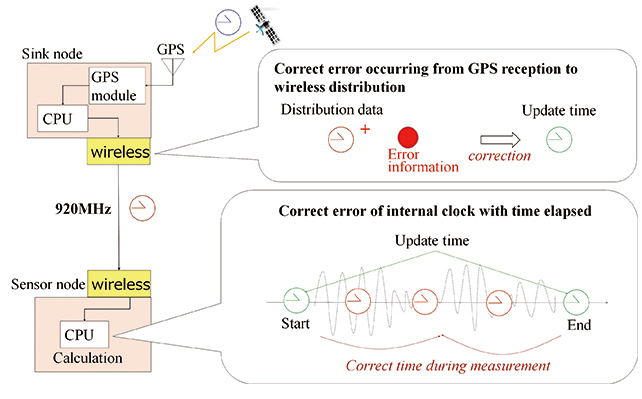
The most accurate time synchronization method for sensor nodes is to perform time synchronization of the sensor nodes when each is fitted with a GPS receiver on a one-by-one basis. The problem is, however, a high system cost that will occur if more than one sensor node needs to be installed at each site. This system includes in its configuration a GPS receiver that distributes the time via a sink node to each sensor node8). Fig. 9 shows the configuration diagram of the wireless time synchronization system:
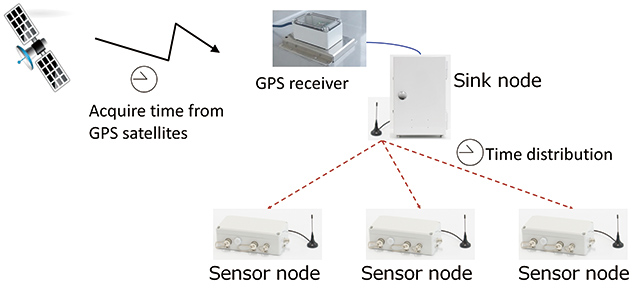
Fig. 10 outlines the flow of the time correction process. The delay component that occurs during the period between the reception of the time from the GPS and its transmission to the sync node is sent along with the time information to the sensor node in which the received time is corrected. In addition, there is also the issue of sampling period errors that may arise from errors in the internal clock of the sensor node. Each sampling time is accurately corrected from the measurement start and end times and the number of measurements. For all the sampling times during measurement, an accuracy error of 5 msec or less has been achieved.
2) Effect of high-precision time synchronization
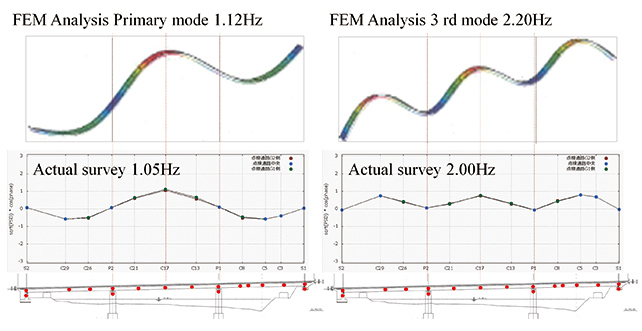
With sensor nodes at several points on a bridge, the behavior of each point can be visualized in relation to that of others, thereby allowing the grasp of how the bridge is shaking. Fig. 11 shows the FEM analysis results of the vibration mode shapes and the actual measurement results thereof. With the measuring points in sink with each other, mode shapes comparable with analytically obtained ones were successfully observed.
5. Implementation for assured long-term reliability
To enable long-term operation, power saving through optimization of the number of measurements and the measurement time is necessary, in addition to the utilization of power-saving sensors. Moreover, to enable long-term outdoor operation, the sensors must be dustproof, waterproof, and highly weatherproof without sacrificing performance. This chapter describes the means of implementation we devised for assured long-term reliability.
5.1 Power-saving power supply circuit
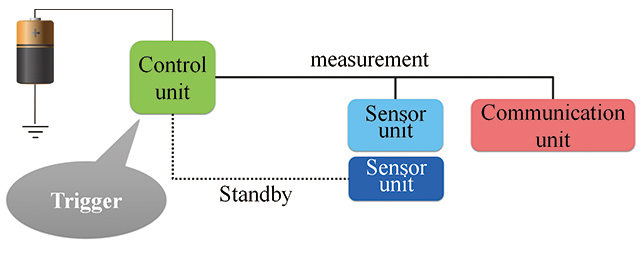
Each sensor node is equipped with its own power supply control circuit that switches the power supply route during standby mode, during measurement mode, and during communication mode to consume only the necessary power required. Fig. 12 shows the conceptual image. Normally, the sensor node circuit operates in standby mode (using the route indicated by the dotted line in the figure). At this point, only the super-power-saving acceleration sensor for the trigger is in operation with small current consumption. When the control unit receives a start-measurement trigger, a switchover to the route indicated by the solid line in the figure occurs to activate the acceleration sensor for measurement and the communication circuit. After a certain measurement time is over, the power supply route is switched back to the one for use during standby mode. This control has contributed to a significant reduction in power consumption during standby mode, thereby enabling five or more years of measurement in battery-powered operation. Table 1 shows the measurement results for electric current consumption before and after the implementation of this control. The table reveals that while electric current consumption during measurement mode and during communication mode has remained unchanged before and after implementation of the trigger control circuit, electric current consumption during standby mode has significantly improved. This is because the added trigger control circuit controls the electric current supply so that electric current will be supplied only to the super-powersaving sensor but not to the high-precision sensor and the communication circuit during standby mode.
| Operation mode | Before implementation |
After implementation |
Improvement effect |
|---|---|---|---|
| Standby | 2.55mA | 0.02mA | 99%reduction |
| Measurement | 6.4mA | 6.4mA | ― |
| Communication | 32.0mA | 32.0mA | ― |
5.2 Long-term reliability assurance for piezoelectric sensors
When put to continuous measurement use, a typical strain gauge has a guaranteed durability of only approximately two years at best and cannot provide sufficient reliability for long-term monitoring.
To provide the piezoelectric-strain sensor with assured longterm reliability, we developed our proprietary protective structure to achieve a guaranteed durability sufficient for 10 years of continuous use.
Fig. 13 shows the layered structure of the piezoelectric sensor. While the piezoelectric device (PVDF) per se has high weatherability, the degradation of the electrodes for extracting an electrical charge and the hydrolysis of the film (PET) used as insulation for the electrodes pose the problem of deterioration over time. On the other hand, weatherability enhancement with simple protection will result in deterioration of the strain transfer characteristics of the piezoelectric device due to the elasticity modulus relationship. To solve this problem, a weather-resistant polycarbonate similar to the piezoelectric device in terms of the modulus of elasticity was adopted as the base plate. For the top layer of the sensor, a high-weatherability, low-elasticity butyl rubber tape was adopted.
As a result, the elasticity modulus relationship is such that structure > base plate = piezoelectric device > butyl rubber (protective top layer). Thus obtained is a layered structure in which the strain of the structure is transferred as-is to the piezoelectric device, and the strain transfer is not compromised by the top-layer protective material.
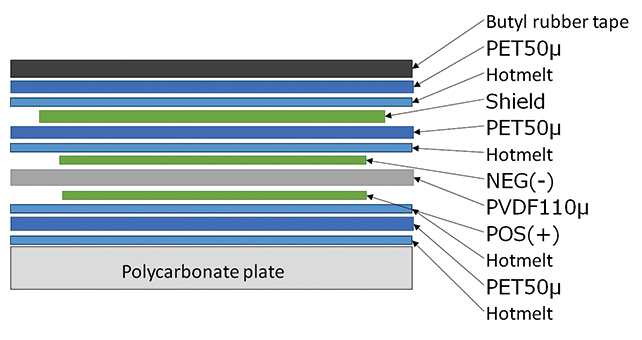
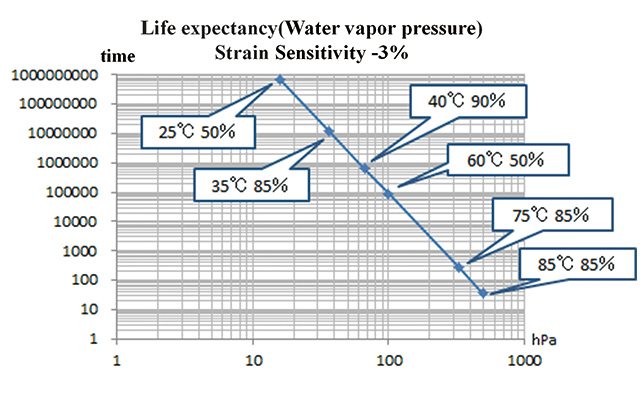
Fig. 14 shows the life prediction results obtained by fitting the accelerated temperature and humidity test data to an absolute water vapor pressure model. Even under an environment at 60°C, a 10 year-equivalent life is guaranteed. Thus, feasibility has been confirmed for use of the piezoelectric sensor for long-term measurements of bridges or in any other outdoor environments.
5.3 Trigger measurement functions
The trigger functions that initiate measurement and communication are important in the power supply control circuit shown in Fig. 12. An appropriate trigger is sent to the control unit to control the power supply circuit and optimize the power consumption during operation, thereby enabling longterm operation. The following describes the main trigger functions:
1) Periodic measurement function
This function drives the triggers according to the internal clock of the sensor node. This function allows the operator to set the start time and the measurement interval as desired, as well as to specify the measurement cycle. In the case of measuring a slow change, such as degradation-induced damage, this function is used to perform periodic long-term measurements. In the field demonstration test, the start time was set to three oʼclock in the morning and the measurement interval to 12 hours to perform measurement at a twice-a-day measurement cycle (3 a.m. and 3 p.m.). It should be noted that these settings can be changed remotely via the sink node.
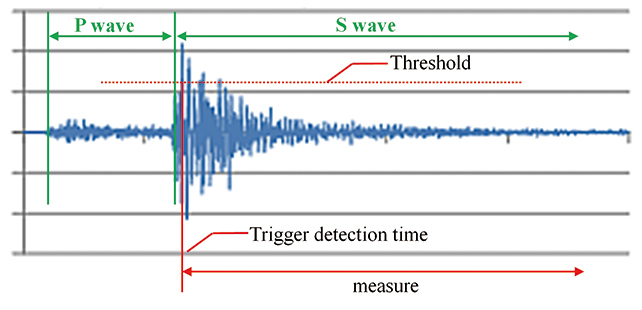
2) Earthquake measurement function
The acceleration sensor for the trigger measurement, which is mounted inside the sensor node, judges the vibration level (amplitude). When detecting a vibration level equivalent to the specified seismic intensity, this sensor switches the circuit to perform measurements. Fig. 15 shows the conceptual image of the seismographic function. Typically, an acceleration value (gal value) equivalent to the seismic intensity of the earthquake to be measured is set as the threshold value. In the case of a seismic intensity 4 earthquake, the threshold value will be approximately 20 gal. In the case of a seismic intensity 5 earthquake, the threshold value will be approximately 70 gal. Because the sensor starts measurement only after the threshold value is exceeded, it cannot measure P-waves. Still, the sensor can provide sufficient measurement data to evaluate the characteristics of the bridge of interest.
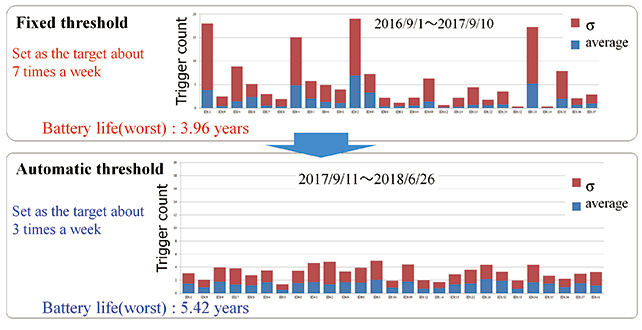
5.4 Automatic threshold setting function
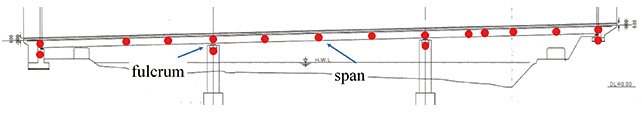
In bridge monitoring, measurements are taken at several points, such as support points and span sections as in Fig. 16. In a bridge, an acceleration equivalent to a seismic intensity does not always occur depending on the measuring point. These measuring points show variations among one another and differ from one another in vibration characteristics. Therefore, with a fixed threshold value, the number of triggers will vary significantly depending on the measuring point as shown in the upper panel of Fig. 17. In this case, the number of unnecessary measurements will increase at some measuring points, which makes it difficult to predict the remaining battery life.
Then, for on-bridge earthquake measurements, we have adopted a method of determining the occurrence of an earthquake at each measuring point based on a vibration that exceeds a normal vibration due to vehicular traffic or winds. More specifically, this is a method that takes peak value statistics from day-to-day acceleration data, estimates the daily average number of triggers from the statistical data for the immediate past week, and sets the threshold value for each sensor node based on the frequency of occurrence9). As shown in the bottom panel of Fig. 17, the adoption of this method has led to decreased variations among the measuring points and to a smoothed battery life, thereby making it possible to predict the remaining battery life of the system as a whole. As a result, a long-term operation design has become a reality.
6. Measurement results
In the MLIT field demonstration test related to the SIP Infrastructure Maintenance, Renewal, and Management Technology, an actual bridge was subjected to continuous measurement using this monitoring system during the period from 2014 to 2018. This field demonstration test was intended to grasp the characteristics of the bridge, including variations, by continuous measurement during our proposed monitoring in order to identify indicators usable for bridge maintenance from among these characteristics. This chapter describes the characteristics obtained of the actual bridge during the test. The bridge subjected to the field demonstration test is a 232-meterlong three-span continuous steel double box girder bridge. Consisting of three spans (71.3 m, 88.0 m, and 71.3 m long, respectively) and a reinforced-concrete deck, this bridge was put into service in March 2007.
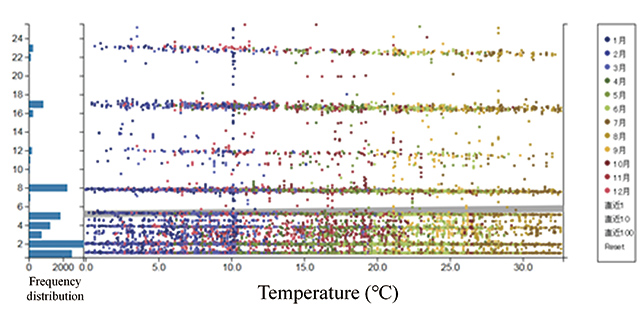
6.1 Normal frequencies
An normal frequency refers to a frequency specific to a structure and observable during free vibration of the structure. Any change in the structure due to a factor, such as damage, will result in a change to this normal frequency. When vibrations due to a forced vibration, such as an earthquake, match this normal frequency, resonance will occur and may lead to damage to the structure. It is of extreme importance to keep good track of normal frequencies for the purpose of understanding the characteristics of bridges. Fig. 18 shows the distribution of the values of up to vertical fifth-order normal frequencies with the X-axis representing temperature and the Y-axis representing the frequency of occurrences. This figure reveals that the fluctuations due to annual temperature changes showed a slight progressive decrease through the transition from low to high orders. At each order, these measured values were observed to have variations of approximately ±0.3 Hz. The figure represents the rigidity characteristics of the bridge of interest in its normal state, including these temperature characteristics and variations.
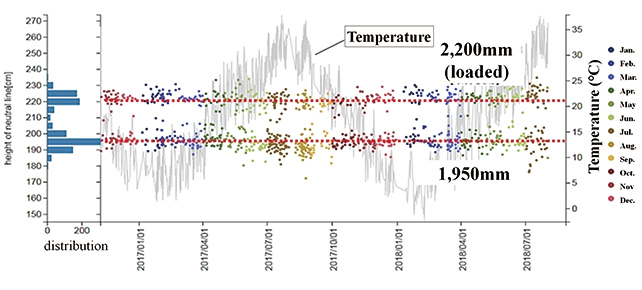
6.2 Neutral axis
When deflection occurs in a girder or some other member, compressive and tensile forces occur in the upper and lower parts of the girder. These compressive and tensile forces come into equilibrium with each other at a point along the axis in the cross-section of the girder. This axis is called the neutral axis. For the understanding of the cross-sectional stress in a bridge under rigidity degradation diagnosis, it is effective to identify the neutral axis in the cross section in the bridge axis direction. We installed strain sensors on the girder top and bottom flanges of the bridge of interest to calculate the neutral axis from the tensile and compressive strains in each flange. Fig. 19 shows the distribution of the measurements taken from September 2016 to July 2018 with the X-axis representing time and the Y-axis representing the distance from the bottom flange to the neutral axis. It turned out that the bridge of interest has two neutral axes due to torsional effect. The change in the position of each of these neutral axes serves as one of the indicators of the rigidity characteristics of the bridge of interest.
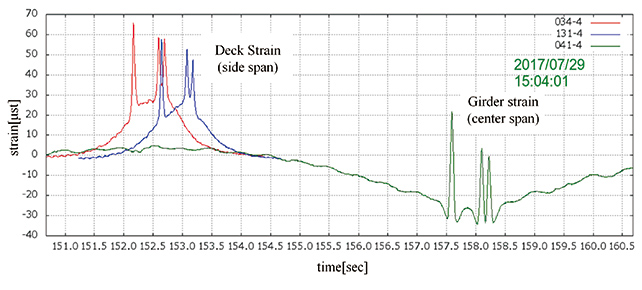
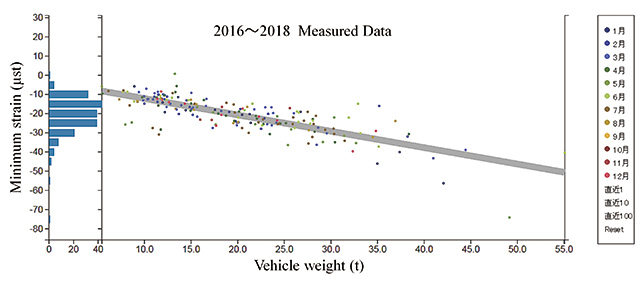
6.3 Correlation between live load and girder strain
It is effective to monitor the live load (i.e., the load of vehicular traffic flowing through the bridge) as the input information of a bridge in its normal state. By calculating the strain of the girder (girder strain due to vehicles passing by) as the response (output) of the bridge to the input, the bridge can be evaluated for potential rigidity degradation. Fig. 20 shows typical measurement data, while Fig. 21 shows a correlation diagram with the X-axis representing the live load and the Y-axis representing the girder strain. The slope in Fig. 21 varies depending on the flexural rigidity of the girder. This slope also indicates the rigidity characteristics of the bridge and is considered another indicator useful for monitoring the change in rigidity.
7. Conclusion
This paper presented the main technologies in, and typical measurement results of, the system we have been developing for a permanently installed monitoring system applicable to the maintenance of the social infrastructure. The technologies employed for this system are not novel but has been technically well established in the fields of electrical engineering and telecommunications engineering for several years. In order to apply these technologies to civil worksites, we added our own ideas to realize savings in power and a wireless system with assured durability and reliability. For the output data from this system to be better understood by civil engineers, they must be converted through the perspectives of civil engineering provided by techniques, such as structural identification, and provided in the form of structural deterioration and damage information. Technologies achieved in this way through the fusion of electrical, information, and civil engineering technologies are IoT technologies in the field of civil engineering and are expected to support the CPS society to come. To promote the wider use of these technologies among civil engineers, we will keep working on their on-site implementation while improving their track record on the field and the method of their application.
Last, but not the least, this study is based on the achievements of the MLIT Technological Research and Development for Promoting Application of Monitoring Technologies to Social Infrastructure related to the SIP Infrastructure Maintenance, Renewal, and Management Technology under the Council for Science, Technology and Innovation, Cabinet Office. We would like to express here our gratitude to the MLIT staff for the opportunity they gave us to conduct a field measurement demonstration test and to Prof. Eiichi Sasaki at the Tokyo Institute of Technology for the advice and guidance he extended from the beginning of the development of our system.
References
- 1)
- Ministry of Land, Infrastructure and Transport. Year One of Social Capital Maintenance. MLIT Public Relations Magazine Kokudokotsu (National Land and Transportation). 2013, No.122, p.4-5 (in Japanese).
- 2)
- Ministry of Land, Infrastructure and Transport, Road Bureau, National Highway and Risk Management Division. Guidelines for Periodic Bridge Inspection. June 2014 (in Japanese).
- 3)
- Ministry of Land, Infrastructure and Transport, Road Bureau. Guideline for Periodic Road-Bridge Inspection. June 2014 (in Japanese).
- 4)
- OMRON Corporation. “Civil and electrical engineers start a crossindustrial joint research on a monitoring system to develop new maintenance-related technologies for aging social infrastructure”. OMRON Online News Room: News Release 2013 (in Japanese). https://www.omron.co.jp/press/2013/08/s0807.html, August 7, 2013.
- 5)
- Kuroda, T.; Nishida, H.; Takase, K.; Sasaki, E. Development of a bridge monitoring system using power-saving wireless sensors, Part 2 (characteristics chart) (in Japanese). Abstracts from the 73rd JSCE Annual Meeting. CS9-017, August 2018.
- 6)
- Sasaki, E.; Sinsamutpadung, N.; Tuttipongsawat, P.; Kuroda, T.; Nishida, H.; Takase, K. Development of a bridge monitoring system using power-saving wireless sensors, Part 3 (characteristic analysis) (in Japanese). Abstracts from the 73rd JSCE Annual Meeting. CS9-018, August 2018.
- 7)
- Hinoue, T.; Nishida, H.; Miyaki, R.; Sasaki, E.; Vulpe, G. Development of low-power-consumption piezoelectric strain gauge for bridge monitoring (in Japanese). Abstracts from the 70th JSCE Annual Meeting. I-441, 2015, p.821-822.
- 8)
- Akai, R.; Nishida, H. et al. Development of a wireless time synchronization system for bridge health monitoring (in Japanese). Abstracts from the 70th JSCE Annual Meeting. 2015, Vol.70, I-410.
- 9)
- Nishida, H.; Takase, K.; Kuroda, T.; Sasaki, E. Development of a bridge monitoring system using power-saving wireless sensors, Part 1 (outline of the sensor) (in Japanese), Abstracts from the 73rd JSCE Annual Meeting. CS9-016, August 2018.
The names of products in the text may be trademarks of each company.