


Application of monitoring technology for social infrastructure (2)
- infrastructure
- bridge
- maintenance
- monitoring
- structural analysis
Infrastructure built in the period of high economic growth in Japan is becoming deteriorated. However, there are some social issues to maintain and manage. In addition to an increase in the number of structures that need to be inspected, advanced technical judgment is required for evaluation of the inspection result. Furthermore, it is an issue that costs are expensive due to mandatory checking once every five years. On the other hand, monitoring technology utilizing IoT technology capable of sophistication and efficiency improvement of operation and maintenance is expected. The authors developed a remote monitoring system with wireless power-saving sensors jointly with Tokyo Institute of Technology, we have carried out the field test at the bridge of the Ministry of Land, Infrastructure and Transport since 2014. In this paper, we report on the results of performance diagnosis by “Characteristics chart” and “Deterioration/damage scenarios” proposed by the authors using the system and the effectiveness of application for maintenance management.
1. Introduction
Many road bridges were constructed in the 1930s in the United States under New Deal projects, and about 50 years after in the 1980s, failures of the infrastructures like these bridges started to occur, and the cause of the failures is said to be inadequate maintenance and management of these structures1). In Japan, as many bridges were also constructed since the period of high economic growth in the 1960s, the safety of the infrastructure in the 2010s and later after the same 50 years from the construction has become a concern, and the Ministry of Land, Infrastructure, Transport and Tourism has been engaged in the study of prolonging the service life of these infrastructures and of the countermeasures for maintenance of these infrastructures. Under such a circumstance, concrete ceiling slabs collapsed at the Sasago tunnel of Chuo Expressway in December 2012, which demonstrated such a concern for the aging infrastructure, is well grounded and raised an issue about inspection of the infrastructure that was believed to be well managed.
Protection of the infrastructures against natural disasters like earthquakes and typhoons that frequently occur in Japan is also a social issue. The issues of protecting these infrastructures are diversified, so cross-disciplinary collaboration of the technologies in civil engineering, IoT, and AI is required.
While on the other hand, as these structures are custom engineered and built, it is difficult to systemize and standardize the issues like factory-made industrial products. Accordingly, the authors had established the chair of Sensing Solution Research for Civil Engineering Infrastructure in fiscal 2013 at the Tokyo Institute of Technology for research in the development and utilization of monitoring technology for the infrastructure to enhance accuracy and to improve the efficiency of maintenance in order to resolve the issues combining the sensing and IoT technologies of OMRON with the civil engineering expertise of the Tokyo Institute of Technology.
In fiscal 2014, the program was selected as the project for Infrastructure Maintenance, Renewal, and Management Technology under the Cross-Ministerial Strategic Innovation Program (SIP) sponsored by the Cabinet Office, and since then field demonstrations and verification of the monitoring system have been made for five years.
In Section 1 of this paper, the aging status of the infrastructure in our study and history of our research activities are explained. In Section 2, the importance of control criteria based on data for preventive maintenance is explained based on the present issues in the maintenance of the infrastructure. In Section 3, the authors proposed a monitoring method based on the Characteristics Chart , which is an index of degradation and damage, the Deterioration Scenario Evaluation, which assesses changes in the index for bridges, and diagnostic procedures for the structure depending on the class. In Section 4, the application results of the developed monitoring system in the field demonstration of SIP are shown. Corrosion of the steel members and cracking of the concrete floor slabs were observed in the monitored bridge, and decreasing rigidity was a concern. Monitoring has shown that the cracking contributes to the decreasing rigidity of the bridge girder based on the relationship to the feature values of the structure. It is further explained that the proposed method can be used to establish control criteria by showing the integrity of the structure (present performance) quantitatively and estimating the initial condition and the ultimate condition, which is useful for maintenance and management based on preventive maintenance. Section 5 shows the conclusions obtained in this study.
2. Current Status and Issues of Maintenance and Management
It is required that maintenance and management of the infrastructure must move in the direction of placing an importance on maintaining the existing structure rather than the scrap and build concept. This is because renewal of the infrastructure becomes financially difficult, although much of the infrastructure is aging and exceeds 50 years from construction. This makes maintenance of the structure with application of repairs and/or reinforcement important to make the functions and performance of the infrastructure suitable for its intended use.
There are two types of maintenance—corrective maintenance and preventive maintenance—and the former is maintenance performed after the functions and performance of the structure are reduced or lost caused by damage and/or deterioration, and the latter is maintenance to prevent degradation of the functions and performance of the structure by deliberately performing inspections, repairs, or replacement before a failure occurs.
As shown in Fig. 1 in the case of preventive maintenance, the integrity (existing performance) of the structure is constantly monitored and evaluated according to the control criteria, and small repairs may be applied. Thus, the service life of the structure can be extended with assured safety and security, and the lifecycle cost can be reduced by saving the renewal costs2).
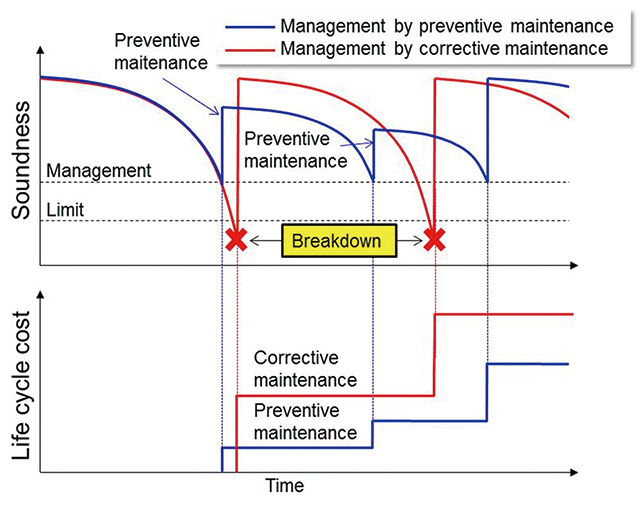
In order to carry out preventive maintenance, it is important to monitor the integrity of the structure and establish control criteria. However, inspections according to the maintenance practice at present are principally visual inspections and superficial evaluations of the deterioration of the structure by operators made once every five years, and it is said such inspections are not related to the performance evaluations3). Accordingly, the authors studied the method to evaluate the integrity and to estimate the service life limit of the bridge using objective data where problems due to deterioration are imminent.
3. Proposal of Solutions
3.1 Characteristics Chart and deterioration scenario evaluation
For maintenance and management of the structure, measurement of the response of the structure to external forces is commonly used. Typical measurement items are vibration (acceleration), inclination, displacement, or strain. A bridge, for example, is subject to vibrations caused by external forces caused by live loads (vehicle traffic) or earthquakes. To measure the natural vibration characteristics of a bridge that is determined by mass and rigidity is the commonly used method to understand the characteristics of the bridge. The bridge deforms due to external forces, and the deformation produces stress. The basic element used in bridge design is stress, but stress cannot be measured directly, so the strain that is related to stress is measured.
Various methods to monitor stress and strain using fiber optics and wireless technology are already proposed4). However, it is said that these methods do not satisfy the technical knowledge level of the deterioration mechanism and cannot explain deterioration and damage5). The issues considered to be resolved are that in many cases the measurement data (vibration, strain, etc.) are used as the direct indicator of an evaluation, and it is difficult to understand what items with respect to the structure are indicated by a change in the indicator, and an evaluation of the factors of any change is impossible because only the response of the structure is evaluated.
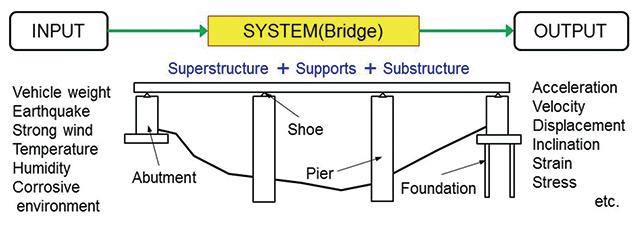
In the control area, system identification is made using the measurement data in order to analyze and estimate the actual system and phenomena, and the same procedure is used in monitoring of the structure; and as shown in Fig. 2, it is important to evaluate the correspondence between the input (force produced by the load, earthquake, etc.) and the output (response of the bridge). As such correspondence represents the structural characteristics of the bridge, it is called as the Characteristics Chart, which is proposed as a concept of new evaluation indicator.
It is necessary to select the combination of the input and output from the Characteristic Chart depending on the deterioration damage to be monitored, but increasing the number of sensor types is not desirable considering the workload to install and maintain the sensors, the costs, and the reliability. Accordingly, the sensors installed are the acceleration sensor and strain sensor, which can be used universally, and the data from these sensors are converted to the required information by the host system. For example, acceleration data can be converted to the natural frequency or displacement, and strain data can be converted to the neutral axis or live load to obtain the information corresponding to the deterioration damage to resolve the above issue.
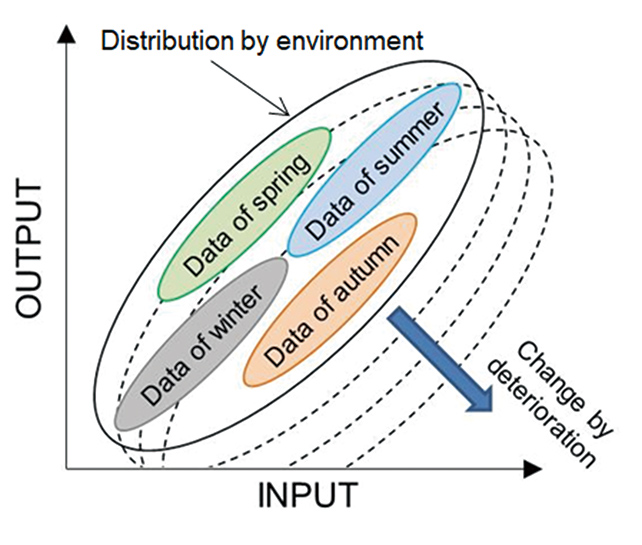
Furthermore, as shown in Fig. 3, even when the integrity of the structure is maintained, the Characteristics Chart will be distributed within a certain range due to the effect of temperature or live load, and the distribution will also change due to the progress of the deterioration damage. So, if a change in the Characteristics Chart can be extracted as the feature values of the structure while understanding the distribution of the data, the integrity of the structure can be known and which then allows an estimate of the initial and ultimate conditions. The feature values mean the parameters representing the characteristics of the material and structure, typically, Youngʼs modulus, density, and spring constant. The authors call this new proposed evaluation method that combines the Characteristics Chart and the structural analysis the Deterioration Scenario Evaluation.
3.2 Monitoring procedure
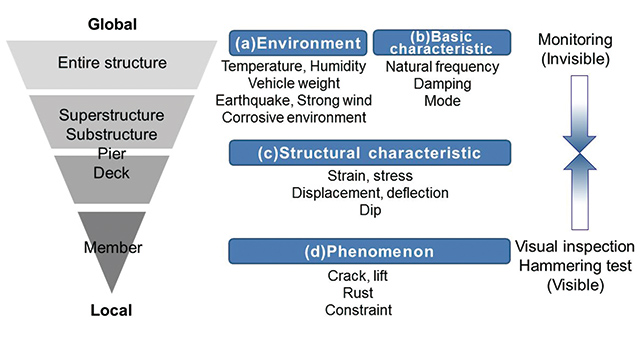
Because the structure of the bridge is huge and complicated, it is difficult to precisely predict the position where deterioration damage will occur. Accordingly, it will be effective to focus on the specific sections of the bridge from the entire structure (global) to the superstructure, substructure, and support members6) as shown in Fig. 4. It is difficult to predict the position of deterioration damage to the level of members or material (local), so prediction combined with the periodic inspection is effective.
4. Field Demonstration
4.1 Planning
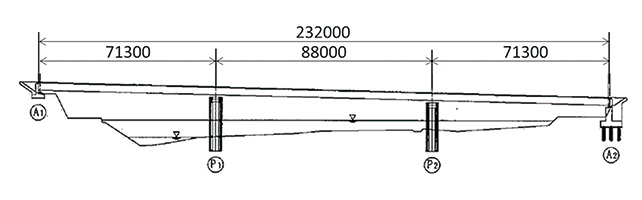
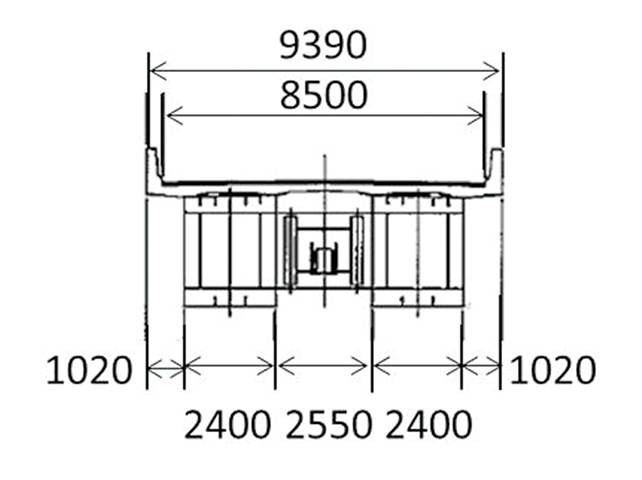
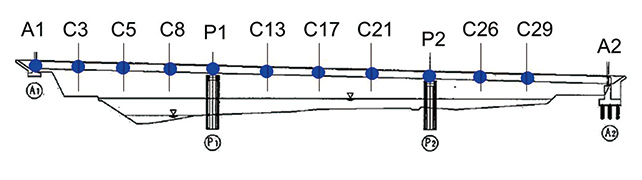
After our program was awarded the SIP Project in fiscal 2014, a field survey was conducted to establish a monitoring plan at the demonstration site provided by the Ministry of Land, Infrastructure, Transport and Tourism. The bridge provided for demonstration is the three-span continuous non-composite steel box girder bridge constructed in March 2007 with a length of 232 m, span length of 71.3 m + 88.0 m + 71.3 m, and having the RC floor slabs. Fig. 5 is the side view and Fig. 6 is the cross section of the bridge.
According to the survey, cracks perpendicular to the bridge axis were observed at about 1 m spacing in the RC floor slabs of the center span, and the progress of corrosion was observed on the surface of steel members. The demonstration plan was prepared as shown in Table 1 based on the survey results to determine the decrease of rigidity caused by corrosion and cracking by incorporating the monitoring procedure explained in Subsection 3.2. The plan also included the evaluation of damage caused by earthquakes for the purpose of disaster management.
| item | Purpose | Evaluation | |
|---|---|---|---|
| Normal | Corrosion (Box girder) | Grasp corrosive environment and observation | (a) Environment: Corrosivity |
| Grasp of deterioration of stiffness due to reduction in plate thickness |
(a) Environment: Vehicle weight, temperature (b) Basic characteristic: vibration (Natural frequency, damping, mode) (c) Structural characteristic: strain, deflection sectional stiffness (Neutral axis, synthetic effect, and cross-sectional stiffness) |
||
| Concrete crack (Center span: 1m interval) | Grasp of deterioration of concrete stiffness | ||
| Disaster | Earthquake Strong wind | Detect of abnormality occurrence position, time, level | Nonlinear response between members |
4.2 Evaluation of environment of use (live load)
(1) Purpose
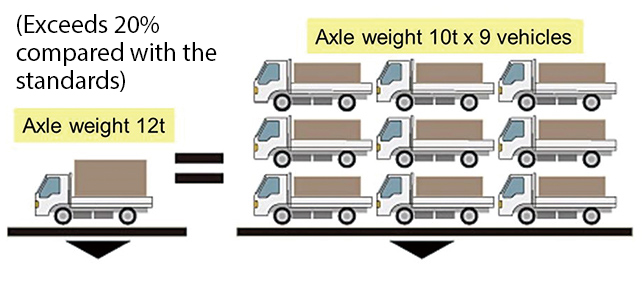
It is generally known that damage to the structure occurs due to fatigue caused by cyclic loads applied by vehicle traffic. So the Road Act provides that the gross weight of a vehicle should be 20 tons at maximum and the axle weight should be 10 tons at maximum. Especially in the case of a bridge, the studies showed that such live loads due to vehicle traffic are the primary cause of the damage, and it has been reported that vehicle weight affects the damage in magnitude of the 12th power7). For example, the effect of one vehicle with an axle weight of 12 tons on the fatigue of the bridge is equal to the effect of nine vehicles with axle weights of 10 tons as shown in Fig. 7. So the authors measured the live loads of the bridge, which are used as input information in the evaluation of the environment of use and the evaluation of the structural characteristics in Subsection 4.4.
(2) Installation of sensors
The authors used the Bridge Weigh-In-Motion (B-WIM) to obtain vehicle weights on the bridge from the response of bridge structural elements. B-WIM was developed in the United States in the 1970s, and the method using the influence line of the girder is primarily used. The influence line is a graph indicating changes in the response of the structural elements (e.g., sectional force, reaction force of the girder, etc.) when the unit load moves as a function of the position of the unit load.
The response time for the influence line of the girder becomes longer because the influence line is dependent on the span length, and when there are numbers of vehicles involved, the influence line is affected by each vehicle. Accordingly, B-WIM was constructed to use the influence line of the floor slab whose response time is relatively fast instead of the girder9). The sensors used are piezoelectric strain sensors developed by the authors, which save electric power and withstand outdoor installation for a long time10).
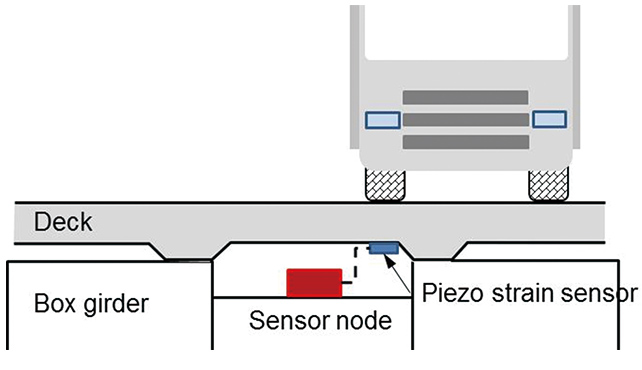
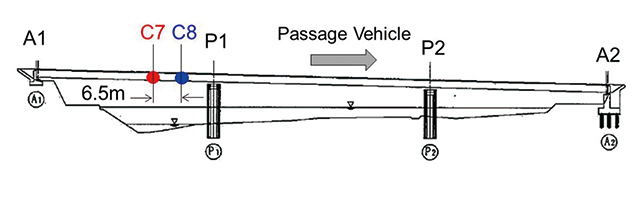
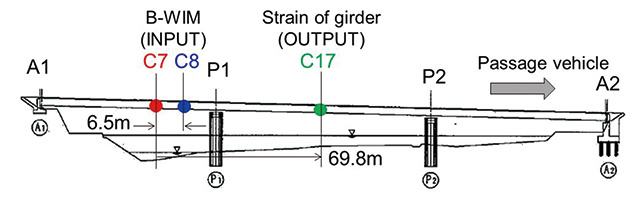
As the characteristics of the piezoelectric strain sensor are dependent on the measurement direction, the sensors were installed along the lane width of the floor slab on the back surface near the position where the tires will pass by to avoid the effect of the girder (along the direction of moving vehicles) as shown in Fig. 8. In order to measure vehicle speeds, the sensors were installed at two points along the direction of moving vehicles (C7 and C8 of Fig. 9).
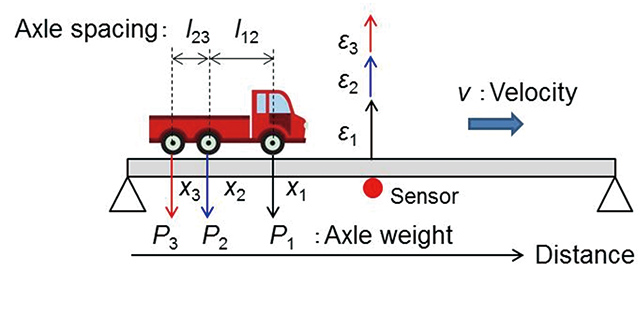
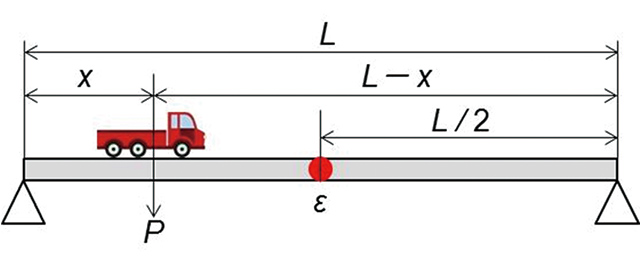
A brief explanation of the principles of B-WIM11) is as follows. Consider the relationship between the strain and load at the point where the strain sensor is installed (x = 0) for a threeaxle vehicle running on the bridge at speed  as shown in Fig. 10.
As the influence line is expressed as the function of position  as
as  where the unit load is applied, the following relation applies for theoretical strain
  .
.
-
 (1)
(1)
When the first axle passes by the sensor at time  = 0, the theoretical strain
  at =
at =  can be obtained from Equation 1 as follows:
-
 (2)
(2)
Suppose that wheelbase  and axle weight
  are known, and is obtained from the time required to pass and the distance between two strain sensors installed at the positions located along the vehicle moving direction as shown in Fig. 9. When the measured strain at time is
  , the influence line is determined so that the squared error
  between and at all the measurement points within the measurement time becomes the minimum.
-
 (3)
(3)
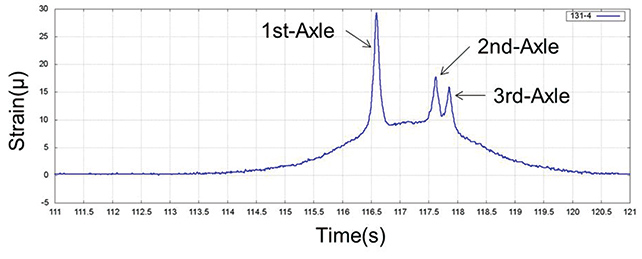
was determined by the running test using the test vehicle before monitoring and using B-WIM started. Fig. 11 shows the measured waveform at the vehicle running test and Fig. 12 shows the influence line obtained.
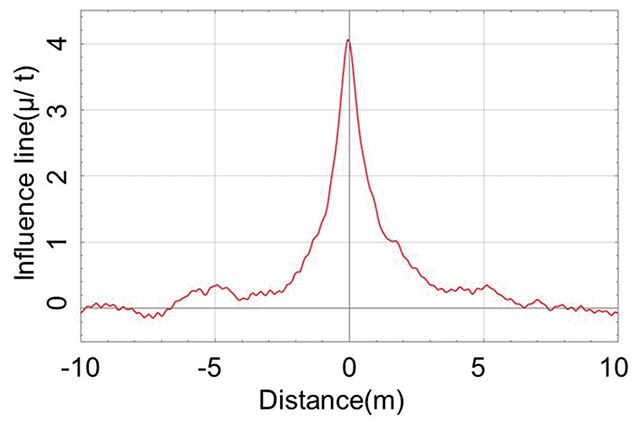
When B-WIM is used, the distance between axles is obtained from speed and the time difference when the respective axles pass the sensors. Using Equation 3, the axle weight can be obtained from the distance between axles and the influence line obtained before monitoring started.
(3) Evaluation of accuracy of B-WIM
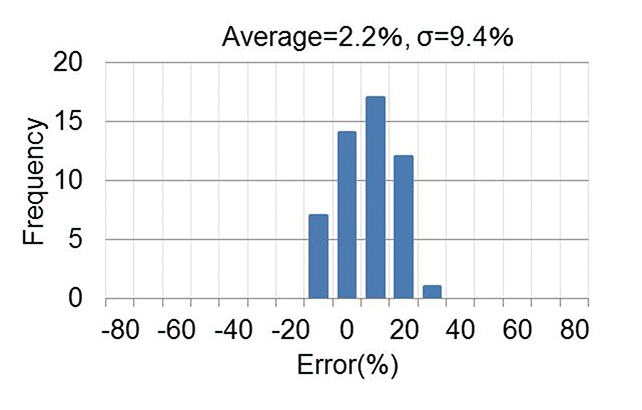
The accuracy of B-WIM was evaluated by the test drive. The specifications of the vehicles used for the test and the test conditions are shown in Table 2 and Table 3, respectively. The target accuracy was set at the confidence level of 90% (mean value ±1.65  , : standard deviation) using the standards for weight measurement in Europe and the U.S12),13) as reference with a measuring error of ±20% or less considering the test conditions (number of vehicles, positions of the vehicle running, load, duration, and sample size). This is a level where the data obtained can be processed statistically.
| Date | No. | GVW(t) | 1st-axle(t) | 2nd-axle(t) | 3rd-axle(t) |
|---|---|---|---|---|---|
| Jan, 2017 | 1 | 11.82 | 4.98 | 3.58 | 3.26 |
| 2 | 19.86 | 6.12 | 7.04 | 6.70 | |
| Sep, 2017 | 3 | 19.78 | 8.08 | 6.06 | 5.64 |
| 4 | 15.22 | 6.44 | 4.52 | 4.26 | |
| Sep, 2018 | 5 | 19.78 | 5.72 | 7.16 | 6.90 |
| 6 | 15.32 | 6.00 | 4.80 | 4.52 |
| Date | No. | Frequency | Velocity |
|---|---|---|---|
| Jan, 2017 | 1 | 8 | 20-60[km/h] |
| 2 | 6 | ||
| Sep, 2017 | 3 | 11 | |
| 4 | 9 | ||
| Sep, 2018 | 5 | 8 | |
| 6 | 10 |
As shown in Fig. 13, the measuring error was 17.7% by 52 running tests of the vehicles, and the target accuracy was satisfied.
As the piezoelectric strain sensor has temperature characteristics of 0.47%/°C, the measurements were temperature compensated. As it was confirmed that the offset of the measured values of about 2% occurs every year at the monitored bridge due to aging (sensor and irregularity of the road surface), and calibration was applied.
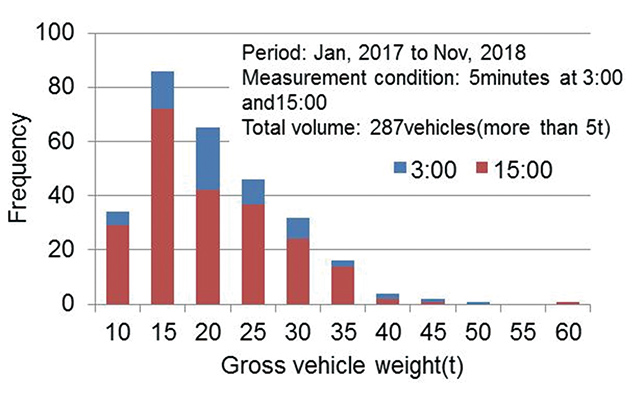
(4) Evaluation of traffic volume by gross vehicle weight
Traffic volume by gross vehicle weight for two years was obtained using the B-WIM. Measurements were made twice a day at 03:00 and 15:00 for a duration of 5 minutes every day, and only vehicles with a gross weight of 5 tons or larger were counted. Fig. 14 shows the results. The results showed vehicles with gross weights exceeding 20 tons of the limit by the Road Act were using the bridge.
4.3 Evaluation of basic characteristics
(1) Purpose
Decreases in rigidity of the monitored bridge were of concern due to cracking of the RC floor slabs and corrosion of steel structural members. So the natural frequency that represents the basic characteristics of the entire bridge (global) is taken for the Characteristics Chart, and changes in the Chart are studied. For the study, it is effective to conduct an influence analysis and to obtain a change distribution in the feature values (structural parameters) using numerical models. Accordingly, the authors constructed a numerical model and estimated the parameters affecting the state of deterioration and damage (cracking of RC floor slab and corrosion of steel structures) with the natural frequency as the target of the evaluation14).
(2) Installation of sensors
The acceleration sensor to measure the natural frequency needs to measure lower mode vibrations in order to capture the basic characteristics. Positions where the acceleration sensors are placed are shown in Fig. 15. With points P1, P2, A1, and A2 as fixed ends, sensors were installed at the middle points C5, C17, and C29 of Fig. 15 to measure the odd number modes of vibrations and at the points C3, C8, C13, C21, and C26 of Fig. 15 to measure the even number modes.
(3) Evaluation
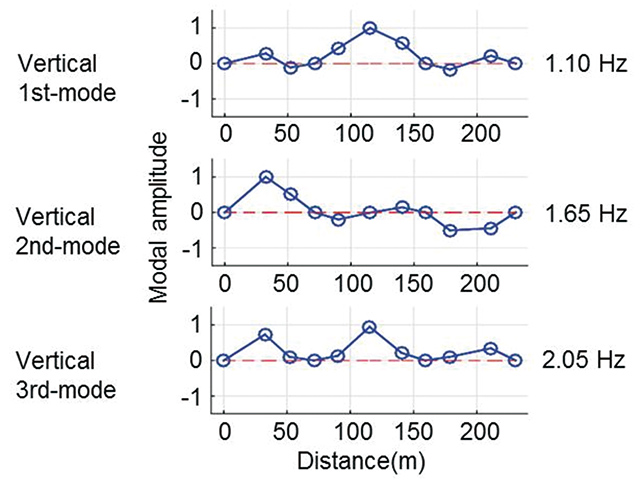
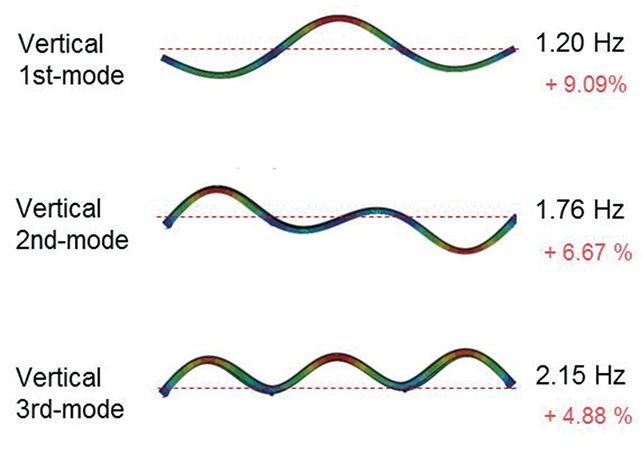
The structure identification analysis based on the acceleration data obtained was performed using the natural frequency. NExT-ERA15),16), one of the methods used for system identification analysis, was used for the analysis. This is a method to obtain the natural frequency by extracting the free damping response waveform from the forced acceleration waveform caused by vehicle traffic. The identification results for the primary to third modes are shown in Fig. 16.
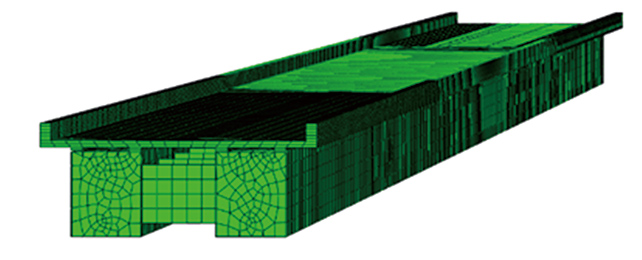
On the other hand, the numerical model of the main girder, cross girder, RC floor slab, and rubber support was constructed according to the engineering drawings of the bridge. Fig. 17 shows the example of the model, and Table 4 shows some of the parameters used. The natural frequencies obtained by the structural analysis using the numerical model are shown in Fig. 18. When the results of the identification and analysis are compared, there is 5% to 10% difference. This is a difference between the initial condition (analysis based on the design values) and the present condition (measurement data) when the natural frequency is used as the Characteristics Chart, and to determine the structural parameters affecting such change is the deterioration scenario evaluation.
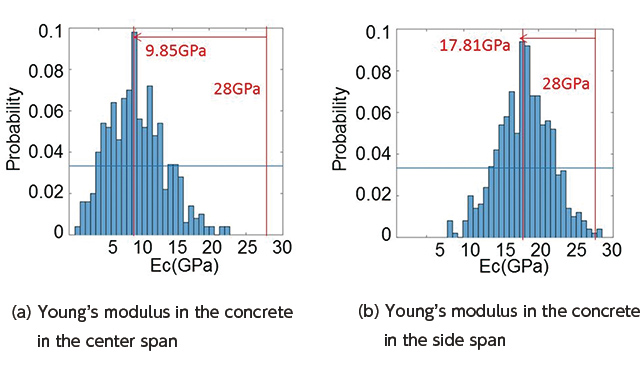
Bayesian inference was used to estimate the parameters. Bayesian inference is an arithmetic method to renew the information by adding newly acquired information to existing information, and the design values are used as existing information, and the structural identification results are used as the newly acquired information to estimate the structural parameters at present. The results indicated that Youngʼs modulus (Ec) of the concrete in the center span most significantly affected differences between the natural frequencies, and Youngʼs modulus decreased from 28 GPa to 9.85 GPa. Fig. 19 shows the results of the parameter estimation. The results are consistent with the state where cracking occurs in the RC floor slab in the center span. It means that the estimation of the feature value for the damage is made from the natural frequencies of the entire bridge (global) to Youngʼs modulus of the concrete in the center span (local).
| Parameters | Nominal value |
|---|---|
| Steel Young’s modulas (Es) | 205(GPa) |
| Steel density (ρs) | 7750(kg/m3) |
| Steel Poisson’s ratio (Vs) | 0.3 |
| Concrete Young’s modulas (Ec) | 28(GPa) |
| Concrete density (ρc) | 2300(kg/m3) |
| Concrete Poisson’s ratio (Vc) | 0.17 |
4.4 Evaluation of structural characteristics
(1) Purpose
Important items in the monitoring are to compare and evaluate the input information to the bridge with the output as shown in Fig. 2. The relationship between the input and the output indicates the structural characteristics of the bridge, and it is important to evaluate the causes of deterioration and damage to the bridge. So, an evaluation of the Characteristics Chart was made using the live load obtained in Subsection 4.2 as an input and strain of the girder as an output.
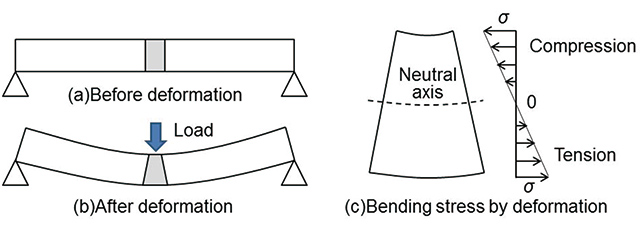
First, consider the structural meaning of the relationship between the live load and strain of the girder. As shown in Fig. 20, when a load is applied to the girder, the upper section of the girder is compressed, and the lower section is stretched, and there is a distribution of both compression and tensile stresses in the cross section of the girder. This stress distribution is called the bending stress , and the relationship between distance  from the neutral axis ( = 0) to the top (or bottom) of the girder, moment of inertia I and bending moment
  of the cross section of the girder is expressed as in Equation 4.
-
 (4)
(4)
The relationship between the live load  of the vehicle running on the girder and strain
  produced at the center of the girder as shown in Fig. 21 is expressed as Equation 5, where
  is Youngʼs modulus of the material.
-
 (5)
(5)
From the Equations 4 and 5, the following relation is obtained.
-
 (6)
(6)
Where;

-
 : Span length, : Position of the load
-
 : Bending moment at the position where is applied.
From Equation 6, the relationship between the live load and strain indicates  . As indicates the bending rigidity (resistance of the material against bending force), to use such a relationship as an index is effective as a method to monitor the decrease in rigidity due to deterioration and damage.
(2) Installation of sensors
Positions where the strain sensors are installed are shown in Fig. 22. The strain at the center of the center span (C17 of Fig. 22), where cracking of the RC floor slab occurs, was used as the output, and the live load obtained in Subsection 4.2 was used as the input to prepare and evaluate the Characteristics Chart.
(3) Evaluation
Examples of strain measurement are shown in Fig. 23. The abscissa indicates time and the ordinate indicates strain at the respective positions of the sensors. These data were associated as the same vehicle by the speed and the number of axles, and the Characteristics Chart was prepared. The data were compensated for temperature and offsetting.
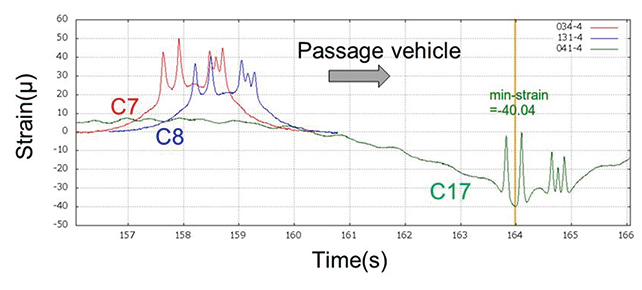
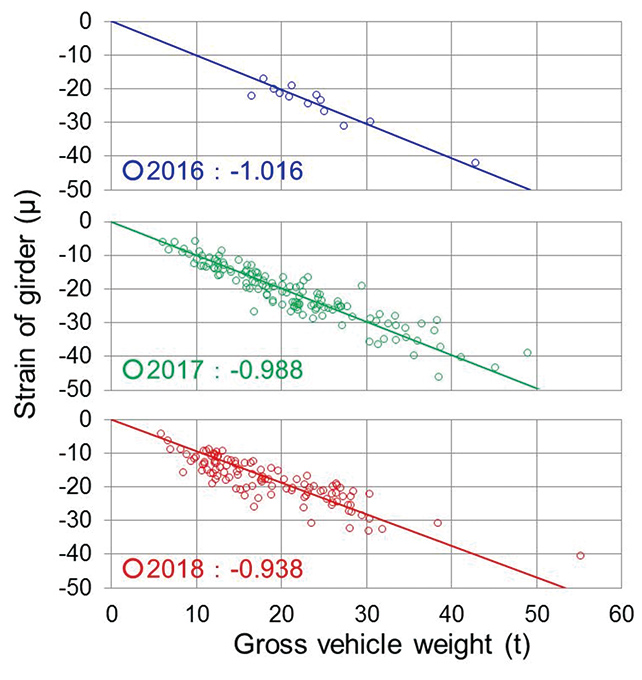
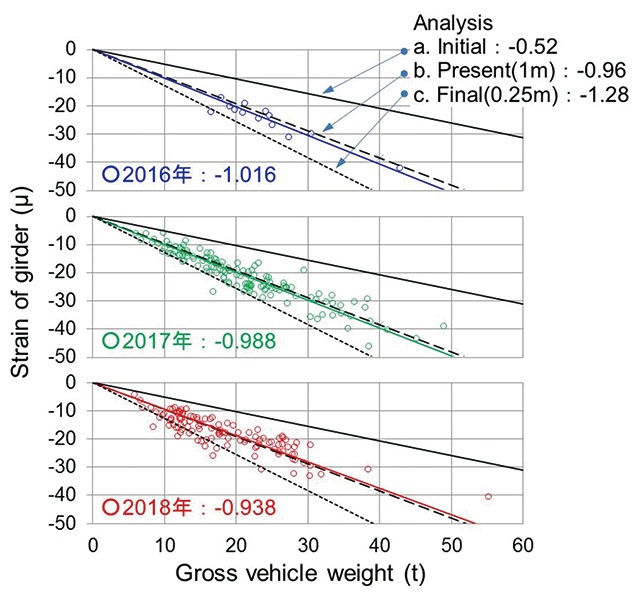
Fig. 24 shows the prepared Characteristics Chart. The abscissa is the live load, the ordinate is the strain of the girder at C17, and the graphs for the respective years from October 2016 to November 2018 are shown. Numbers at the bottom left corner of the graph are the slope of the approximation line of the measured data and it represents inverse of according to Equation 6.
The Deterioration Scenario Evaluation by structural analysis was performed next. In order to make a more realistic evaluation, was taken as the value of the side span where cracking was not observed (Ec = 17.81 GPa), and the numerical model where cracking occurred only in the center span was created, and the analysis with different values of “I” was conducted.
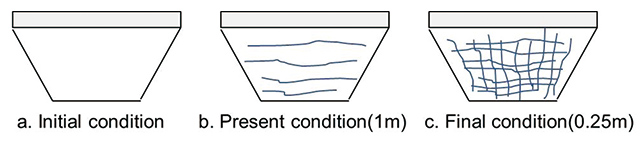
An evaluation was made according to progress of deterioration due to cracking of the RC floor slabs with condition “a” as the initial condition without cracking, condition “b” as the condition with cracking at 1 m spacing perpendicular to the bridge axis only in the slab of the center span like the actual bridge, and condition “c” with cracking in the latticework at 0.25 m spacing, the rebar spacing perpendicular to and along the bridge axis. Schematics how the cracking propagates are shown in Fig. 25 and the evaluation results are shown in Fig. 26.
It is confirmed that the Characteristics Chart and the analysis results are almost consistent in condition “b” where the cracking occurs at 1 m spacing perpendicular to the bridge axis only in the slab of the center span like the actual bridge. When comparison is made in condition “a” without cracking, a decrease in rigidity is observed, and in condition “c”, the ultimate condition, a further decrease in rigidity is observed. As explained above, the initial condition, present condition, and ultimate condition can be quantitatively expressed by the Deterioration Scenario Evaluation, and it becomes possible to determine the integrity of the structure (existing performance). The control criteria can be also established, and it is shown that preventive maintenance at the appropriate times can be implemented.
5. Conclusion
In this paper, an understanding of the integrity of the structure based on objective data, development of a method to assess the service life limit, and a field demonstration in order to realize the preventive maintenance were explained. The integrity of the monitored bridge was relatively good after 10 years from construction, and the authors consider that the proposed monitoring method is effective. The results obtained from this study are as follows.
(1) The method to define the evaluation indicators focusing on the input/output response of the structure as the Characteristics Chart and the feature values affecting a change of the Characteristics Chart are identified by structural analysis, and quantification of the initial, present, and ultimate conditions of the structure is introduced as the Deterioration Scenario Analysis. The method was applied in a five-year demonstration in order to establish the method to diagnose the integrity of the structure and the control criteria by applying the method according to the evaluation level depending on the level of the structure.
(2) As evaluation of the environment of use, live load measurement by B-WIM was made using the piezoelectric strain sensor developed by the authors. Measurement error of 20% or less (mean ± 1.65) of the vehicle gross weight to the true value was realized by the running test, and the actual conditions of road traffic that exceeded the provisions of the Road Act were revealed in the evaluation of the traffic volume by weight relative to the general traffic.
(3) In the evaluation of the basic characteristics, a comparison of the structural identification using the acceleration data and structural analysis using the numerical model were compared focusing on the natural frequency of the entire structure. The differences in the natural frequencies between the initial condition and condition at present were estimated as a result of the decrease in Youngʼs modulus of the concrete in the center span, and it was confirmed that the position of the damage can be narrowed to the floor slab in the center span from the entire bridge structure.
(4) For the center span, a structure analysis was conducted taking propagation of the cracking of concrete that was clearly observed into consideration based on the structural characteristic that the Characteristics Chart of the live load and the girder strain represent the bending rigidity of the girder. The results indicated that the Characteristics Chart and the structural analysis consistently explained the present condition and could estimate initial and ultimate conditions and could quantify the integrity of the structure.
(5) Although it is not stated in this paper, adhesion of sea salt to the bridge was estimated based on humidity and the output of the ACM type corrosion sensor as evaluation of the corrosive environment. The data indicated that the condition was highly corrosive. In addition, the acceleration data during the earthquake of JMA seismic intensity 5+, which occurred during the demonstration, was obtained by trigger measurement, and an evaluation of the support structure where a damage was expected was also made. Comparing the vibrations before and after the earthquake, it was confirmed that no damage was caused17).
(6) Evaluations by seven types of Characteristics Chart , including items in (5) above, were made, and the results indicating the decrease in rigidity estimated at the beginning of planning were obtained for four types according to validation with the structural analysis and to the evaluation of integrity. The authors considered establishing control criteria on the Characteristics Chart for proposal of a maintenance plan based on long-term monitoring and for realization of the information provision method, in order to implement use of the proposed system.
Acknowledgement
A part of this study is based on the results obtained in the project of the Ministry of Land, Infrastructure, Transport and Tourism ”Technology Research and Development for Promotion of Application of Monitoring Technology for Social Infrastructure” in the program of Infrastructure Maintenance, Renewal and Management Technology under the Crossministerial Strategic Innovation Program (SIP) sponsored by the Council for Science, Technology and Innovation of the Cabinet Office. The authors express special thanks to the officials of the Ministry of Land, Infrastructure, Transport and Tourism who arranged for the bridge used in the study.
References
- 1)
- Choate, P. et al. America in Ruins. The Decaying Infrastructure. Duke University Press, 1983, 115p.
- 2)
- White Paper on Land, Infrastructure, Transport and Tourism (2009),http://www.mlit.go.jp/hakusyo/mlit/h21/hakusho/h22/pdf/kp210000.pdf, (accessed on 2018-12-07) (in Japanese).
- 3)
- Saito, S. Issues and Prospects in maintenance of Infrastructure. Seminar on Countermeasures for Aging Road. 2016-02-29 (in Japanese).
- 4)
- Kimura, Y.; Nanazawa, T.; Sawada, M. Survey of Monitoring Technology of the Damaged Bridge. Public Works Research Institute, 2009 (in Japanese).
- 5)
- Study Committee on Utilization and Promotion of Social Infrastructure Monitoring Technology. “Present Status and Issues of Monitoring Technology”. Ministry of Land Infrastructure, Transport and Tourism, http://www.mlit.go.jp/tec/monitoring.html, (accessed on 2018-12-07) (in Japanese).
- 6)
- National Institute for Land and Infrastructure Management (NILIM). Guidelines for Use of Structural Health Monitoring Technology supporting Maintenance, Management, and Distribution of Housing for Use by Multiple Generations (Draft). 2011, p.4-5 (in Japanese).
- 7)
- Matsui, S. Technical Development of Floor Slabs - Rationalization of Construction for Improvement of Durability. Bridge and Foundation. 1997, Vol.30, No.8, p.84-94.
- 8)
- Road Bureau, Ministry of Land, Infrastructure, Transport and Tourism. “Enforcement on Control of Traffic of Special Vehicles”. 2008. http://www.mlit.go.jp/report/press/road01_hh_000026.html,(accessed on 2018-12-07) (in Japanese).
- 9)
- Dung, C. V.; Sasaki, E.; Nishida, H.; Hinoue, T. Novel Application of PVDF Sensors for Vehicle Weight Identification in Reinforced Concrete Deck Steel Bridges. Journal of Bridge Engineering. 2018.
- 10)
- Hinoue, T.; Nishida, H.; Miyaki, R.; Sasaki, E.; Vulpe, G. Development of Electric Power Saving Piezoelectric Strain Sensor for Monitoring of Bridge Structure. 70th Annual Meeting of Japan Society of Civil Engineering. 2015, I-441, p.821-822 (in Japanese).
- 11)
- Moses, F. Weigh-in-Motion System Using Instrumented Bridges. Transportation Engineering Journal, Proceedings of ASCE. 1979, Vol.105, No.TE3, p.233-249.
- 12)
- American Society for Testing and Materials. Standard Specification for Highway Weigh-in-Motion (WIM), Systems with User Requirements and Test Method (E1318-949).
- 13)
- COST323. Weigh-in-Motion of Road Vehicles Final Report. Version 3.0. August 1999.
- 14)
- Sasaki, E.; Tuttipongsawat, P.; Sinsamutpaduug, N. Condition Evaluation of A Highway Bridge with RC Deck using Monitoring Data Obtained by Wireless Sensors. 1st International Conference on CASTED 2018.
- 15)
- Juang, J.-N.; Pappa, R. S. An eigensystem realization algorithm for modal parameter identification and model reduction, Journal of Guidance, Control, and Dynamics. 1985, Vol.8, No.5, p.620-627.
- 16)
- Farrar, C. R.; James, G. H. System Identification from ambient vibration measurements on a bridge. Journal of Sound and Vibration. 1997, Vol.205, p.1-18.
- 17)
- Nishida, H. Takase, K.; Kuroda, T.; Sasaki, E. Development of Bridge Structure Monitoring System with Electric Power Saving Wireless Sensor - 1 (Outline of the Sensor). 73th Annual Meeting of Japan Society of Civil Engineering. 2018, CS9-016 (in Japanese).
The names of products in the text may be trademarks of each company.