By Business
Net Sales
’╝łMillions of Yen’╝ē
| FY2020 | FY2021 | FY2022 | FY2023 | FY2024 | |
|---|---|---|---|---|---|
| IAB | 335,621 | 418,107 | 485,738 | 393,572 | 360,799 |
| HCB | 123,087 | 132,857 | 142,132 | 149,726 | 145,866 |
| SSB | 95,663 | 87,692 | 107,273 | 141,600 | 145,631 |
| DMB | 96,853 | 120,972 | 138,854 | 114,357 | 105,441 |
| DSB | - | - | - | 17,370 | 42,738 |
| Eliminations & Corporate | 4,305 | 3,299 | 2,085 | 2,136 | 1,278 |
| Total | 655,529 | 762,927 | 876,082 | 818,761 | 801,753 |
Operating Income
’╝łMillions of Yen’╝ē
| FY2020 | FY2021 | FY2022 | FY2023 | FY2024 | |
|---|---|---|---|---|---|
| IAB | 57,182 | 76,257 | 85,835 | 21,463 | 36,276 |
| HCB | 20,573 | 18,544 | 16,018 | 18,463 | 17,482 |
| SSB | 5,693 | 6,505 | 7,490 | 14,021 | 16,786 |
| DMB | 4,573 | 10,086 | 15,501 | 3,148 | 306 |
| DSB | - | - | - | 2,184 | 2,829 |
| Eliminations & Corporate | -25,523 | -22,076 | -24,158 | -24,937 | -19,640 |
| Total | 62,480 | 89,316 | 100,686 | 34,342 | 54,038 |
IAB: Industrial Automation Business
HCB: Healthcare Business
SSB: Social Systems, Solutions & Service Business
DMB: Device & Module Solutions Business
DSB: Data Solution Business
IAB: Industrial Automation Business Net sales, of total: 45%
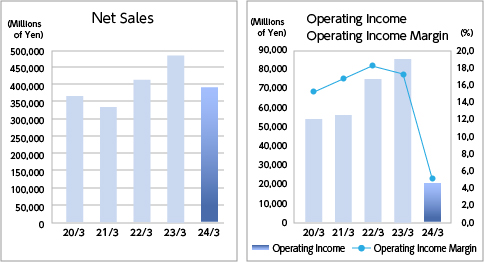
’╝łMillions of Yen’╝ē
| FY2020 | FY2021 | FY2022 | FY2023 | FY2024 | |
|---|---|---|---|---|---|
| Net Sales | 335,621 | 418,107 | 485,738 | 393,572 | 360,799 |
| Operating Income | 57,182 | 76,257 | 85,835 | 21,463 | 36,276 |
| Operating Income Margin (%) | 17.0% | 18.2% | 17.7% | 5.5% | 10.1% |
HCB: Healthcare Business Net sales, of total: 18%
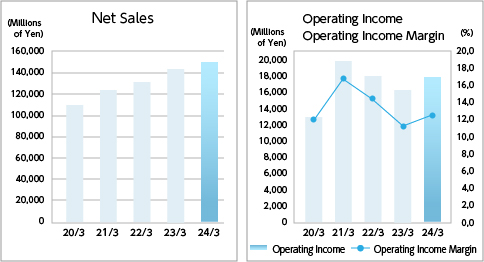
’╝łMillions of Yen’╝ē
| FY2020 | FY2021 | FY2022 | FY2023 | FY2024 | |
|---|---|---|---|---|---|
| Net Sales | 123,087 | 132,857 | 142,132 | 149,726 | 145,866 |
| Operating Income | 20,573 | 18,544 | 16,018 | 18,463 | 17,482 |
| Operating Income Margin (%) | 16.7% | 14.0% | 11.3% | 12.3% | 12.0%% |
SSB: Social Systems, Solutions & Service Business Net sales, of total: 18%
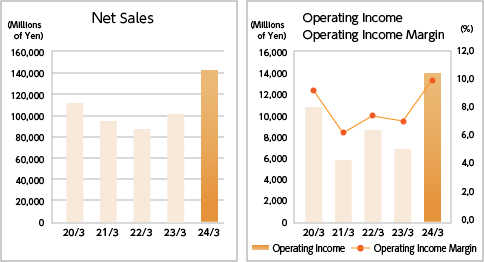
’╝łMillion of Yen’╝ē
| FY2020 | FY2021 | FY2022 | FY2023 | FY2024 | |
|---|---|---|---|---|---|
| Net Sales | 95,663 | 87,692 | 107,273 | 141,600 | 145,631 |
| Operating Income | 5,693 | 6,505 | 7,490 | 14,021 | 16,786 |
| Operating Income Margin (%) | 6.0% | 7.4% | 7.0% | 9.9% | 11.5% |
DMB: Device & Module Solutions Business Net sales, of total: 13%
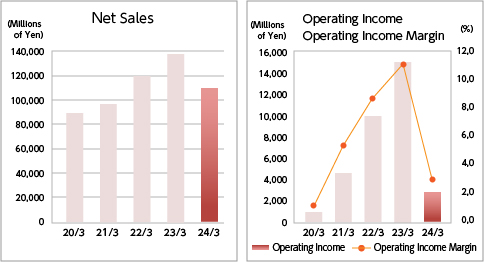
’╝łMillion of Yen’╝ē
| FY2020 | FY2021 | FY2022 | FY2023 | FY2024 | |
|---|---|---|---|---|---|
| Net Sales | 96,853 | 120,972 | 138,854 | 114,357 | 105,441 |
| Operating Income | 4,573 | 10,086 | 15,501 | 3,148 | 306 |
| Operating Income Margin (%) | 4.7% | 8.3% | 11.2% | 2.8% | 0.3% |
DSB: Data Solution Business Net sales, of total: 5%
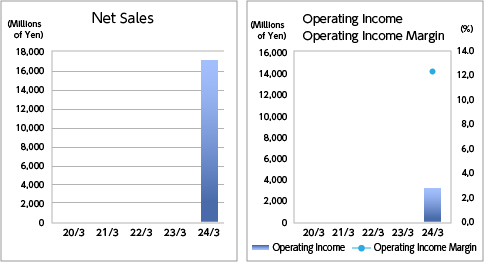
’╝łMillion of Yen’╝ē
| FY2020 | FY2021 | FY2022 | FY2023 | FY2024 | |
|---|---|---|---|---|---|
| Net Sales | - | - | - | 17,370 | 42,738 |
| Operating Income | - | - | - | 2,184 | 2,829 |
| Operating Income Margin (%) | - | - | - | 12.6% | 6.6% |

