


Realization of Multi-Person Respiratory Rate Measurement using Time-series Clustering with Millimeter-Wave Radar
- Radar
- Vital measurement
- Clustering
- Respiratory rate
- Time series
In various fields, including medical and health management, the demand for vital sensing technology is increasing because of the proliferation of related services. One of them, millimeter-wave radar, is seen as a promising technology that can simultaneously measure the vital signs of multiple people in a noncontact manner with the body. The detection of multiple targets in millimeter-wave radar is generally performed by clustering based on the intensity information of spatially separated reflected waves, which is generated as input from point clouds. By analyzing the reflected waves of each subject identified as a result, vital signs, such as respiration rate and heart rate, can be determined. However, millimeter-wave radar tends to be at a disadvantage in terms of angular resolution compared to optical sensors because of the constraint of the number of antennas, and there are cases where detection becomes difficult when the distance between the subjects to be measured is close.
In this paper, we propose a time-series clustering method to detect the respiration rate of multiple people based on the trend information generated by creating a respiration rate time trend map that captures the time variation of the respiration rate observed in space from the spatial reflection distribution of millimeter-wave radar. We conducted an experiment to simultaneously measure the respiration rate of multiple people and confirmed that we can detect the respiration rate even in situations where the distance between subjects is close or the respiration rate matches instantaneously, achieving a significant performance improvement of 93% compared to the detection rate of 51% of existing methods.
1. Introduction
With the recent development of information and communication technology, vital sensing technology has become advanced and diversified, undergoing application in a variety of different fields, including medicine and healthcare. Sensing methods divide broadly into contact and noncontact types. Contact-type methods obtain vital signs through a sensor worn in direct contact with the human body. Research and development are underway on sensors for measuring the various vital signs of heart rate, blood pressure, blood oxygen level, and body temperature. Following the advent of smaller, more power-efficient devices as alternatives to restrictive contact sensors with fixed-installation-type enclosures and cables that restrict free body movement, wearable sensor devices have become the driving force for the widening use of methods that enable long-time, non-restrictive measurement1-3). Wearable sensors are intended for on-body use. Their use for long-time measurement causes discomfort to the user and, in some cases, may cause problems in the aspects of safety and comfort, such as skin inflammation around the attachment site.
Noncontact vital sensing methods include those using cameras, radar, microphones, and the like. These methods require no on-body sensors and allow vital sign measurement without stress or discomfort from on-body devices3-6). Assuming a sleeping situation at home, more than one subject may be present within the measurement range, giving rise to the need for multi-person measurement. Using sensors able to obtain spatial information of the range and azimuth of cameras or radar devices will enable the simultaneous acquisition of the vital signs of multiple subjects within the measurement range.
Such sensors are available in more than one method and have practical challenges. For example, camera-based methods cause concerns about the privacy leakage risk of sensitive information, such as personally identifiable facial images, from subjects’ photographed data7). Microphone array-based methods can only be applied to limited situations because of the influences of disturbances, such as noise pollution.
By contrast, radar-based methods attract attention as high-precision vital information acquisition technology free from such privacy concerns. Millimeter-wave radar uses radio waves with a wavelength of several millimeters, which penetrate clothes or comforters to detect the movements of human body surfaces, thereby enabling the measurement of vital signs, such as respiratory and heart rates8-10).
Respiratory waveforms representing respiration-induced body surface microdisplacements or respiration-related information calculated therefrom, such as respiratory rates, serve as effective means for estimating sleep quality and health conditions.
Using a millimeter-wave radar system equipped with multiple antenna elements, we can estimate the reflected wave’s incoming direction to obtain the azimuth and range of the measurement target. Radar azimuth resolution tends to improve proportionally to the number of antennas. Typically, azimuth resolution falls within several to several tens of degrees. A radar-based sensor has more reasonable feasibility but lower azimuth resolution than a light detection and ranging (LiDAR) sensor, a type of range sensor for optical systems11-13). Therefore, multiple persons’ respiratory waveforms or respiratory rates are hard to detect based on spatial information where subjects are too closely spaced or distant. Currently commercially available radar-based sensors are intended to take measurements from a single subject positioned at the shortest distance and do not support multi-person measurement.
In this paper, we assume a scene of family members sleeping together at home and propose a multi-person respiratory rate detection method based on the respiratory rate trend information generated to capture the variation over time in the respiratory rate from measurement signals of millimeter-wave radar. Section 2 describes the principle of respiratory rate measurement using radar. Section 3 discusses the challenge in multi-person measurement using respiratory rate data extracted from radar signals. Section 4 presents and discusses our proposed method. Section 5 presents the results of obtaining respiratory rate time trend information, using our proposed method, from the radar signals for simultaneous multi-person measurement using millimeter-wave radar.
2. Principle of respiratory rate measurement using millimeter-wave radar
2.1 Range/azimuth measurement
Body-surface reflected radio waves can occur simultaneously on the surfaces of various human body parts. Hence, multiple reflection signals are simultaneously received from one subject. Moreover, where there are multiple subjects, reflection signals are simultaneously received from multiple body parts of their bodies. Multiple reflected waves simultaneously received in this way must be spatially separated.
The radar range resolution dres is dependent on the transmission signal bandwidth and expressed as follows:
where c is the speed of light and B is the bandwidth.
Millimeter-wave radar achieves high-range resolution by broadband signal transmission/reception using the frequency-modulated continuous wave (FMCW) radar or pulse method. Besides, incoming direction estimation using an array antenna allows the estimation of the azimuth of the incoming reflected wave. When a reflected wave arrives from a direction θ to an antenna away at a distance d, the signal phase difference between antennas is given as d sinθ, whereby the incoming direction can be estimated using the formula below:
where λ denotes the wavelength of the radio wave.
In array antenna-equipped radar, the temporally subsequent antenna reception signal shows a phase shift of with respect to the temporally preceding antenna signal. Each antenna’s phase exhibits a linear progression relative to the antenna position. Therefore, the incoming direction θ can be estimated from the phase variation of each antenna13).
Methods widely used to process such range/azimuth measurements are those based on the fast Fourier transform (FFT).
The calculation results are complex signal data with range and azimuth bins. Their visualized form as a map is called a radar image.
2.2 Extraction of vital information
Fig. 1(a) shows a typical example of the amplitude data from a radar image of three subjects under simultaneous measurement. The three subjects were arranged side-by-side in the azimuth direction near the 20th range bin. The amplitude information in a range radar image corresponds to the reception intensity of the received reflected wave, thereby enabling the determination of its reflection intensity, which depends on the presence/absence and shape/material of the reflector at the corresponding range/azimuth. However, caution should be taken against interference effects that may occur when highly reflective targets exist in the surroundings or when multiple targets exist nearby.
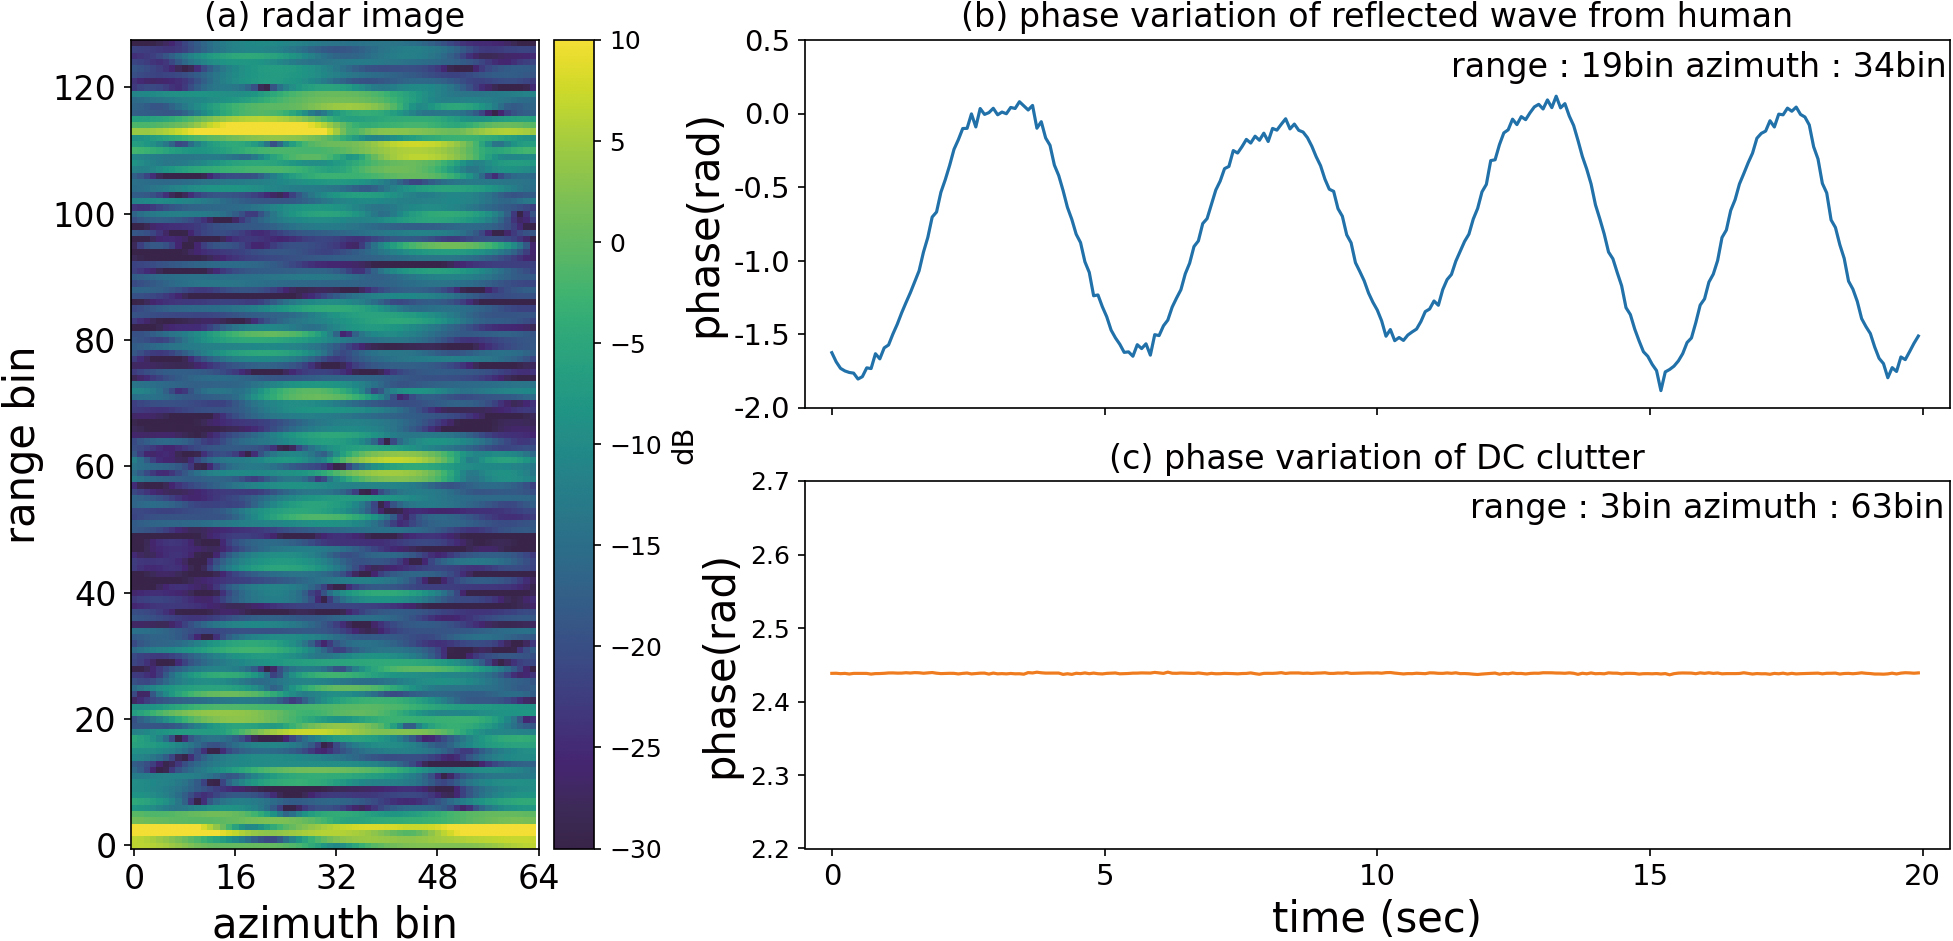
Figs. 1(b) and (c) show the time-series change in the phase component of a reflected wave from a human body surface and an unwanted reflected wave (clutter), respectively. Phase information contains the information on the distance to the target. No variation over time occurs with static clutter components, such as stationary objects or antenna leakage. By contrast, when the reflector is a human body, its motion causes a corresponding change in phase over time. Breathing- or heartbeat-induced body surface oscillations are particularly cyclic, and their corresponding complex signal components are known to draw an arc-shaped locus on the complex plane13). This aspect can be used for waveform component extraction.
As explained above, the amplitude information in a radar image serves to determine the presence/absence and locations of reflectors whereby a phase waveform, the body surface movement information associated with the subject’s body motion, is extracted from the time-series change in phase information, enabling the estimation of vital signs, such as respiratory and heart rates from the phase waveform.
2.3 Signal processing flow
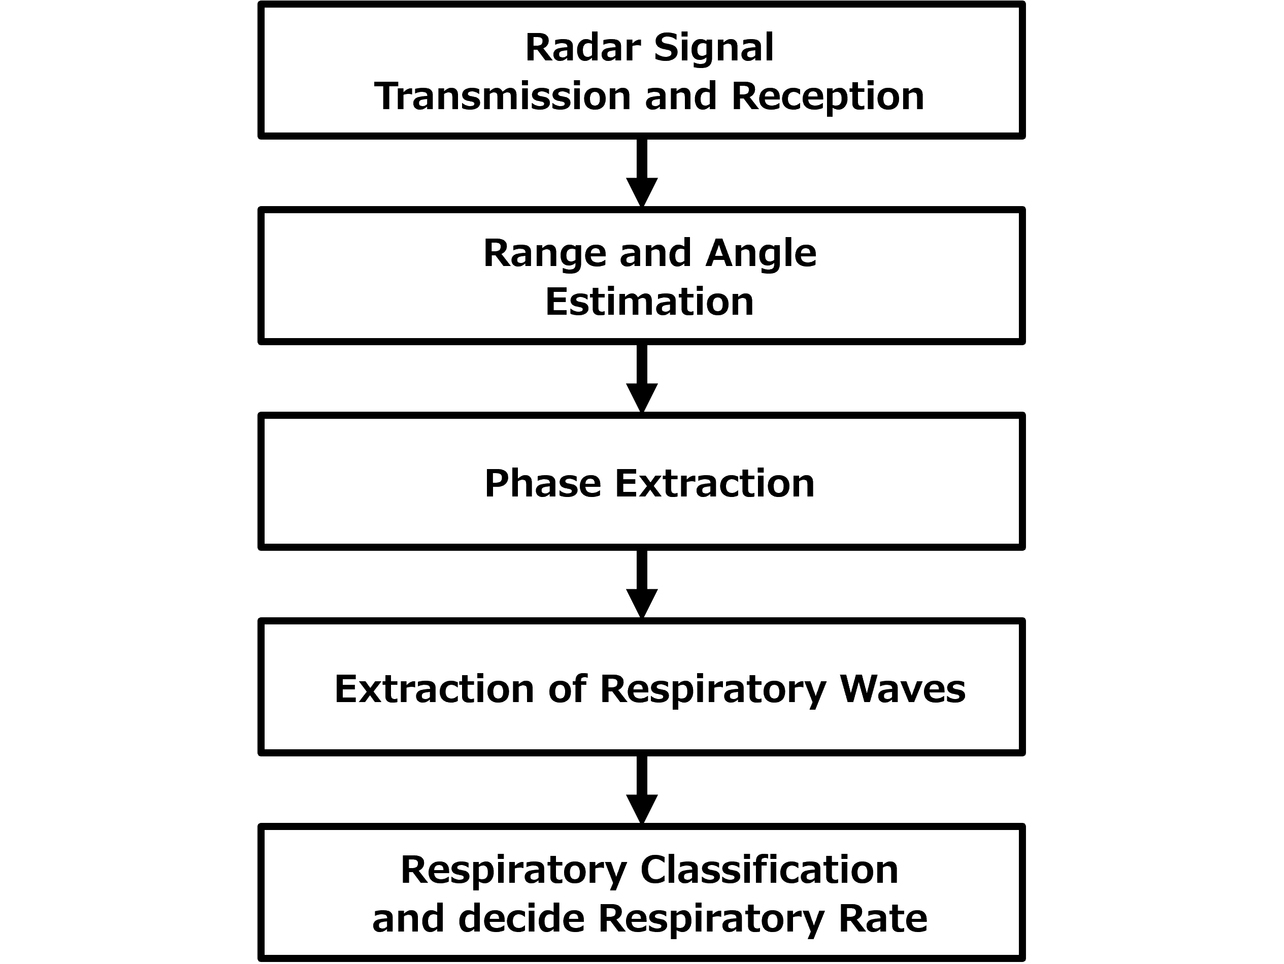
Fig. 2 shows the process flow of multi-person respiratory rate measurement using radar. The first step is radar signal transmission and reception. For the baseband signal with the received wave multiplied by the transmission signal reference wave, range/azimuth estimation is performed to produce a radar image. This radar signal transmission and reception and the range/azimuth estimation process are cyclically performed to obtain the radar image’s time-series data equivalent to the analysis intervals for which the respiratory rate is to be calculated. Next, for the time-series data of each bin obtained, static clutter estimation and removal are performed to obtain the phase waveform information. Then, whether a respiratory component is contained in the waveforms obtained is determined to extract a respiratory waveform group. The respiratory waveform group obtained is based on the reflected signals from different body parts and is hence observable over multiple bins. Moreover, where there are multiple subjects, their respiratory waveforms are mixed. Each subject’s respiratory waveform must be extracted from the respiratory waveform group to measure their respirations. Probable methods divide into one that classifies or separates waveforms proper based on their correlation or independence9) and one that converts the waveform groups into one- or multidimensional feature quantities for subsequent classification10). The method that uses waveforms proper has the drawback of increased computational complexity. Meanwhile, the feature quantity-based method is challenged by the inability to perform correct classification without using appropriate feature quantities as explained below. Our study herein adopted the feature quantity-based method.
The respiratory rate is calculated from each waveform to obtain a map linked with the respiratory rates calculated for bins containing extracted respiratory waveforms (hereinafter called a respiratory rate extraction map). Then, the coordinates or respiratory rate information in the respiratory rate extraction map obtained is used as the input to clustering to classify each bin by the corresponding subject. Each subject’s respiratory rate and coordinates information is estimated from the map information of each classified cluster.
3. Challenges in multi-person respiratory rate measurement
3.1 Challenge in cases with the use of spatial information
Fig. 3 shows typical results of clustering performed using the point group data with azimuth/range information as the input. Note that the classification results are represented as color-coded bins.
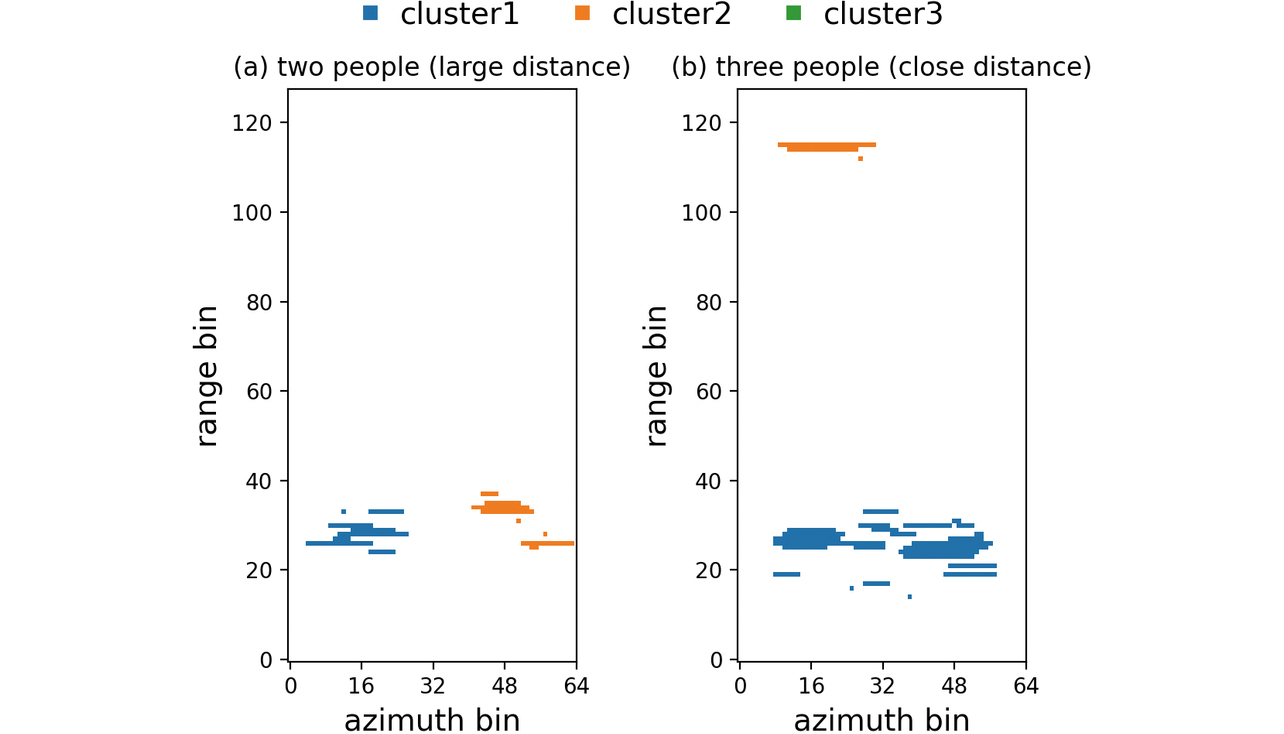
Fig. 3(a) shows the results for a situation with two subjects positioned near the 20th range bin. Point groups are extracted for the coordinates corresponding to each subject’s position. The point groups are sufficiently separated on the coordinates to be correctly classified into the clusters corresponding to the two subjects.
Fig. 3(b) shows typical results for a situation with three subjects present near the 20th range bin. As for two subjects, point groups are extracted for the coordinates corresponding to each subject’s position. However, the point groups are determined as two clusters.
In this case, the point groups extracted for the three subjects are hard to classify because of the proximity between the spatial coordinates. As a result, only one cluster is obtained near the 20th range bin despite the presence of three subjects. Point groups are also extracted around the distant 115th range bin and determined as another cluster. This cluster is a false echo caused by the multipath effect via the stationary objects in the surroundings.
Where spatial coordinate information is utilized, as explained above, point groups are combined and incorrectly classified because of the insufficient spacing between subjects in radar image. Moreover, the false echo caused by the multipath effect is determined as another cluster. As a result, problems arise, such as extracting no subjects’ vital signs supposed to be extracted or more vital signs than the number of subjects involved.
3.2 Challenge in cases with the use of respiratory rate information
One of the possible solutions to the challenge in cases with spatial coordinate information used as the input is classification based on alternative input information. This subsection presents typical results of clustering with respiratory rate data used as the input and the challenge that remained.
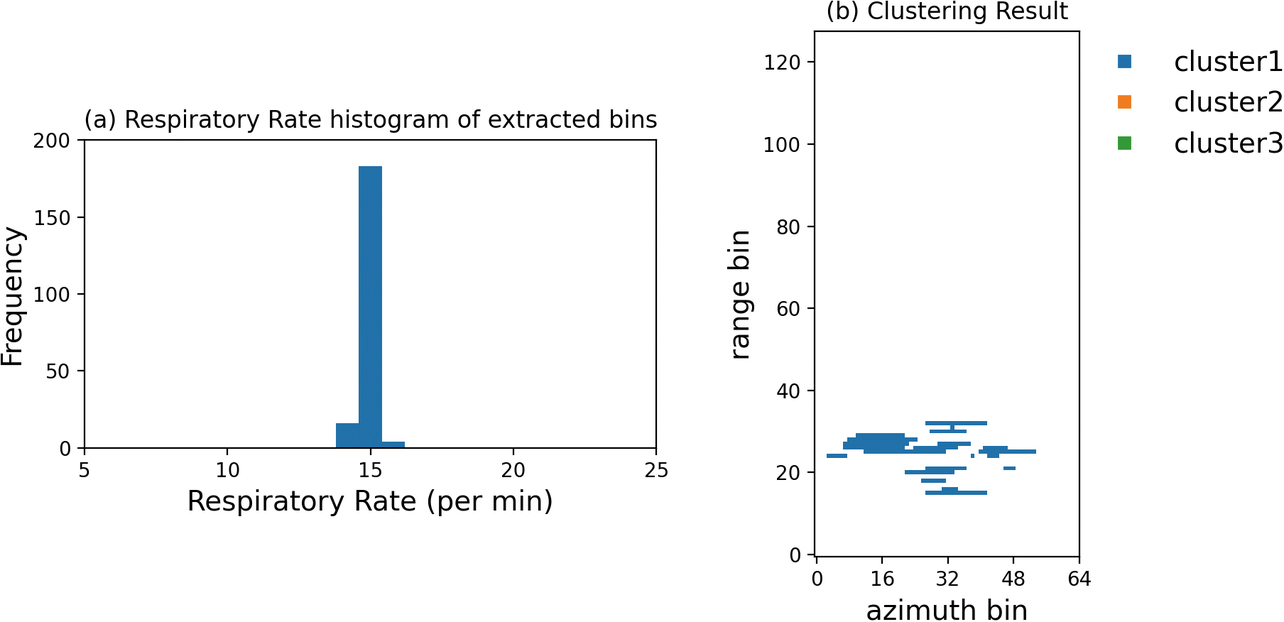
Let us first show a case where clustering with respiratory rate data used as the input solved the challenge in clustering using spatial coordinate information. Fig. 4 shows the distribution of respiratory rates per minute calculated from the waveforms in each bin containing the extracted respiratory waveforms of the three subjects (Fig. 4(a)) and the results of clustering with respiratory rate data used as the input (Fig. 4 (b)). The clustering input data used here are the one-dimensional data converted from the respiratory rates in each bin on the extraction map. As shown in Fig. 4(a), the map consists of three separate respiratory rate bar charts. Fig. 4(b) reveals that point groups corresponding to the subjects’ positions are classified into three clusters. In addition, the distant false echo components are shown classified into the same clusters near those near the real echoes rather than different clusters. In other words, clustering with respiratory rate data used as the input led to successfully classifying the data in the space into the same number of clusters as that of respiratory rate clusters.
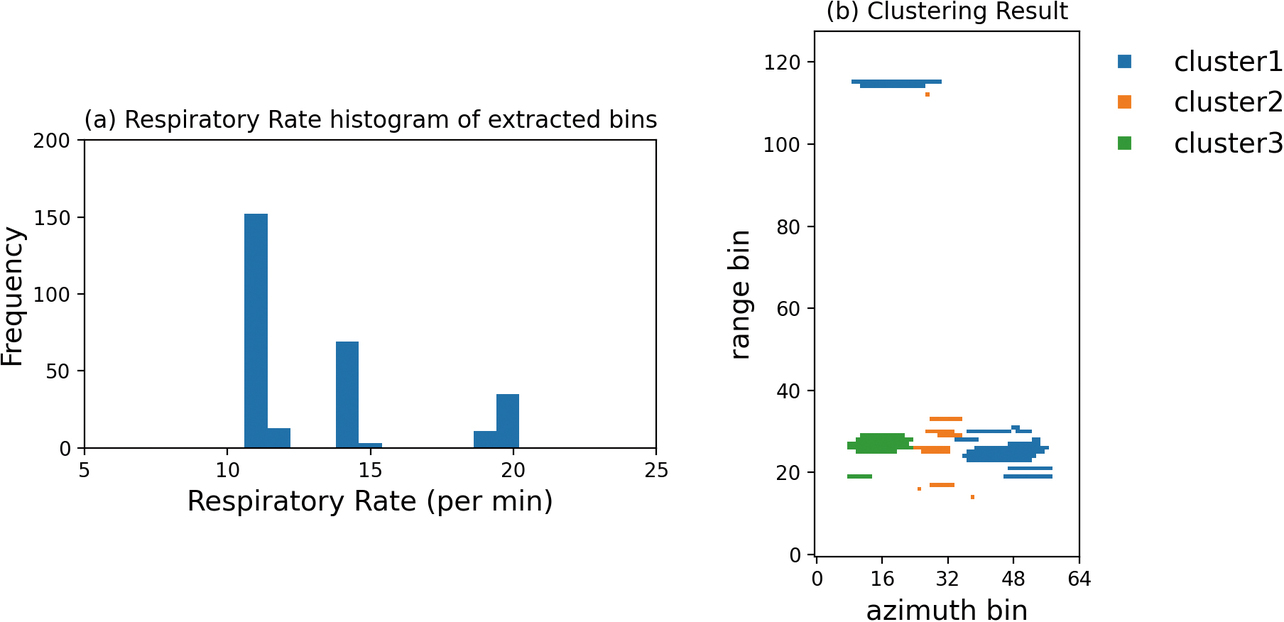
Fig. 5 shows additional typical results for the three subjects. As shown in Fig. 5(a), their respiratory rate bar charts nearly overlap, unlike in the successful case. Data were obtained under a condition with the subjects positioned almost the same as in the case in Fig. 4. As the result of performing clustering on these data, point groups corresponding to the subjects’ positions are determined as a single cluster despite the presence of three persons, as shown in Fig. 5(b).
In cases with the respiratory rate data used as the input as above, classification can be performed unaffected by subjects’ relative positions or false echoes. On the other hand, similar respiratory rates are difficult to classify, posing another challenge.
4. Clustering method using trend information
4.1 Variation over time in the respiratory rate during natural breathing
To consider a method to solve the challenges presented in Section 3, we examined whether temporal trends exist in human respiratory rates. Fig. 6 shows the time trends of natural breathing at the respiratory rate measured using belt-type sensors (hereinafter “respiration belts”) for three subjects. For the respiratory rate, a single analysis interval (hereinafter a “slot”) is defined as 20 seconds. Waveforms measured using respiration belts were analytically calculated. The x-axis indicates the index number of slots for which respiratory rate calculations were made.
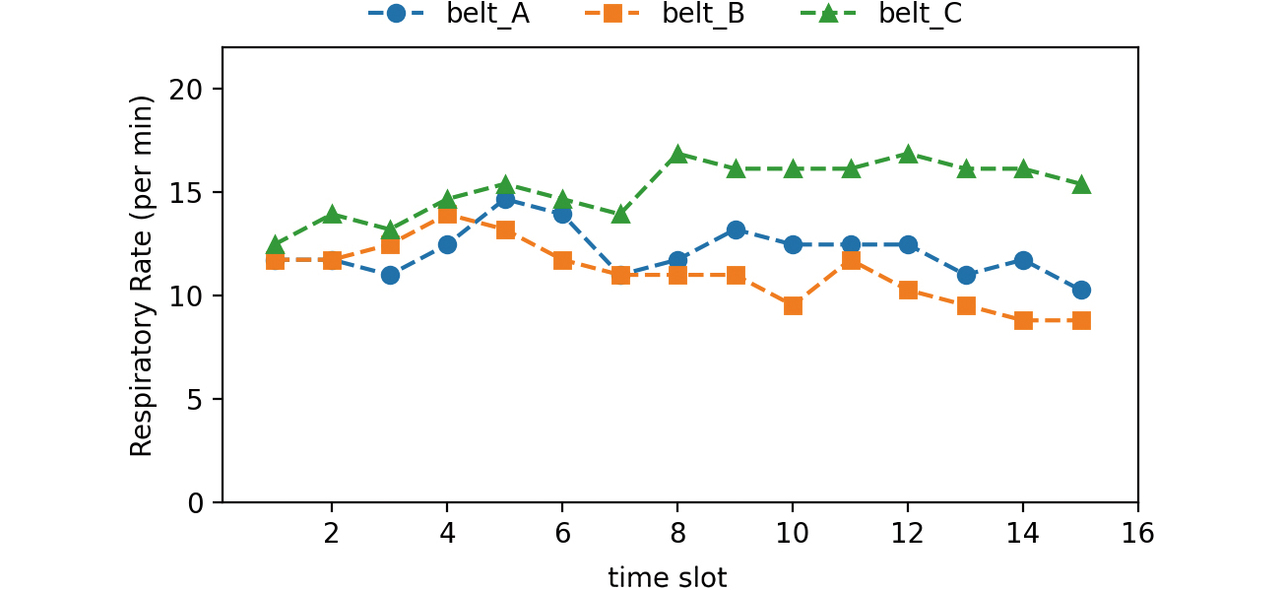
Each subject’s respiratory rate varies slot by slot, revealing that their time trends differ.
Therefore, even if some slots show respiratory rate overlaps between subjects, a look at the time-series changes will allow the separation of the respiratory rate of each subject from the others’ rates.
4.2 Clustering using time-series information
As the separation method based on respiratory rate trend information shown in Subsection 4.1, we devised a time-series clustering method that uses a respiratory rate extraction map corresponding to multiple analysis slots to generate time-series data and classify the respiratory rate of each slot.
Fig. 7 shows the flow of our devised clustering method using time-series information. This flow starts with the cyclic process of analyzing respiratory waveform analysis interval data and producing a respiratory rate extraction map to accumulate respiratory rate extraction maps calculated for each time slot. The next step is to convert the accumulated data to produce a time trend map that contains each bin’s respiratory rate, time slot, and bin-index information.
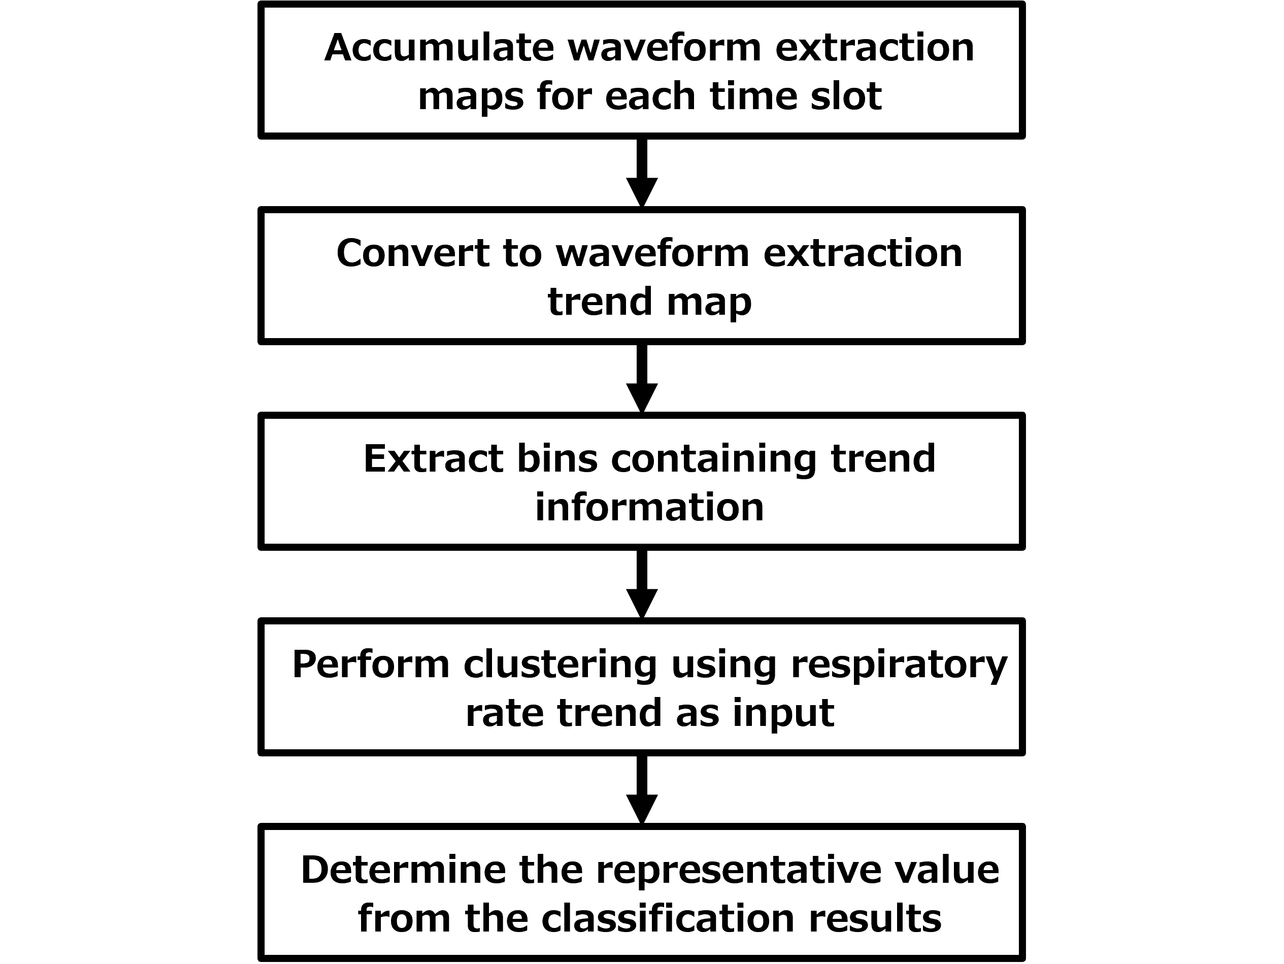
The third step is to select and extract only bins containing respiratory rates extracted from more than a certain number of time slots on the time trend map. The purpose is to select the bins containing a specific subject’s trend information. The cause of unselected bins may be that the reflected wave containing information on the subject’s respiration-induced body motion was not observed or that it was not stably observed because of such factors as the proximity to the boundaries between the subjects.
The fourth step is to perform time-series clustering with the selected time trend information used as two-dimensional input data. The final step is to determine each cluster’s respiratory rate per slot based on the results of the clustering to produce the respiratory rate trend output for each subject.
5. Evaluation
5.1 Experimental environment
We performed a respiratory rate measurement experiment on multiple subjects to evaluate the performance of respiratory rate measurement using our proposed method. For data acquisition, we used an FMCW millimeter-wave radar system with a center frequency of 62 GHz and a frequency bandwidth of 3.3 GHz. The antenna used has two transmission and three reception elements, thereby forming a half-wavelength, six-element, equally spaced linear array antenna in a multiple-input multiple-output (MIMO) configuration. The sampling cycle per radar image to be obtained was set to 80 milliseconds. The slot time duration for respiratory rate calculation was set to 20 seconds (number of sampling points = 250 points).
Fig. 8 shows the relative arrangement of the radar system and subjects in the experiment. Assuming a scene of a family sleeping together at home, we let three subjects (A, B, and C) lie face-up, side by side, shoulder to shoulder, spaced 0.45 meters apart. The radar system was installed on the head side of these subjects, right in front of the subject in the middle with a horizontal distance of 0.5 meters from the subject’s chest and a vertical distance of 0.3 meters from the subject’s back. A respiration belt was worn around the trunk of each subject to ensure that the reference waveform would be obtained simultaneously with measurement with radar.
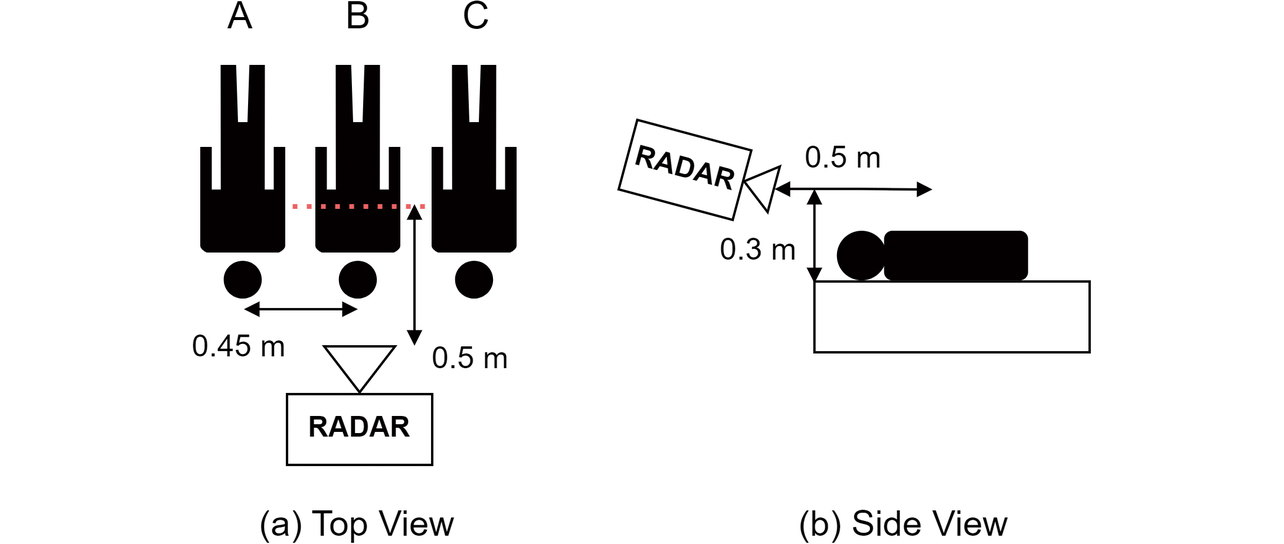
The respiration belts were set to a sampling cycle of 10 milliseconds to perform measurements in sync with the radar and calculate the respiratory rate in a common time slot for comparison with the radar’s value. Using the above experimental arrangement, we measured the respiratory rate of each subject for 600 seconds, equivalent to 30 time slots. We compared the respiration belt method and our proposed method regarding the measured results for respiratory rate time trends.
5.2 Time trend map
Fig. 9(a) shows a time trend map generated from accumulated respiratory rate maps. Fig. 9(b) shows the time trend map consisting only of bins containing respiratory waveforms extracted from over 20 slots. The y-axis indicates the time slot index number while the x-axis denotes the bin index number. The bin index number is obtained by converting azimuth and range coordinates into one dimension and sorting them in ascending order. The colors on the heat map below represent calculated respiratory rates. A bin with no extracted respiratory waveforms contains “0,” and the heat map represents many bins as such. With each subject present at a specific location, respiratory waveforms were extracted in specific bins. In these bins, respiratory waveforms were extracted over many time slots.
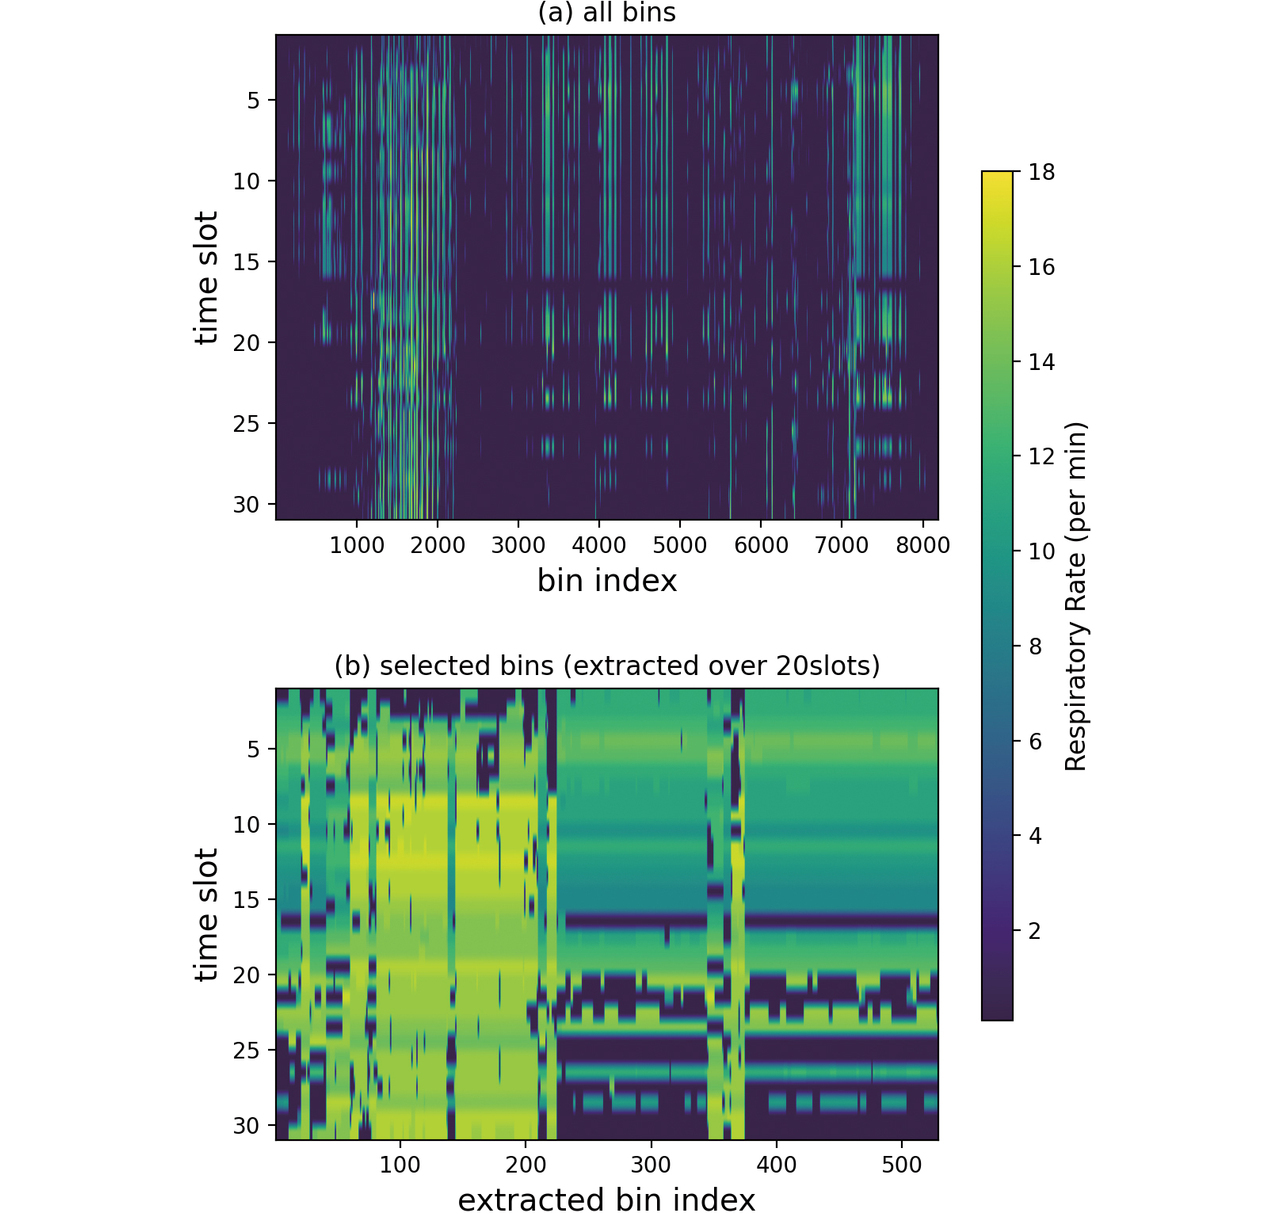
Bins containing respiratory waveforms extracted from over 20 slots accounted for 6.5 percent of the total. A look at extracted bins-only time trends reveals that bin index numbers around 100, for example, exhibit a different color gradation than those around 300, indicating that several different changes exist in the time slot direction. These changes can be interpreted as representing the difference in trend between the subjects.
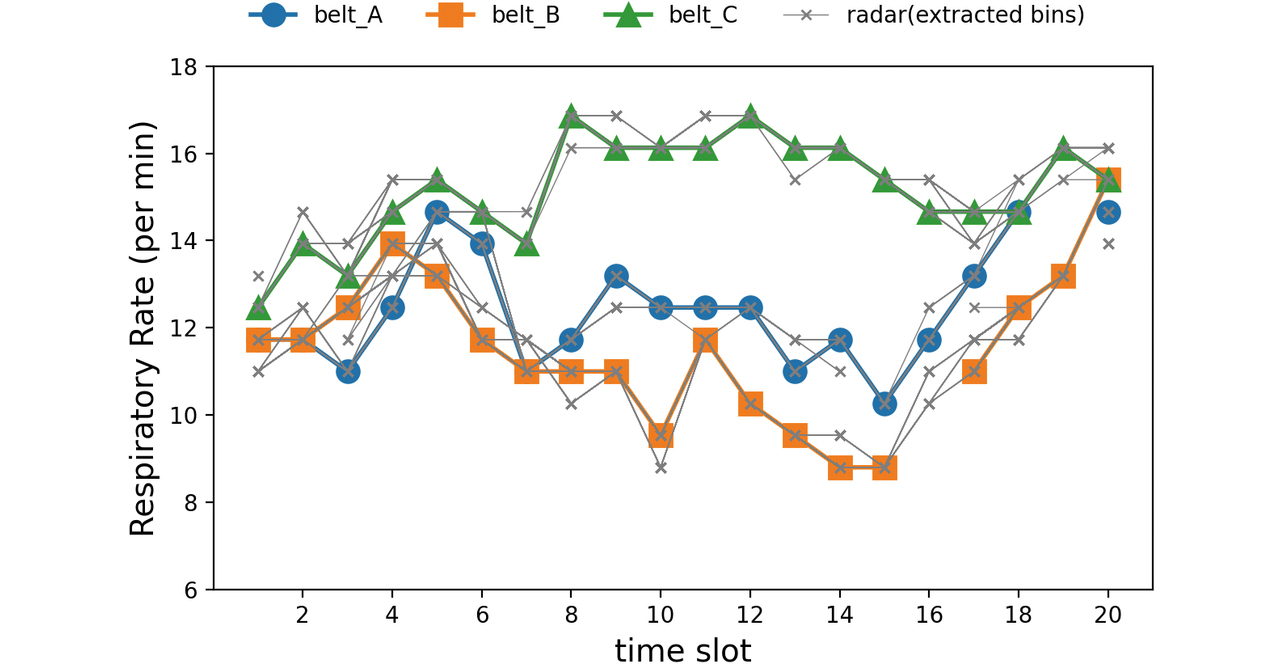
Fig. 10 shows the comparison results between the respiratory rate per slot of all extracted bins and those calculated from the respiration belt waveforms. The figure seemingly shows small numbers of bins because of the overlaps between results with similar values. The results for most bins show similar values to the respiration belt-measured results for one of the subjects. The results of the same bin are connected with a line, and the slot-to-slot change within the same bin also follows the patterns exhibited by the corresponding respiration belt-measured results for one of the subjects, indicating that each bin’s results contain the time trend information on a specific subject.
5.3 Respiratory rate measurement results
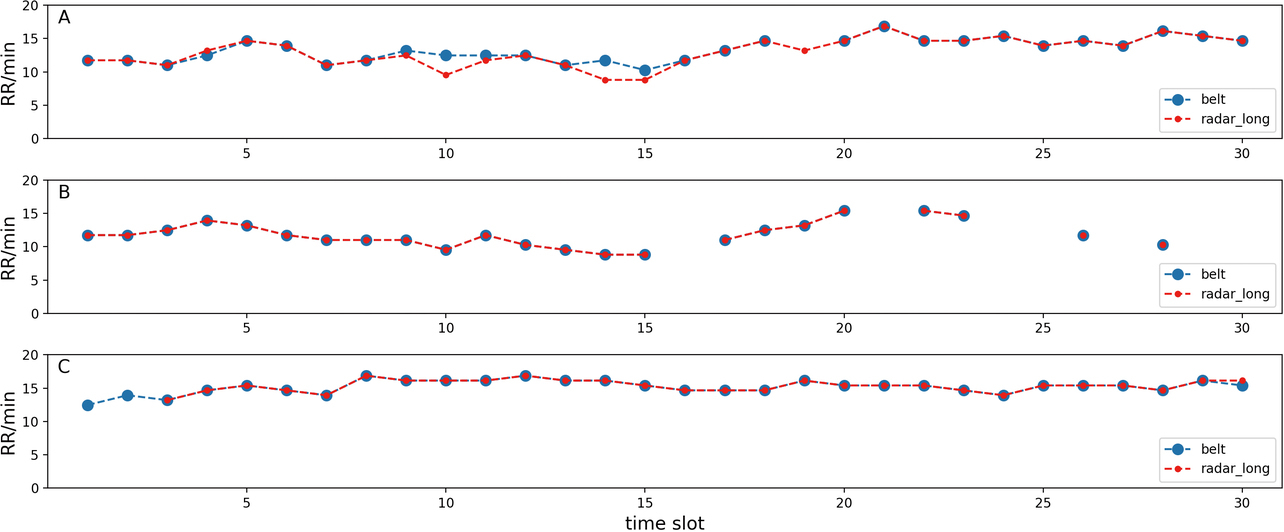
Fig. 11 compares the results of the respiratory rate trend estimation by slot-by-slot clustering with the respiration belt-measured results. Meanwhile, Fig. 12 compares the results of the respiratory rate per cluster trend estimation by time-series clustering, our proposed method with the respiration belt-measured results. For the slot-by-slot clustering method, we set the respiratory rate per bin as the input. The correspondence between the radar- and respiration belt-measured results was determined based on the relative position of each estimated cluster.
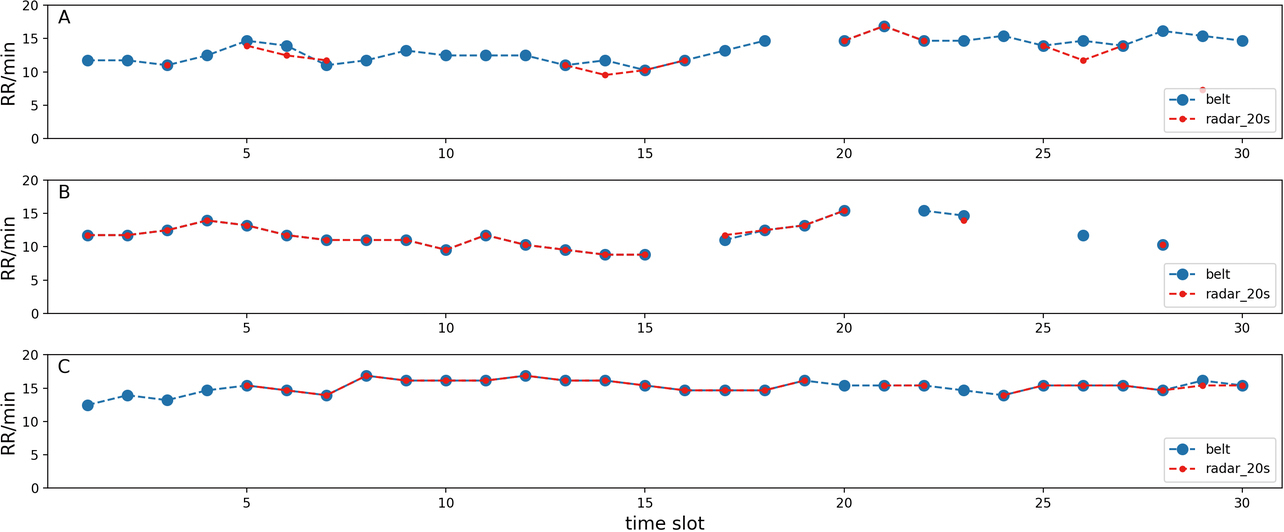
The slot-by-slot clustering method only estimated the respiratory rates of two subjects for many slots; it estimated the respiratory rates of three subjects for only six slots out of 30. By contrast, our proposed method achieved successful estimation for 21 slots out of 30, showing a significant improvement in multi-person respiratory rate estimation performance.
The results for our proposed method reveal that as far as Subjects A and B were concerned, our proposed method achieved successful respiratory rate measurement for any of the slots for which the respiration belts allowed successful respiratory rate estimation. In the case of Subject B, the respiration belt failed to produce the respiratory rate output for many slots. The cause was that the subject’s respiratory waveform was found too irregular to be useful for respiratory rate determination. The same was the case with the radar-measured results: no respiratory rate output was produced because none of the waveforms available were found useful for respiratory rate calculation.
In the case of Subject C, our proposed method failed to produce the respiratory rate output for some slots, for which the respiration belt produced the respiratory rate output. The probable cause was that for the slots concerned, no respiratory waveform corresponding to Subject C was extracted from the radar signal. Failure to extract the target subjects’ respiratory waveforms from the corresponding radar signals occurred probably because of such factors as the reduced intensity of the reflection signal from each target subject as a result of visually indeterminable degrees of changes in the relative position between the radar sensor and the target subject or that between the target subjects or a reduced signal-noise ratio (S/N ratio) due to phasing effects.
Table 1 shows the number of extraction slots per subject and the detection rate for each method. The detection rate is defined as the ratio of the number of slots with the respiratory rate successfully measured by the respiration belt to that with the waveform successfully extracted using radar. The lowest detection rate by the slot-by-slot clustering method was 51% (Subject A). By contrast, the lowest detection rate by our proposed method was 93% (Subject C), indicating a significant improvement.
| Algorithm | Item | Subject A | Subject B | Subject C |
|---|---|---|---|---|
| Slot-by-slot | # of slots | 15 | 21 | 24 |
| Detection rate | 51% | 91% | 80% | |
| Time-series | # of slots | 29 | 23 | 28 |
| Detection rate | 100% | 100% | 93% |
6. Conclusions
When radar is used to take measurements from multiple targets in space, the challenge is to separate the signal for each target because of a lower azimuth resolution than achievable with an alternative method such as a camera. This paper proposed a time-series clustering method intended for multi-person respiratory rate measurement by millimeter-wave radar; this method uses the respiratory rate time trend map generated based on the measurement signal as the input. We performed a verification experiment on three subjects, confirming a significant improvement in the detection rate compared with a conventional method.
The study results presented above only cover a single case of verification under limited conditions and should be further examined with greater numbers of subjects and conditions. Our study herein, in particular, assumed that the subjects were at rest. However, during sleep at home, more complicated situations would occur, such as sleeping position changes and other body motions or indoor movements of family members and others. Our proposed method should also be verified for adaptability to such practically possible situations.
We expect our proposed method to extend its applicability beyond multi-person respiratory rate measurement to multi-person vital sign measurement and eventually to signal separation between multiple measurement targets other than people. Moving forward, we will consider radar-based vital sign measurement and other app deployments based on the abovementioned challenge.
References
- 1)
- K. Nagamine et al., “Wearable Sensing Technology: Achievements So Far and Challenges Ahead,” (in Japanese), Chem. Educ., vol. 68, no. 11, pp. 490-493, 2020.
- 2)
- I. Yamada, “Physiological Information Sensing Technology Aimed at Preventive Healthcare,” (in Japanese), IEICE Eng. Sci. Soc., Fundam. Rev., vol. 12, no. 1, pp. 30-37, 2018.
- 3)
- T. Tamura, “Wearable and Non-contact Sensors and Their Medical Applications,” (in Japanese), Japanese J. Med. Instrum., vol. 90, no. 1, pp. 11-23, 2020.
- 4)
- T. Tezuka and T. Nakamura, “Contactless Vital Sensing Technology Using Video Imaging and Its Applications,” (in Japanese), Japanese J. Biofeedback Res., vol. 45, no. 1, pp. 3-9, 2018.
- 5)
- T. Hyuga et al., “Driver Status Estimation with Time-series Deep Learning,” (in Japanese), OMRON TECHNICS, vol. 50, no. 1, pp. 31-36, 2018.
- 6)
- E. Dafna et al., “Sleep staging using nocturnal sound analysis,” Sci. Rep., vol. 8, no. 1, pp. 1-14, 2018.
- 7)
- R. Watanabe, “Face Recognition Technology-Based Camera Image Utilization and Applications and Personal Information and Privacy Protection,” (in Japanese), J. Inst. Image Inf. Telev. Engineers, vol. 71, no. 11, pp. 811-818, 2017.
- 8)
- G. Paterniani et al., “Radar-Based Monitoring of Vital Signs: A Tutorial Overview,” in Proc. IEEE, 2023, vol. 111, no. 3, pp. 277-317.
- 9)
- S. Yue et al., “Extracting Multi-Person Respiration from Entangled RF Signals,” PACM IMWUT, vol. 2, no. 2, pp. 1-22, 2018.
- 10)
- T. Koda et al., “Noncontact Respiratory Measurement for Multiple People at Arbitrary Locations Using Array Radar and Respiratory-Space Clustering,” IEEE Access, vol. 9, pp. 106895-106906, 2021.
- 11)
- H. Ozawa et al., “Improving Direction Estimation Accuracy of Millimeter-Wave Radar by Suppressing Unnecessary Radiation From Transmission Lines,” (in Japanese), OMRON TECHNICS, vol. 55, no. 1, pp. 116-122, 2023.
- 12)
- S. Ohashi et al., “3D Imaging of Outdoor Human With Millimeter Wave Radar Using Extended Array Processing,” (in Japanese), OMRON TECHNICS, vol. 54, no. 1, p. 92, 2022.
- 13)
- T. Sakamoto, Wireless Human Body Sensing, (in Japanese), Ohmsha, 2023.
The names of products in the text may be the trademarks of each company.