


Virtual Buffer Management (VBM) for Effective Visibility into Highly Variable Development and Reduce the Need to Change Plans
- Project Management
- Buffer Management
- CCPM
- Uncertainty in projects
- R&D
Critical chain project management (CCPM) is one of the representative project management methods characterized by completing projects efficiently and on time through buffer management. However, when applying CCPM to research and development (R&D) projects with high variability and uncertainty, there are challenges, such as difficulty in grasping the situation because of large buffer fluctuations and the need for extensive effort in plan adjustments. This paper proposes virtual buffer management (VBM) as a project management mechanism that can solve these challenges and implement effective buffer management even in R&D projects. Unlike CCPM, which calculates project buffers based on tasks designated in the critical chain, VBM calculates buffers based on all tasks in the project. This improves project status visualization and enables plan adjustments with less effort than CCPM. VBM can be considered a viable alternative in projects where the use of CCPM is challenging. This paper will explain the VBM mechanism in detail.
1. Introduction
In the current VUCA age, the business environment is increasingly competitive with low future predictability. Hence, research and development (R&D) projects for producing innovative deliverables are expected to proceed faster than ever before toward outcome creation. For an R&D project to proceed at an accelerated speed, it is crucial to identify problems in the earlier stages and make early mid-course corrections. Meeting this purpose requires project management.
Accordingly, we paid attention to critical chain project management (CCPM),1) one of the typical project management methods. CCPM uses a trend chart (Fig. 1) with the X-axis for the project progress rate and the Y-axis for the buffer consumption rate to plot the daily progress and buffer consumption rates. The trend chart (Fig. 1) consists of three color-coded levels to permit one-glance checks of the status of the project: “Safe (green)” for when the amount of buffer consumed is small relative to the progress rate and the planned number of days is sufficient with a safety margin, “Caution (Yellow)” for when the planned number of days is narrowly sufficient, and “Danger (Red)” for when the planned number of days is expected to be exceeded. This method is made possible by a process that aggregates the buffers contained in individual tasks into the last portion of the project to manage it as a single project buffer. This process is called buffer management.2,3)
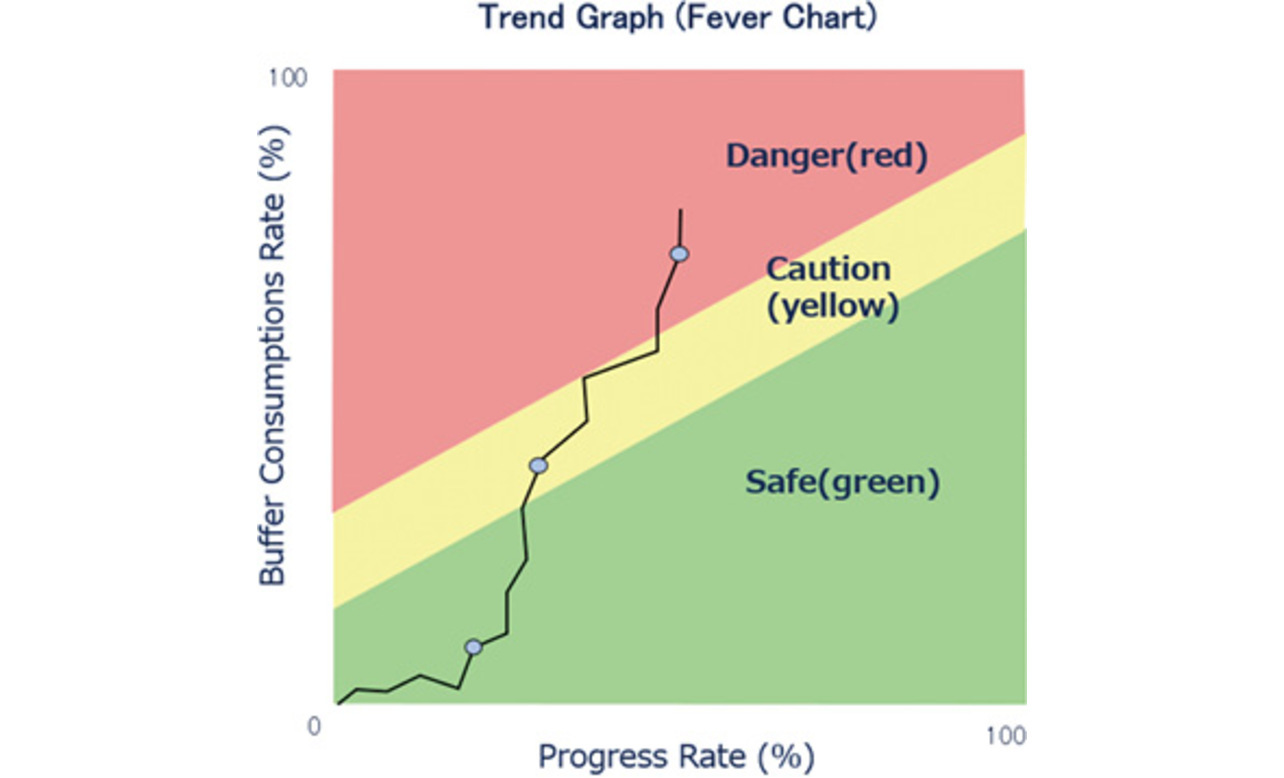
An ideal trend chart shows a project making progress while consuming an adequate amount of buffer. Basically, this graph extends from the bottom left towards the top right to indicate the amount of buffer consumed over the work progress. At the bottom left corner point, the progress and buffer consumption rates are both 0%, representing the time the project started. At the top right corner point, the progress and buffer consumption rates are both 100%, indicating as-planned completion.
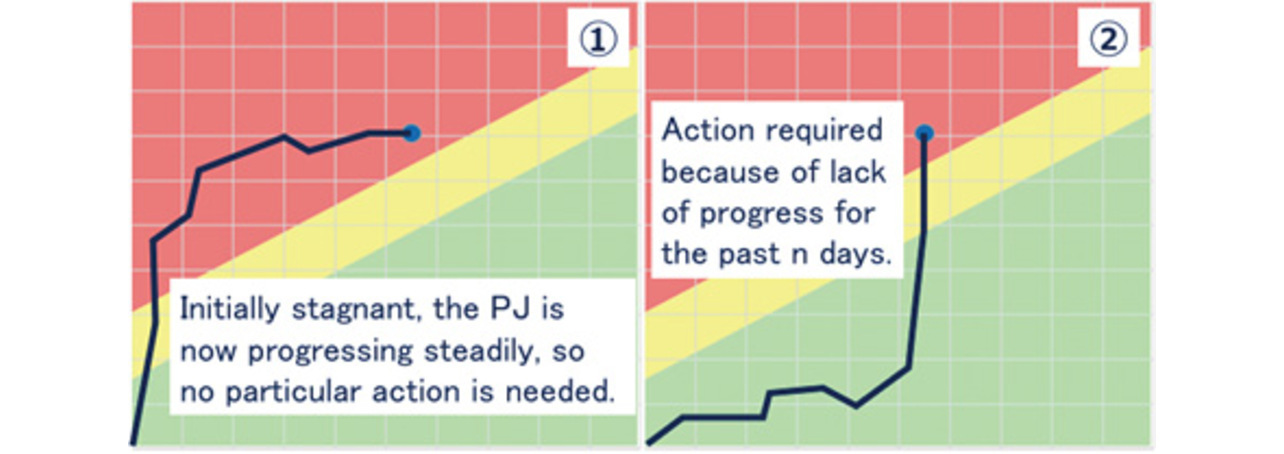
With a trend chart, it is also important to judge the situation based not only on the progress and buffer consumption rates as of the current date but also on those from past history. For example, even with the same progress rate of 55% and a buffer consumption rate of 70%, a different management judgment may be required depending on past trends (Fig. 2).
CCPM has been extensively used to manage our product development projects. We pursued its introduction to exploit its effectiveness for R&D projects. However, for projects with extremely high variability and uncertainty, we encountered multiple cases where the trend chart showed a complicated entanglement of the folded line with plotted points, making it impossible to grasp the exact status (Fig. 3).
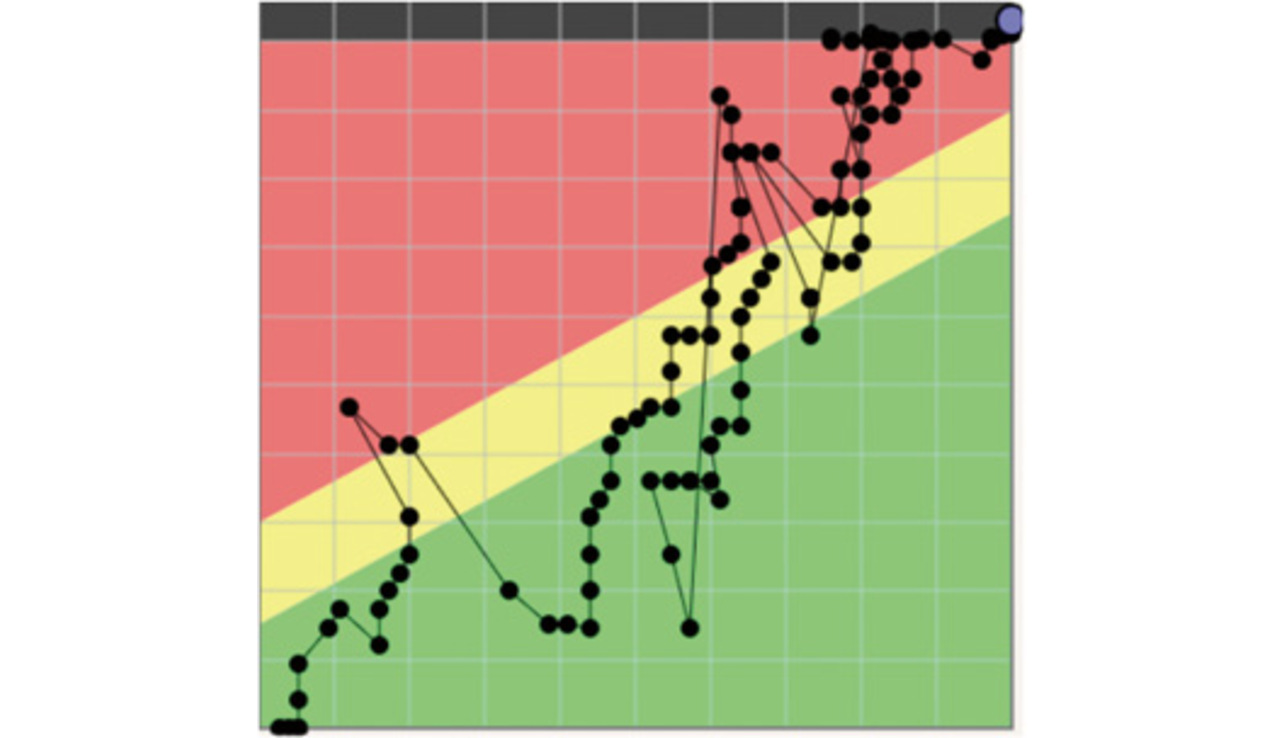
This phenomenon was not observed with product development projects. In such cases, the trend chart failed to provide management judgment criteria. Hence, for such R&D projects, which are impossible to apply CCPM to, we devised virtual buffer management (VBM) as an alternative method to enable effective buffer management using a trend chart.
2. Challenges
2.1 Trend chart user-unfriendly for management judgment
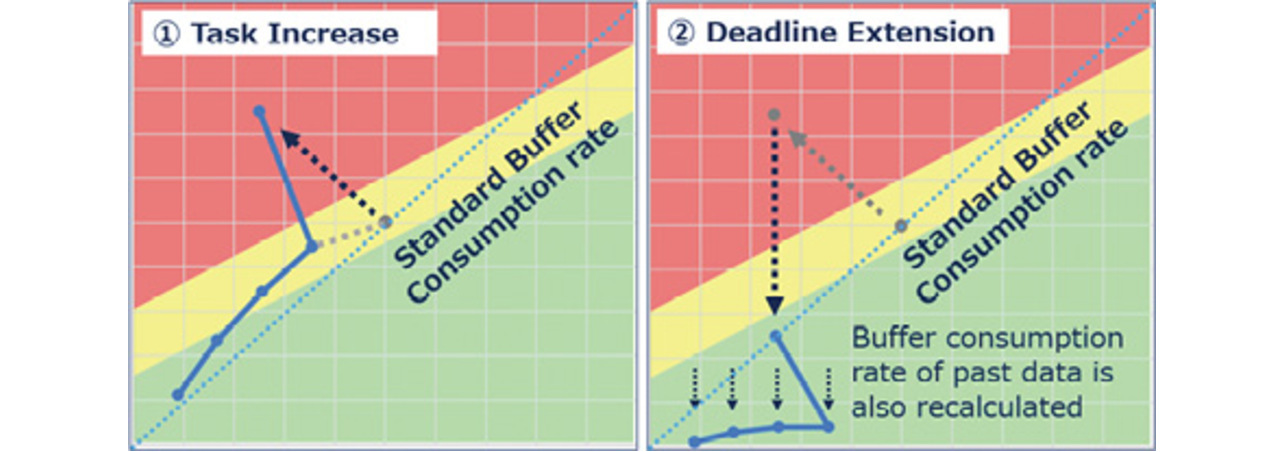
CCPM application to an R&D project causes complications to the trend chart. This phenomenon arises from the high uncertainty inherent in the R&D project. For example, CCPM involves developing detailed arrangements leading up to the achievement of the objective and identifying a critical chain consisting of a set of the longest-duration tasks among a series of tasks to calculate the project buffer. However, an R&D project with high uncertainty often remains unclear as to whether doable or not until started, which makes only short-term prospects available. To apply CCPM to such a project, the planner must develop a hypothetical procedure for achieving the objective. Then, this procedure will provide an interim basis for developing specific arrangements. However, as the project moves forward, new findings and technical challenges occur and cause a gap between the hypothesis and reality, giving rise to the need to make additions or deletions of tasks and changes to the priority among them. When such a change to the arrangements increases the remaining workload on the critical chain, a delay occurs and reduces the progress rate, which causes the trend chart to shift leftward. The buffer is consumed to absorb this delay. As a result, the current point of the trend chart moves upwards, shifting the graph plot upwards to the left as a whole (Fig. 4-(1)).
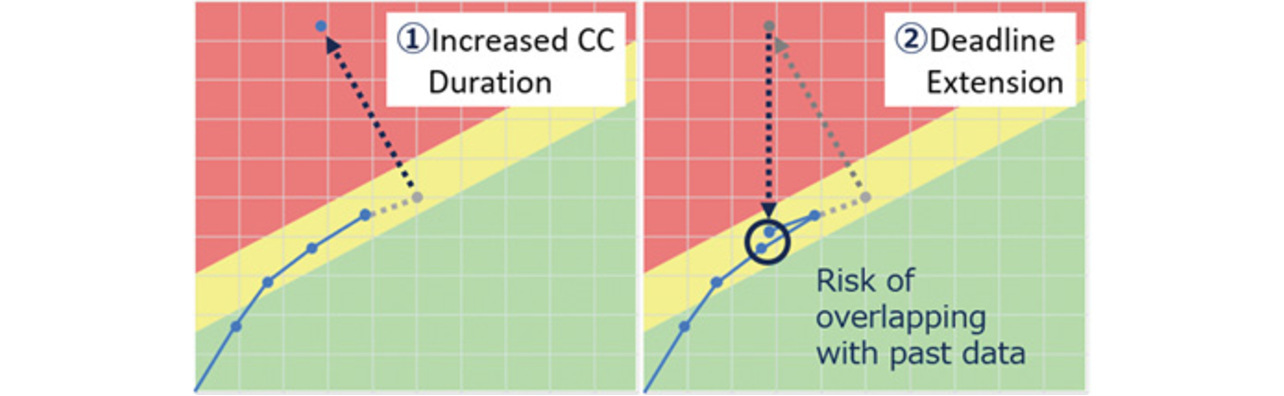
Moreover, an R&D project attempts to ensure quality while tackling new technical challenges. As such, it involves a high degree of development difficulty and is more likely to be delayed than ordinary product development projects. Hence, R&D projects have a high probability of using up the available buffer and ending up with a buffer consumption rate exceeding 100%. Such a situation forces the project manager to adjust the cost and deadline to ensure the intended quality. However, the organization’s limited budget often leads to an extended deadline. This extended deadline restores the buffer but shifts the current point of the trend chart downward (Fig. 4-(2)). As a result of making these adjustments in Figs. 4-(1) and 4-(2) simultaneously, the current point of the graph is plotted to return to the left-down from the position before the adjustment.
As explained above, a trend chart normally extends from the bottom left towards the top right as progress is made. Hence, after the modification of the arrangements, the current point of the graph follows a path similar to before every time it shifts upwards to the right. Therefore, plotted points overlap the line and result in a complicated trend chart (Fig. 3). This phenomenon occurs when the adjustments in both Figs. 4-(1) and 4-(2) are simultaneously made, although no problem results from either of the adjustments in Figs. 4-(1) and 4-(2). The current point of the graph moves along such a complicated path, which reduce the readability of the trend chart. Consequently, the current progress status cannot be grasped correctly and make optimal management judgment impossible. In a project with a particularly high degree of difficulty from among those we observed, such a phenomenon repeatedly occurred as often as once a week and result in an even more useless graph for management judgment as shown in Fig. 3.
2.2 Visual representation misaligned with the engineer’s actual perception
In CCPM, a critical chain consists of critical tasks that should be performed with priority. However, in an R&D project, the priority among the tasks frequently changes, whereby non-critical chain tasks may become more important so as to be performed with priority. In such a case, even when such tasks have progressed, the trend chart does not show an increased progress rate despite their importance. Based on the trend chart, the project manager and the engineer cannot correctly grasp the current progress status. Consequently, delays may occur when reviewing the plan or considering corrective actions.
Moreover, the frequent occurrence of such inconsistencies may reduce the engineer’s confidence in the trend chart. Feeling that the trend chart does not correctly reflect reality, the engineer would stop relying on the graph data for reference, resulting in a decrease in the overall project management efficiency. Such a trend chart showing the current progress status misaligned with the engineer’s actual perception can be regarded as another example of a readability problem.
2.3 Burden of arrangement modifications
In addition to the reduced readability of the trend chart, the burden of arrangement modifications emerges as another challenge in applying CCPM to an R&D project. As explained above, in an R&D project, the arrangements specified at the planning stage often go out of step with the actual project progress and face the need for frequent modifications. However, modifying the arrangements involves reconsidering the inter-task dependency to secure resources to ensure a sufficient buffer. This process is highly time-consuming.
The resulting increase in management workload has frustrated project leaders.
Moreover, in some cases, frequent arrangement modifications interrupted the workflow and reduced the engineers’ work efficiency and motivation. In other cases, the burden incurred prevented catching up on the backlog of arrangement modifications, which led to a gradually widening gap between the arrangements and reality and resulted in reduced confidence in buffer management per se.
3. Technical content
3.1 Aim of our efforts
The aforementioned challenges highlighted the need for a new buffer management system that serves the following two purposes in R&D projects with high variability and uncertainty:
- Enhancing the readability of the trend chart; and
- Reducing the burden of arrangement modifications.
The main distinction of CCPM is its ability to enable buffer management by identifying a critical chain. The critical chain identified during planning is supposed to remain unchanged, in principle, until project completion. Usually, the buffer absorbs the gap between the plan and the actual performance. Hence, few plan changes occur.
However, with R&D projects with high variability and uncertainty, inter-task priority changes, causing the critical chain to change. These changes reduce the readability of the trend chart, which is responsible for the heavy burden required for plan changes. Accordingly, we assumed that the above-mentioned challenges could be solved if an alternative method were available to calculate the project buffer without relying on this critical chain identification.
Hence, this paper proposes a buffer management method that only uses “resources,” “project duration,” and “estimates,” the three factors that are always collectible from whatever project. We named this method “VBM” because it virtualizes the project buffer and sets it as such, as explained below. The specific contents of these three factors are as follows:
- Resources: Number of project team members (persons)
- Project duration: Start-to-end duration (days)
- Estimate: Estimated task duration (days)
For the estimate, an estimated task duration in a foreseeable future range as of the estimation date will suffice.
3.2 Estimated duration-to-man-days conversion
Unlike CCPM, VBM does not identify a critical chain. As such, it calculates a project buffer (a.k.a. a “virtual buffer” in VBM) based on the total capacity available for the project (resources × duration = man-days). Hence, VBM uses the man-day as the base unit. Using the following equation, it converts the estimated durations of all the individual tasks into man-days (E):
- Ei: Estimated man-days for Taski
- Ti: Estimated duration for Taski
- Ni: Number of personnel assigned to Taski
3.3 Project buffer calculation in VBM
The equation for calculating the virtual buffer without using the critical chain is as follows:
- Bl: Length of the virtual buffer [man-days]
- Ut: Total man-days [man-days]
CCPM identifies a critical chain based on an Aggressive But Possible (ABP) estimate (very minimum number of days to meet the deadline somehow). Then, a duration equivalent to half that of this critical chain is set as a project buffer and placed at the tail of the project duration.1,3) In other words, a typical project buffer corresponds to approximately one-third of the project duration. Similarly to CCPM, VBM uses a one-third reference to calculate a project buffer. In VBM, however, the total man-days as the sum of all the man-days of all tasks provide the basis for the calculation. This modification aims to obtain a system that is useable even by an engineer unversed in CCPM to calculate the estimated task duration based on a buffer-inclusive estimate. Hence, it suffices for the engineer to make a buffer-inclusive estimate using a familiar method. If versed in CCPM, the person only has to obtain 1.5 times the ABP estimate.
3.4 Definitions and differentiated use of two kinds of total man-days
VBM uses the total man-days (Ut), which represents the estimated man-days for all the tasks to take place during the project duration, as the important value for calculating the progress rate and the project buffer. Note that Ut is a value that is variably adaptable to plan changes. Besides, Ut needs to be a value that allows the calculation of the project buffer until the deadline when only short-term prospects are available for the project. Accordingly, we make differentiated use of the following two different versions of Ut:
The first approach to Ut lets the total sum of estimated man-days (E) for all the tasks foreseeable as of the current time be the planned total man-days (Up), which is expressed as follows:
- Up: Planned total man-days [man-days]
- Ei: Estimated man-days for Taski [man-days]
However, as explained above, it is often the case with an R&D project that only short-term prospects are available. In this case, Up is unavailable to calculate the buffer in the period up to the deadline. For calculating the project buffer until the deadline to enable buffer management even under such a situation, another approach to Ut is to obtain the maximum total man-days (Um), which is expressed as follows:
- Um: Maximum total man-days [man-days]
- Pd: Project duration [days]
- R: Number of project team members [persons]
A virtual project buffer is calculated from this Um to enable buffer management up to the deadline based on the short-term prospects. This advantage is why we named this method VBM.
However, Um is the estimated man-days virtually set based on the project duration and the number of members and does not necessarily agree with the planned total man-days as of project completion (Up). Hence, with the continued use of Um until project completion, the progress rate may fail to be 100% even after all the planned tasks are completed. To solve this problem, we decided to switch Ut from Um to Up upon obtaining the prospects leading up to the deadline. The timing of switching is determined based on the estimated man-day difference (Du), the percentage equivalent of the Up–Um difference:
- Du: Estimated man-day difference [%]
When only short-term prospects are available, Um is used at the initial stage of the project because the progress rate and the virtual buffer cannot be calculated based on Up. During the project duration, the planned total man-days change day to day with tasks added/deleted as the prospects become clearer. The difference is also recalculated accordingly day to day. Um continues to be used until the difference reaches a preset threshold. At the time when the difference falls below the threshold as the project moves forward, switching to Up ensures that the progress rate is 100% upon the completion of all the planned tasks.
3.5 Approach to the threshold
As a result of considering several threshold patterns, we currently set a threshold of 15%.
- Du ≥ 15%: Let the total man-days (Ut) be Um.
- Du < 15%: Let the total man-days (Ut) be Up.
We set the threshold to 15% based on two bases: Basis 1, the gap between the maximum total man-days (Um) and the planned total man-days as of project completion (Up), and Basis 2, the point at which the prospects leading up to the deadline are established.
At the initial stage of a project with obscure prospects, only a limited number of tasks are identified. Hence, a significant difference exists between Up and Um. The difference diminishes as the project moves forward. However, any project completes not with Up and Um in complete agreement but with a gap in between. A threshold smaller than this gap makes it impossible to switch over to Up. Hence, the threshold must be set to a larger value than the gap. We have observed that the gap between Up and Um as of project completion falls within 10% for most projects. Based on these results, we determined that a desirable threshold value should be larger than 10%.
Then, we also considered the point at which the prospects leading up to the deadline are established as the project moves forward. With an excessive threshold, Um will be switched to Up at the phase where the prospects leading up to the deadline have not been established. A premature switchover may lead to a fluctuating trend chart due to subsequent plan changes, confusing the project manager. In our experience, for most 100-day projects, for example, the prospects to the end were established at a point with approximately 10 days (10% or two work weeks) left until the deadline. In contrast, the prospects were still unclear with 20 days (20% or about one month) remaining. Based on these results, we determined that a desirable threshold value should be smaller than 20%.
Considering these two factors, we set a not-too-large, not-too-small optimal threshold to 15%, the midpoint between 10% and 20%.
3.6 Virtual buffer dynamically adaptable to plan changes
As explained above, CCPM identifies a critical chain and uses its length as the denominator to calculate a project buffer. The critical chain and the project buffer have a fixed value to clarify the project’s progress status for easy evaluation. This value fixation assumes that the arrangements for the planned project are relatively stable. Hence, in the cases of projects with high variability and uncertainty, such as R&D projects, the project buffer significantly fluctuates and obscures the current progress status.
Meanwhile, VBM uses 1/3 of Ut as the virtual buffer to express the required man-days inclusive of the buffer. The main distinction of the virtual buffer is that this ratio is always maintained to adjust the amount of buffer even if Ut varies due to task additions/deletions. For example, when Ut is 90, the virtual buffer is 30. When Ut increases to 99 due to extra tasks, the virtual buffer is 33 with the 1/3 ratio maintained.
3.7 Progress and buffer consumption rate calculations
In VBM, the progress rate (Pr) is calculated as the ratio of the completion man-days (Uc) to the total man-days (Ut). The completion man-day value (Uc) is obtained from subtracting the total of the man-day equivalents of the remaining workdays of individual tasks at a certain point in time from the total man-days (Ut). In reality, however, the definitive Ut cannot be obtained until project completion. Hence, Up or Um, a virtual value, is used.
- Pr: Progress rate [%]
- Uc: Completion man-days [man-days]
- Ri: Man-day equivalent of the remaining workdays for Taski
The buffer consumption rate (Br) is calculated by adding the buffer variance rate to the standard buffer consumption rate:
- Br: Buffer consumption rate [%]
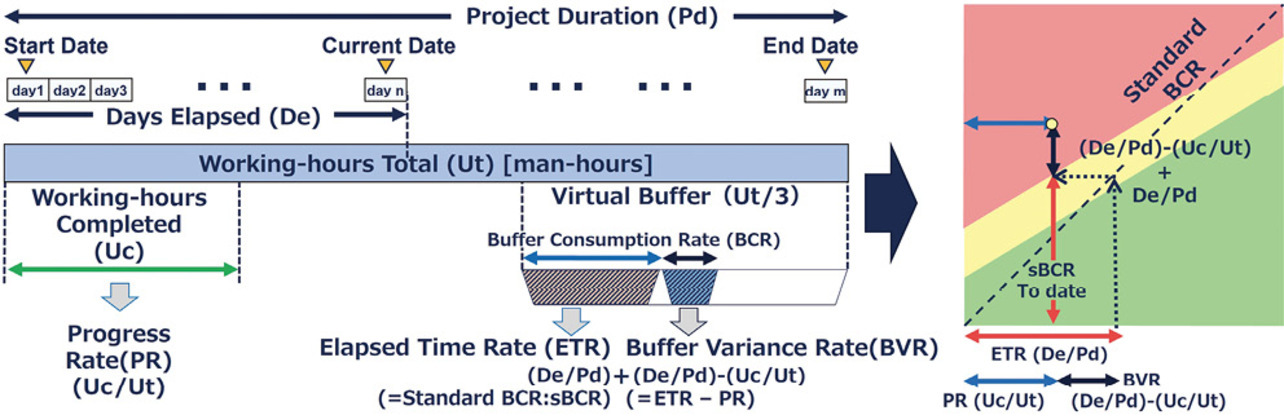
The buffer variance rate is the difference between the elapsed time rate and the progress rate. The elapsed time rate is expressed by the ratio of the days elapsed (De) by the current date to the project duration (Pd):
- De: Number of elapsed days [days]
On the trend chart, the straight line between the point where the progress and buffer consumption rates=0% and the point where the progress and buffer consumption rates=100% represents the ideal amount of buffer consumed for the days elapsed when the project stably consumes the buffer until completion. In VBM, this straight line is called the “standard buffer consumption rate” line. The elapsed time rate and the standard buffer consumption rate are 1:1 proportional:
For instance, for an elapsed time rate of 50% when a virtual buffer has a total amount of 30, the standard buffer consumption rate is 50%, and the ideal amount of buffer consumed is 15. When this elapsed time rate drops to 25%, the standard buffer consumption rate is 25%, and the ideal amount of buffer consumed is 7.5.
Summing up the above logic into an equation, we have the calculation equation below for the buffer consumption rate (Br). Fig. 5 shows a visual representation of the logic.
3.8 Principle of maintaining graph readability
In VBM, similarly to CCPM, adding extra tasks leads to a reduced progress rate and an increased buffer consumption rate. As a result, the plot point on the graph shifts upwards to the left (Fig. 6-(1)), similarly as in CCPM. When the project manager extends the deadline, judging that the project will not be completed in time if left at the current rate, the start-to-end duration of the project is extended, reducing the relative elapsed time rate as of the current date. For example, when five days have elapsed of a project planned to be ten days long max, the elapsed time rate is 50%. However, a ten-day extension of the deadline means that five days elapsed out of 20 days and resulted in an elapsed time rate of 25%.
A reduced elapsed time rate leads to a reduced buffer consumption rate (Br), shifting the plot point downwards. Though different in principle, a VBM trend chart apparently behaves similarly to CCPM’s. This phenomenon, together with the above-described phenomenon of increased tasks, results in a left-downward shift of the plotted point, which seems to be an occurrence of the point-line overlapping phenomenon described in Section 2 “Challenges.” In VBM, however, based on a standard buffer consumption rate reduced because of an extended deadline, the whole actual value plot of the buffer consumption rate is also recalculated. Hence, all the actual value points shift downwards similarly to the latest point without overlapping old and new plotted points as in CCPM (Fig. 6-(2)). Note that the progress rate is calculated based on the total man-days as of plotting and hence remains unchanged in value. Thus, the project can retain the consistency between its latest status and past trends, which enable proper management with graph readability.
4. Results and discussion
We turned the concept of VBM into a Microsoft Excel® tool and implemented it into multiple R&D projects. We achieved the following results as of one year after we started to use VBM for project management:
4.1 Improved graph readability
This subsection shows the results of converting CCPM’s actual performance data into VBM data based on one of the examples shown in Fig. 3 (Fig. 7). The CCPM trend chart’s readability is reduced by the phenomenon represented as “A.” This project’s deadline was extended by one month after adding extra tasks on top of an over 100% buffer consumption rate. As a result, the CCPM trend chart appears complicated and less readable because of the point plotted left-downwards.
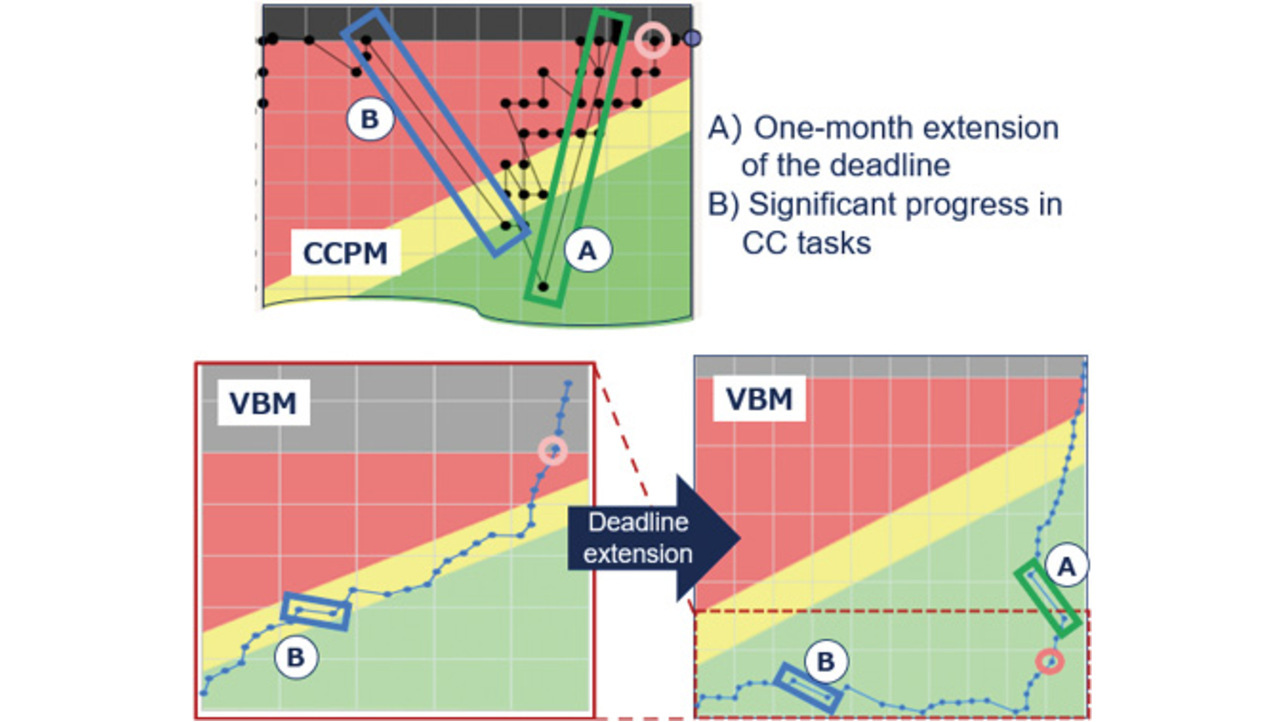
On the other hand, the VBM graph appears shifted downwards in its entirety as the result of recalculating all the actual progress rate/buffer consumption rate values when the deadline was extended. This achievement was made possible by the virtual buffer that characteristically varies with a constant ratio of 1/3 of Ut as explained in Subsection 3.6 and the graph readability retention principle explained in Subsection 3.8. As a result, the graph has a space in its upper part for plotting the progress after the extended deadline while retaining the past data trend in its lower part. Thus, a VBM graph remains readable even after an extended deadline without overlapping old and new plotted points as in a CCPM graph.
4.2 Visual representation close to the engineer’s actual perception
The verification illustrated in Fig. 7 also confirmed that VBM outperforms CCPM in high-variability R&D projects regarding the closeness of visual representation to the engineer’s actual perception.
In its B portion on Fig. 7, the CCPM trend chart shows a sudden right-downward shift due to the significant progress in the tasks on the critical chain. In contrast, the VBM trend chart shows a mild right-downward shift and exhibits less variability than the CCPM counterpart. This behavioral difference is due to the difference in the denominator used to calculate the progress and buffer consumption rates. In CCPM, the critical chain constitutes part of all the tasks and provides the denominator for calculating the progress and buffer consumption rates. When any critical-chain task moves forward, the graph reflects the progress. To put it the other way around, the progress rate on the graph remains unchanged, only with the buffer consumed, regardless of the progress in non-critical-chain tasks if critical-chain tasks show no change in progress. Hence, in R&D projects in which non-critical chain tasks often take precedence in execution, the progress rate on the trend chart does not reflect the progress in these tasks despite their importance, which misalign with the engineer’s actual perception of progress.
On the other hand, VBM calculates the progress and buffer consumption rates using a denominator consisting of all the tasks, whereby all the tasks worked are reflected in the progress and buffer consumption rates. As a result, a VBM trend chart shows smaller changes than a CCPM counterpart. However, it visualizes the current progress status closer to the engineer’s actual perception with all the tasks performed by the engineer reflected on it.
4.3 Reduced burden of plan changes
In CCPM, inter-task dependency, priorities, resource conflicts, and the like must be reviewed, followed by re-identifying the critical chain, before any arrangement modification is made, thereby requiring 30 minutes to several hours per arrangement modification.
Meanwhile, in VBM, buffer calculation is based on the capacity available for the project, as explained in Subsection 3.2. Hence, unlike CCPM, no consideration is required for inter-task dependency, priorities, and resource conflicts. When a plan change is required, it only takes adding/deleting a task carefully so that the planned total man-days (Up) do not exceed the maximum total man-days (Um). Most modifications can be completed in several tens of seconds to several minutes. As a result, in projects implemented with VBM, plan changes are made daily during about 15-minute progress meetings, considerably reducing the burden involved compared with projects managed using CCPM.
4.4 Users’ evaluation
We asked six engineers involved in our verification of VBM-based project management to answer an evaluation questionnaire with a 5-score scale from “1. I do not think so” to “5. I think so” regarding the effectiveness of VBM (Table 1). The results reveal that VBM is highly evaluated regarding all three criteria of flexible plan modification, enhanced project status visualization, and usability in high-variability projects. Moreover, one of the respondents commented that “project management was hard with CCPM. VBM has made project management much easier. When unreasonable demands are received from superiors, VBM can visualize the realistically deployable resources in man-days, allowing us to discuss an achievable plan with the superiors.” Thus, VBM was evaluated to be effective in the actual practice of project management.
| No. | Question | Average score |
|---|---|---|
| 1 | VBM allows flexible and effective responses to task changes. | 4.5 |
| 2 | VBM allows real-time visual representation of the current status of projects’ progress. | 4.7 |
| 3 | VBM is recommendable to other PMs for R&D and other projects that involve frequent priority changes or task additions/deletions and only make short-term prospects available. | 4.3 |
5. Conclusions
5.1 Requirements for applying VBM
Of the basic concepts in CCPM, factors other than the critical chain and its related feeding chains and buffers can be applied to VBM. Besides duration estimation, project buffer utilization, and trend chart-based progress visualization, the basic operations during project execution include task consolidation and resource optimization.
Following the introduction of VBM, effective and practical visual buffer management and reduced burden of plan changes have become possible in projects that used to be hard to manage with CCPM. However, VBM is not a system intended to replace CCPM completely.
CCPM identifies a critical chain based on inter-task dependency, calculates the project buffer, and enables rigorous management of the impact of task delays on the deadline. However, VBM cannot rigorously manage such an impact. If VBM is introduced into a project that accommodates creating more or less stable arrangements manageable with CCPM, progress in non-critical-chain tasks will increase the progress rate even when no progress has been made in the critical chain. Critical chain delays may go unnoticed in such a case, which delay management judgments. Therefore, for projects with clear prospects, well-defined inter-task dependency, and no need for frequent arrangement modifications, we strongly recommend using CCPM. VBM is a system dedicated exclusively to managing projects that are difficult to apply CCPM to because of high variability and uncertainty.
5.2 Future deployment
For R&D projects with extremely high variability and uncertainty, we proposed VBM as a system that enables new practical visual buffer management and reduces the burden of plan changes while solving the challenges in such projects.
We are sure that this system provides one of the most effective alternatives to CCPM in managing projects that are difficult to apply CCPM to, including but not limited to R&D projects. We expect that VBM will provide applicability to, for instance, product planning, new business start-ups, and new technology or system implementation projects that involve market research and competitive analysis, and IT projects, including their conceptual and planning phases, susceptible to the various factors of requirements and market changes. Moving forward, we will further verify and improve the effectiveness of VBM to contribute to engineers’ workload reduction and project productivity improvement.
References
- 1)
- T. Nishihara and J. Kuriyama, Standard Handbook of TOC/CCPM (in Japanese), Shuwa System Co., Ltd., 2010, p. 69-82, 112-113, 271.
- 2)
- Y. Kishira, Management Reform Process Chart (in Japanese), Chukei Publishing Co., Ltd., 2006, p. 70-71, 239.
- 3)
- T. Goto et al., Evolutionary Theory of Project Management (in Japanese), President Inc., 2022, p. 102-125, 199.
Microsoft Excel® is a registered trademark of Microsoft Corporation.
The names of products in the text may be trademarks of each company.