


Reduction of Waveform Discontinuity in Respiratory Waveform Measurement
using Millimeter-Wave Radar
- Millimeter-Wave Radar
- Vital Sensing
- Respiratory Waveform
- Discontinuity
- Waveform Analysis
Human sensing, which measures human movements and vital signs, has become familiar to us with the proliferation of measurement devices and the expansion of related services. Among the various measurement devices, millimeter-wave radar has attracted much attention because it can accurately measure human vital signs without physical contact. Discontinuous parts that do not exist in actual respiration may appear in the respiratory waveform, which is measured by the radar as chest wall movement. This is due to the presence of multiple reflection signals and the influence of environmental changes. Such discontinuities can hinder the estimation of health status from long-term waveform trends, so it is desirable to reduce them.
This paper proposes a method of selecting waveforms with less discontinuity from the estimated waveform group. This method is based on the characteristics of the waveform and the spatial information obtained by the radar. We conducted an experiment to simultaneously measure the respiratory waveforms of multiple people using millimeter-wave radar. The results showed that the discontinuity contained in the waveform was reduced compared to the case where discontinuity was not considered when constructing a long-term respiratory waveform using the proposed method.
1. Introduction
Human body sensing for measuring human motions and vital signs has become familiar in our lives following the rapid sophistication and proliferation of sensors and the spread of personal healthcare services. For example, it is widely practiced to measure such values as heart rate, blood oxygen saturation level, and skin temperature with wearable devices represented by smartwatches and to link these values with stress conditions or sleep patterns to monitor physical and mental health conditions on a day-to-day basis1,2). Moreover, applications are underway, including automotive driver’s wakefulness determination using cameras3) or human motion and posture measurement using depth sensors able to recognize objects as solids4). Against these backgrounds, human body sensing technologies are expected to become more and more critical in such fields as medicine, healthcare, and labor safety.
On the other hand, the increasingly wider use of these means of measurement involves practical points of concern. For instance, contact-type sensors for wearable devices or the like must remain in contact with the user’s skin during measurement. Hence, prolonged measurement may cause discomfort or, in the case of users with allergies, may cause skin inflammation. Optical sensors for cameras and other devices may leak face images and other personal information via the communication network they connect to, violating the user’s privacy.
Attention is gathering to human body sensing technologies using radar and other radio waves as methods to address such concerns. Measurement using radio waves usually involves no body contact and hence is free from the various problems with wearing sensors. Besides, this measurement method only provides an insufficient spatial resolution to identify human faces without posing serious privacy concerns. Among radio waves, microwaves and millimeter waves penetrate clothing and can detect human body surface movements. In particular, millimeter-wave radar, which uses millimeter waves as transmission signals, draws attention because of its short wavelength and broad signal band, which is sufficient to provide a high-precision measurement method for microdisplacements. Various studies are underway on human respirations and heartbeats as measurements of interest5-7).
Respiratory waveforms show respiratory tidal volume changes or body-surface microdisplacements as time waveforms, contain such information as respiratory depth and inhalation-exhalation time ratio, and provide a useful means of estimating sleep quality and health conditions8,9). When radar is used for respiratory waveform measurement, a common practice is to set a time interval of several seconds to several tens of seconds as a repetitive measurement cycle (hereinafter “observation interval”) as explained later5-7). To obtain a continuous waveform that lasts several minutes or more, one must connect waveforms estimated for observation intervals ranging from several seconds to several tens of seconds. Observing respirations in a time unit of several minutes or more is effective in grasping changes in health or sleeping conditions. However, most of the preceding reports have discussed measurement results for single observation intervals and have yet to consider the consistency of waveforms connected over multiple observation intervals. As a result, discontinuities may occur at observation interval boundaries at which waveforms are connected. These components are not found in actual respirations and may stand in the way of obtaining various estimates based on waveforms. As such, they should be reduced.
This paper proposes three methods of waveform selection during observation intervals to reduce discontinuities contained in continuous respiratory waveforms. Section 2 describes the principle of respiratory waveform measurement using radar. Section 3 introduces evaluation indices of discontinuity. Section 4 provides detailed descriptions of the proposed methods. Section 5 presents discontinuity evaluation results for continuous waveforms constructed by connecting waveforms selected using the proposed methods from groups of waveforms measured over multiple observation intervals using millimeter-wave radar.
2. Respiratory waveform measurement using radar
2.1 Signal model
For simplicity’s sake, let us assume that a transceiving antenna is used in the continuous wave (CW) type of radar. Also assume that radio wave reflection occurs at only one point on the surface of the human body. Then, the baseband signal obtained by quadrature detection of the transmission signal reflected on the body surface and the incoming signal received by the antenna can be expressed as follows:10)
where t is time, A is complex amplitude, f0 is the transmission signal frequency, d(t) is the respiration-induced body surface displacement in the radar line-of-sight direction, c is the speed of light, sDC is the DC component known as static clutter equivalent to the reflected wave or the like from a stationary object, and n(t) is noise. As is clear from the above equation, the body surface displacement component is contained in the phase term , the phase change amount of which is proportional to the frequency. The phase change amount increases with higher frequency for the same body surface displacement. For respiration-induced microdisplacements, higher-sensitivity measurement is hence achievable using millimeter waves rather than microwaves. Here, let us draw on a study by Albanese et al.11) and formulate d(t) as follows:
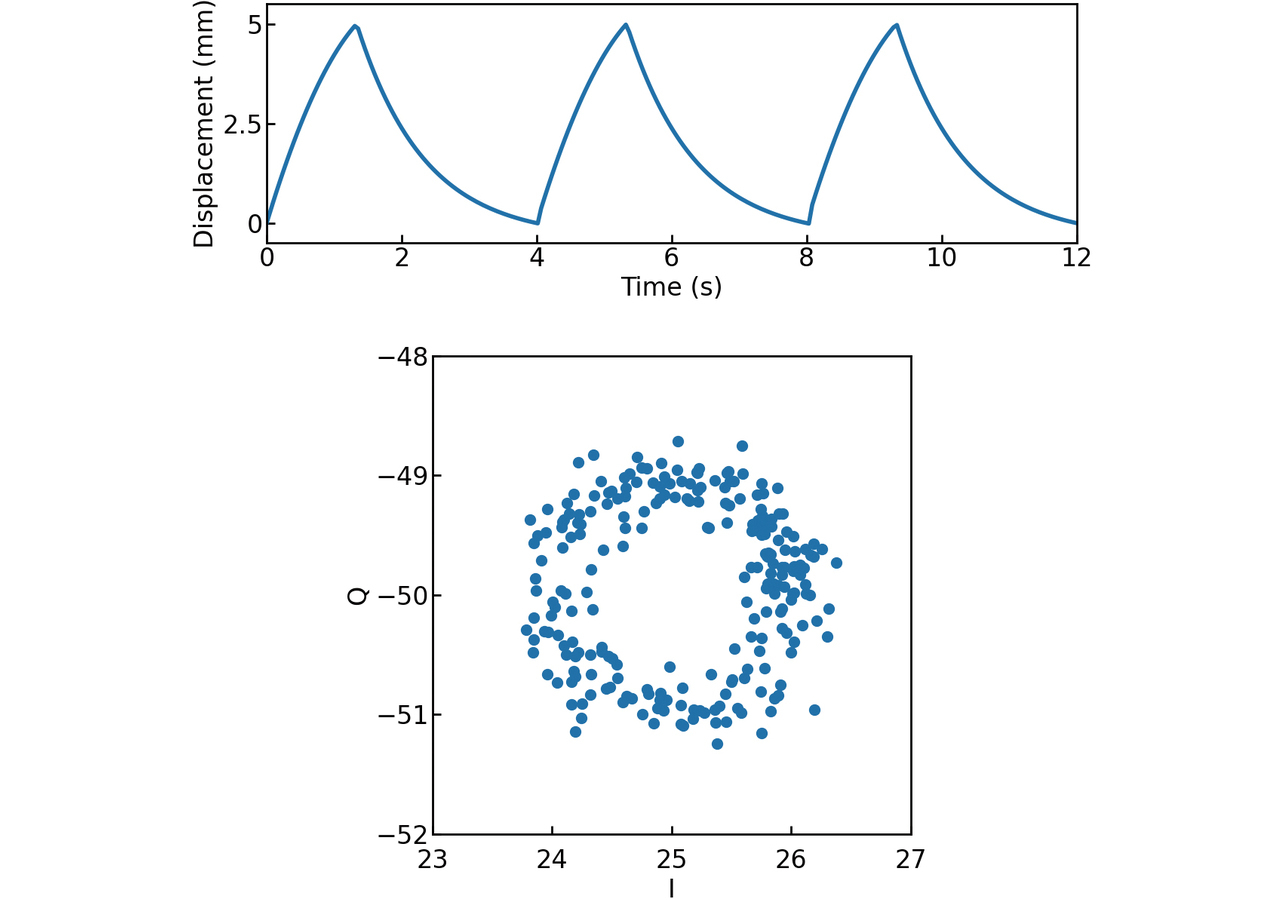
where K is a coefficient denoting the amount of displacement, TI is the inhalation time per respiratory cycle, TE is the exhalation time per respiratory cycle, T = TI + TE is the respiratory cycle, and τ is the time constant for exhalation. Assuming as an example that in Eq. (2), the peak-to-peak portion of body surface displacement is K = 0.005 (5 mm), the respiratory cycle is T = 4 s, and the inhalation-exhalation time ratio is TI: TE = 1:2, let us substitute these three values into Eq. (1) to obtain the baseband signal. Note, however, that in Eq. (1), f0 = 60 GHz, |A| = 1, sDC = 25–50j, the signal-to-noise ratio is 12 dB, and the signal is a discrete-time signal sampled at the cycle of 50 milliseconds.
The top pane of Fig. 1 shows the time waveform of the body surface displacement set above. Meanwhile, the bottom pane of Fig. 1 shows the baseband signal obtained correspondingly and plotted on the complex plane. It is shown that the signal draws arcs around the static clutter component on the complex plane. A method known as inverse tangent demodulation was proposed, taking advantage of this characteristic, and is widely used. This method is employed to estimate the respiratory waveform by obtaining the phase (body surface displacement component) from the signal declination relative to the center of the circle estimated by circle fitting or otherwise12,13). Unless the center of the circle is accurately estimated, the use of this method will result in a distorted waveform. Therefore, one should note that a significant change in clutter over time reduces measurement accuracy.
2.2 Separation of multiple signals
Let us consider actual reflection signals here as opposed to the ideal reflection signal discussed in the previous subsection. Radio wave reflection can occur simultaneously at the surfaces of various human body parts. Therefore, it is usual that multiple reflection signals are received rather than one. Moreover, if more than one person exists in the radar measurement area, body surface displacement components corresponding to different respirations will be superposed on signals. Proper signal separation/estimation is necessary to measure individual respiratory waveforms accurately. While various methods are available for this purpose, this paper adopts a method that spatially separates signals based on estimation results for radar-to-reflection point distances or reflection signal angles of incidence to the antenna. A spatial resolution on the order of centimeters can be achieved for millimeter-wave radar by adopting, for example, broadband signal transmission/reception using the frequency-modulated continuous wave (FMCW) method that uses frequency-modulated transmission signals for distance estimation or, alternatively, the multiple-input multiple-output (MIMO) radar technology that uses multiple transceiving antennas to form a virtual array antenna for enhanced bearing estimation performance14).
2.3 Respiratory waveform measurement during observation intervals
This subsection explains the signal processing involved in respiratory waveform measurement. Fig. 2 shows a typical signal processing flow during an observation interval in respiratory waveform measurement using radar. First, radar signal transmission and reception occur (Fig. 2(a)). Based on the baseband signal obtained, spatial profiles relative to the distance and bearing are obtained for spatial separation of reflection signals (Fig. 2(b)). For their calculation, the Fourier transform is often used. Spatial points obtained by discretely sampling a measurement space in the distance and bearing directions are called bins. Each bin contains complex amplitude data consisting of amplitude and phase information. Radar signal transmission and reception and spatial profile calculation occur repetitively at a predetermined cycle. The spatial profile calculation cycle is set to be sufficiently short for the expected respiratory cycle to prevent the aliasing of the waveforms to be estimated.
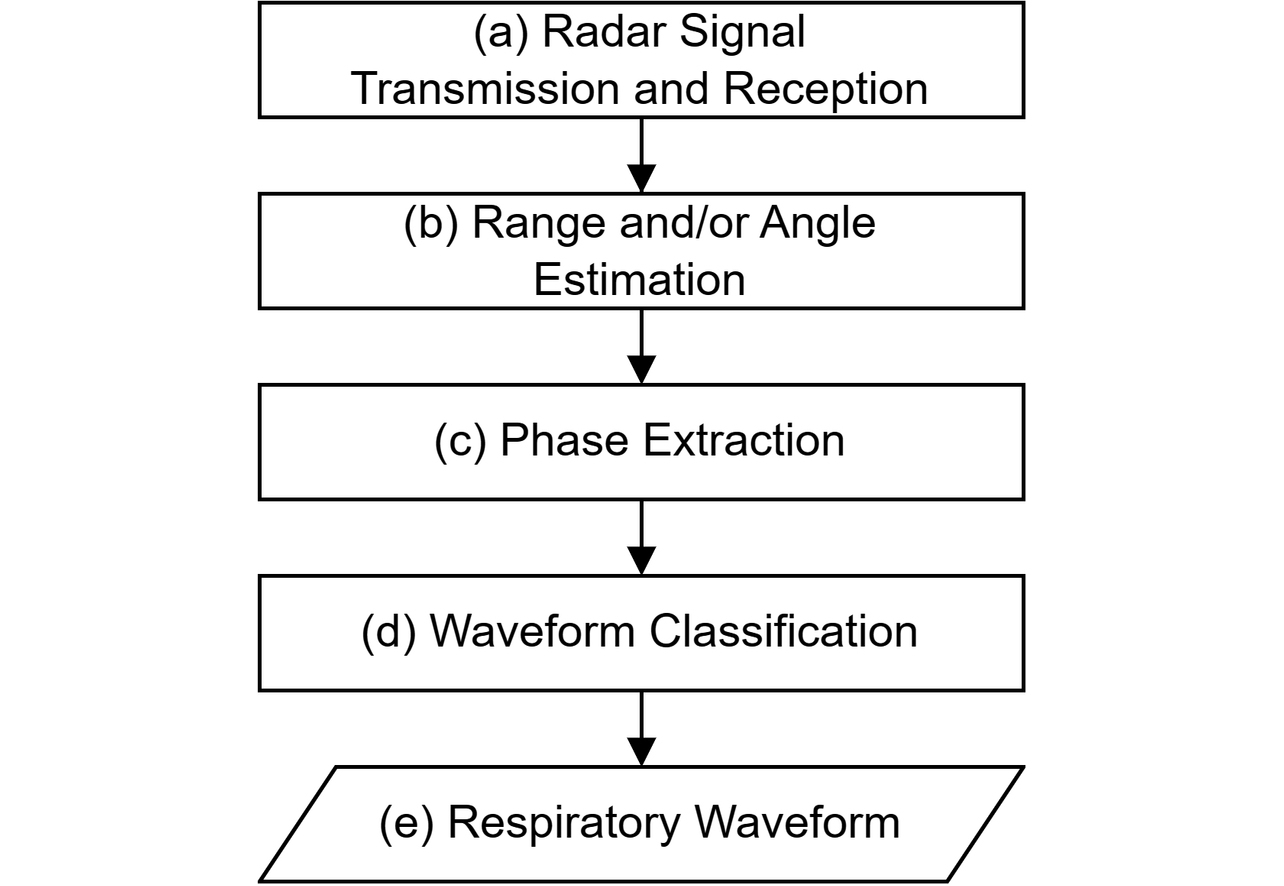
Next, after spatial profiles are accumulated until the observation interval is over, for the time direction data of each bin, static clutter estimation and removal occur to perform inverse tangent demodulation (Fig. 2(c)). An observation time set longer than the expected respiratory cycle would make it easier to detect the (quasi-)cyclicity contained in waveforms. On the other hand, a long observation interval set to several minutes or more would involve changes in the surrounding environment or subject’s position over time. As a result, the estimated waveform would be distorted, posing the problem of the inability to obtain accurate measurement results over a long duration. Besides, the signal processing target’s data size and computational scale will increase with a longer observation interval, leading to a higher measurement system cost. Therefore, an observation interval is usually set within an approximate range from several seconds to several tens of seconds.
Then, whether the waveform obtained from each bin originates from respiration is determined to extract bins that contain signal components considered correlated to respiration (Fig. 2(d)). Methods proposed so far include applying a bandpass filter to match the respiratory cycle or classification by clustering, among others5-7). Based on the waveform (group) thus obtained, a representative waveform is constructed as the output during the observation interval (Fig. 2(e)).
3. Discontinuities in respiratory waveforms and evaluation indices
3.1 Discontinuities contained in respiratory waveforms
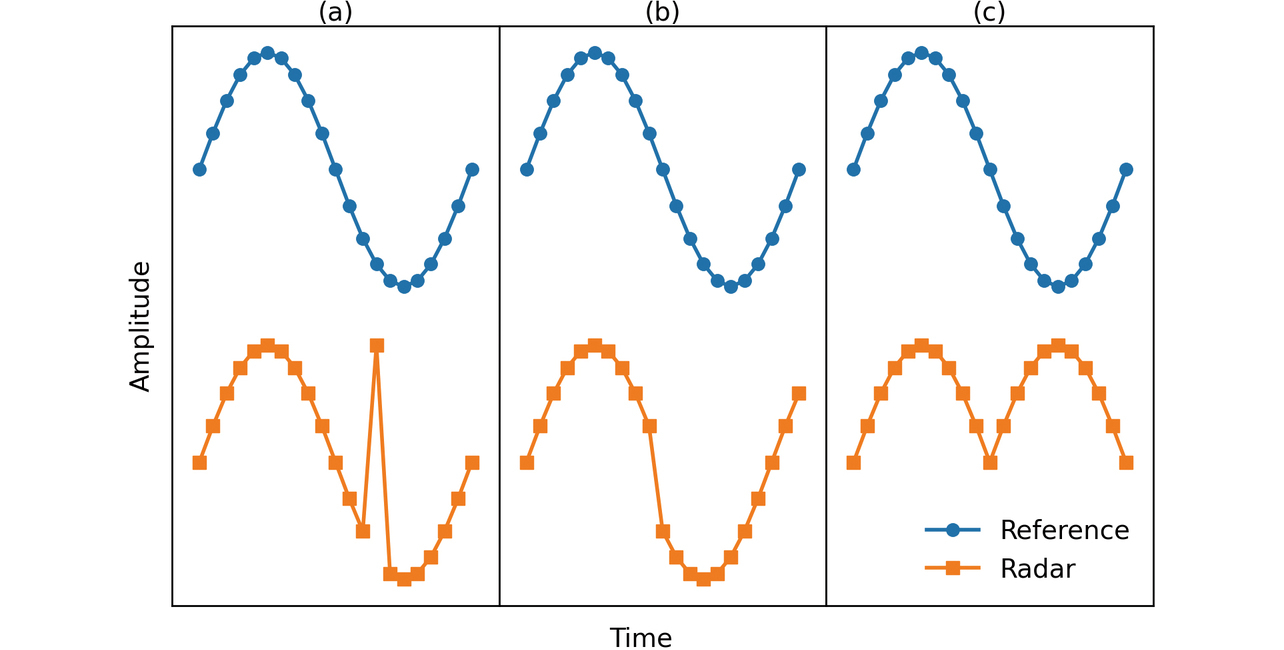
Fig. 3 shows a typical discontinuity that may appear in a respiratory waveform. Each pane of the figure shows a waveform estimated using radar and another waveform (hereinafter “reference waveform”) obtained using an alternative reliable means of measurement, such as a flow sensor or belt-type sensor (hereinafter “respiration belt”). The assumption here is that each waveform was sampled as a discrete-time signal. Fig. 3(a) corresponds to a case where a spike-shaped response is obtained at a single sampling point. This response occurs because of a factor, such as some disturbance mixed in during measurement or distortions in waveforms. Fig. 3(b) shows a case where a waveform offset or a phase difference occurs at a threshold point in time (e.g., observation interval boundary). This phenomenon occurs because, as explained in Section 2, the estimation accuracy for the static clutter contained in the received signal may vary from one observation interval to another due to such factors as change over time, resulting in a waveform superposed with distortion components differing between observation intervals. Other possible causes include the fact that multiple reflection signals on the body surface are obtained in a range narrower than the spatial resolution or the spatial extent of bins or that the state of multipath reflection signals that follow multiple propagation paths changes along with slight changes in the relative position of the radar to the person. Even in the same bin, changes in the dominant signal component over time may cause an estimated waveform to vary before and after the observation interval. Fig. 3(c) shows a case where the phase of the waveform is reversed at a certain point in time. The cause of this reversal is that the waveform estimated using radar reflects the body surface displacement in the radar line-of-sight direction. When, in particular, the transmission wave is incident at a shallow angle relative to the body surface, the displacement direction and the line-of-sight direction become orthogonal to each other. Depending on the shape of the human body part, displacement components directionally opposite to each other as viewed from the radar may be measured simultaneously. As far as we observed, some people may often show abdomen and chest displacements in opposite directions as they breathe. In such a case, even with the transmission wave incident at an angle nearly perpendicular to the body surface, the resulting waveforms would exhibit an in-phase/anti-phase relationship.
3.2 Evaluation indices of discontinuity
This subsection introduces quantitative evaluation indices of the magnitude of discontinuity to consider reducing the discontinuities contained in respiratory waveforms. The slope of the waveform has various values depending on the state of respiration varies depending on the respiration state. Hence, it is inappropriate to evaluate its discontinuities based entirely on the amount of change in the value between adjacent sampling points. Then, two indices with different perspectives are introduced here: one with a focus on the value difference to the reference waveform (hereinafter “difference index”) and the other with a focus on the change in waveform gradient (hereinafter “gradient index”). This paper places particular focus on the discontinuities at the observation interval boundaries. However, spike-response-like discontinuities can also occur elsewhere other than boundaries. Hence, all the sampling points in the waveform, including those other than at observation interval boundaries, are evaluated for discontinuities. The following discussions assume that waveforms in individual observation intervals are sampled at equal time intervals, using an N number of discrete points n = 1, ..., N.
3.2.1 Difference index
The difference value between adjacent sampling points is calculated for the reference waveform and the waveform estimated using radar, respectively. Obtained as the absolute value of their difference is the difference index, which is given as Eq. (3), where is the estimated displacement value at the nth sampling point on the target waveform for the index calculation in the current observation interval. Note, however, that denotes the estimated displacement value at the N th sampling point on the target waveform for the index calculation in the immediately preceding observation interval. The sampling timing is common to both waveforms and scaled by standardization for easy value comparison. The value of this index decreases with the increased similarity in shapes between the two waveforms whereby the discontinuities involved are regarded as minor. However, even if measurements are taken for the same respiration, the waveforms obtained may differ between the measurement methods with different principles. A radar device obtains a waveform based on a respiration-induced body surface displacement whereas a flow sensor, for instance, obtains a waveform based on a respiration-induced airflow change. Thus, their measurement principles are completely different. When a reference waveform is obtained using a means significantly different in measurement principle from radar, it should be noted that a large index value will result whereby the discontinuities involved may be regarded as large, even if no discontinuities, such as the one shown in Fig. 3, are contained in the waveform estimated with radar.
3.2.2 Gradient index
The gradient index is obtained as the absolute value of the difference between the mean value of the gradient before and after the sampling point, which is to be evaluated on the waveform estimated using radar and the gradient at that sampling point. This index is given as in Eq. (4), where is the gradient obtained by the backward difference at the nth sampling point on the target waveform for index calculation in the current observation interval. Note, however, that denotes the gradient obtained by the backward difference at the N th sampling point on the target waveform for the index calculation in the immediately preceding observation interval while denotes the gradient obtained by the backward difference at the first sampling point on the target waveform for the index calculation in the immediately following observation interval. As with the case of the difference index, the target waveform is scaled by standardization. This index reflects the rate of change in the gradient. A smoothly shaped waveform with a low rate of change would show a low index value whereby the discontinuities involved would be regarded as minor. On the other hand, because this index is calculated without the involvement of a reference waveform, even an estimated waveform with a significantly different shape from that of the reference waveform may be regarded as having minor discontinuities.
3.3 Verification of the indices
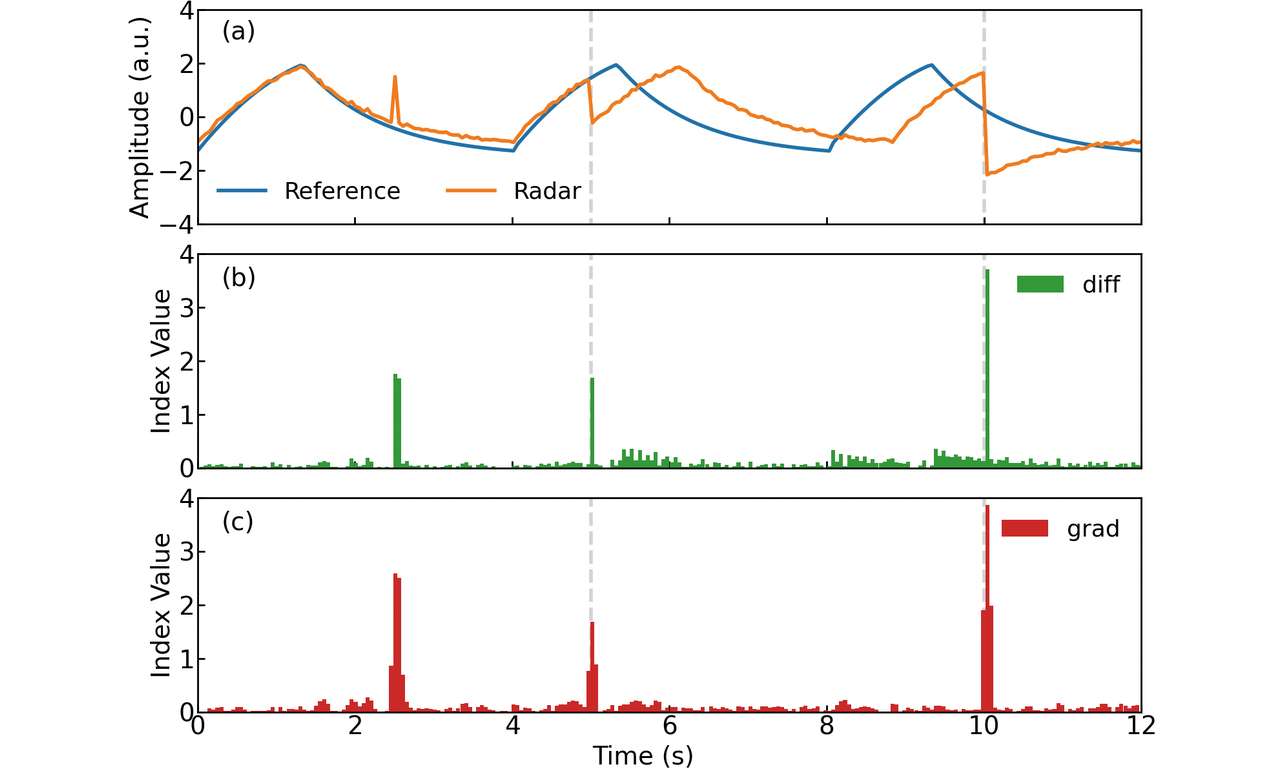
We performed a simulation to verify the above evaluation indices for proper functioning. The reference waveform and the radar-related settings were based on the conditions presented in Section 2. The observation interval duration was set to 5 seconds. Fig. 4(a) shows the reference waveform to be evaluated and the respiratory waveform estimated using radar. Both waveforms are scaled by standardization. The broken lines in the figure represent observation interval boundaries. In the waveform estimated using radar, a spike response is assigned to the 2.5-second point in the first observation cycle/interval, a phase difference equivalent to one-fifth of the respiratory cycle relative to the reference waveform is assigned to the second cycle, and a discontinuity is assigned to the third cycle phase-reversed relative to the reference waveform. Figs. 4(b) and 4(c) show the difference index value and the gradient index value obtained for this waveform, respectively. The two indices have relatively large values at the discontinuities and small values elsewhere. Seeing that both indices worked properly, we decided to use them for the discontinuity evaluation.
4. Waveform selection method
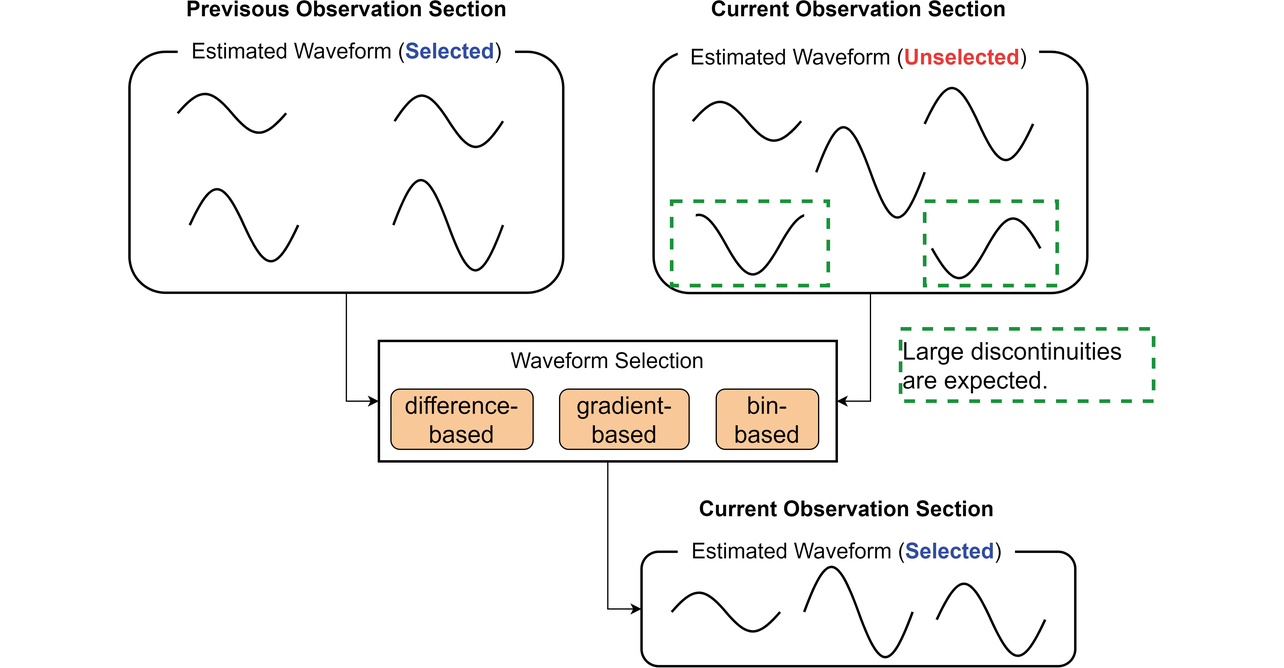
As explained earlier, a radar device generally receives multiple reflection signals simultaneously. Therefore, it obtains more than one waveform with a component corresponding to respiration. To construct a continuous waveform extending with minor discontinuities over a long duration based on the group of respiratory waveforms estimated for each observation interval, one must select appropriate waveforms from these groups of waveforms using some method or another. This task is performed as the processing between Steps (d) and (e) of the signal processing flow in Fig. 2. Note that sequential processing is necessary to produce a continuous output of waveforms in real time. Accordingly, the explanations below assume that a group of waveforms has already been selected during the immediately preceding observation interval as shown in Fig. 5 to consider the method of selecting more than one waveform from the group of unselected waveforms in the current observation interval. This paper proposes three methods that draw on the information of the above two groups of waveforms to make selective use of three different waveform selection criteria: difference, gradient, and bin.
4.1 Difference-based selection criterion
For the group of Ms number of respiratory waveforms estimated for the current observation interval s, let the estimated displacement value at the first sampling point in the i th waveform (i = 1, ..., Ms) be . Likewise, for the group of number of waveforms estimated for the immediately preceding observation interval , let the estimated displacement value at the N th sampling point in the j th waveform be . For the estimated displacement value of the i th waveform in the current observation interval, the difference at the observation interval boundary from the estimated mean value of displacement for the group of waveforms in the immediately preceding observation interval is to be obtained as in Eq. (5). For this value, perform an ascending-order sort. Then, waveforms with smaller changes in the value before and after the observation interval boundaries when the waveforms are connected will be ranked higher. Set the number of waveform selections appropriately for the measurement conditions and pick that many higher-ranked waveforms.
4.2 Gradient-based selection criterion
For the group of respiratory waveforms estimated for the immediately preceding observation interval, let the gradient obtained by the backward difference at the N th sampling point in the j th estimated displacement waveform be . Likewise, for the group of waveforms estimated for the current observation interval, let the gradient obtained by the backward difference at the second sampling point in the i th estimated displacement waveform be . The difference between their mean value and the gradient obtained by the backward difference at the first sampling point in the same i th estimated displacement waveform is to be averaged over and obtained as in Eq. (6), where is obtained using the estimated displacement value before and after the observation interval boundary. For this value, perform an ascending-order sort. Then, smoother waveforms with non-steep gradient changes before and after the observation interval boundaries when the waveforms are connected will be ranked higher. Similarly to the case with the difference-based selection criterion, set the number of waveform selections and pick that many higher-ranked waveforms.
4.3 Bin-based selection criterion
A respiration-induced body surface displacement occurs when multiple body parts connected together by skin move in a chain. Therefore, reflection signals from body parts spatially close to each other may likely contain body surface displacement components highly correlated to each other, in other words, respiratory waveforms similar in shape to each other. Besides, unless large body motions occur and pose difficulty with measurement using radar, one can expect that spatial coordinates at which reflections from the same body part are obtained will remain the same or show no significant change between adjacent observation intervals. This assumption serves as the basis for determining a reference bin from the bin distribution in the spatial profile of obtained waveforms and picking ones obtained from bins at closer distances to the reference bin. For the set of bins , where the j th waveform is obtained for the group of waveforms estimated for the immediately preceding observation interval:
let the reference bin be the bin corresponding to the coordinates that are the medians of the spatial coordinates to which the bins in the set correspond. For the group of waveforms estimated for the current observation interval, obtain the Euclidean distance between the bin , where the i th waveform is obtained, and the reference bin as follows:
For this value, perform an ascending-order sort. Similarly to the cases with the other selection criteria, set the number of waveform selections and pick that many higher-ranked waveforms. In this method, waveforms are selected based on spatial coordinates. Therefore, waveform values themselves at the observation interval boundaries are not considered. It should be noted that this method cannot be applied to measurement with a radar device that cannot separate signals in the range or bearing direction without bin information.
5. Experiment evaluation
We used the evaluation indices of discontinuity to verify the effectiveness of the methods presented above in reducing discontinuities contained in respiratory waveforms. More specifically, we performed an experimental measurement of human respiratory waveforms to evaluate the influence of the use or nonuse of the proposed methods on waveform discontinuities.
5.1 Experiment environment
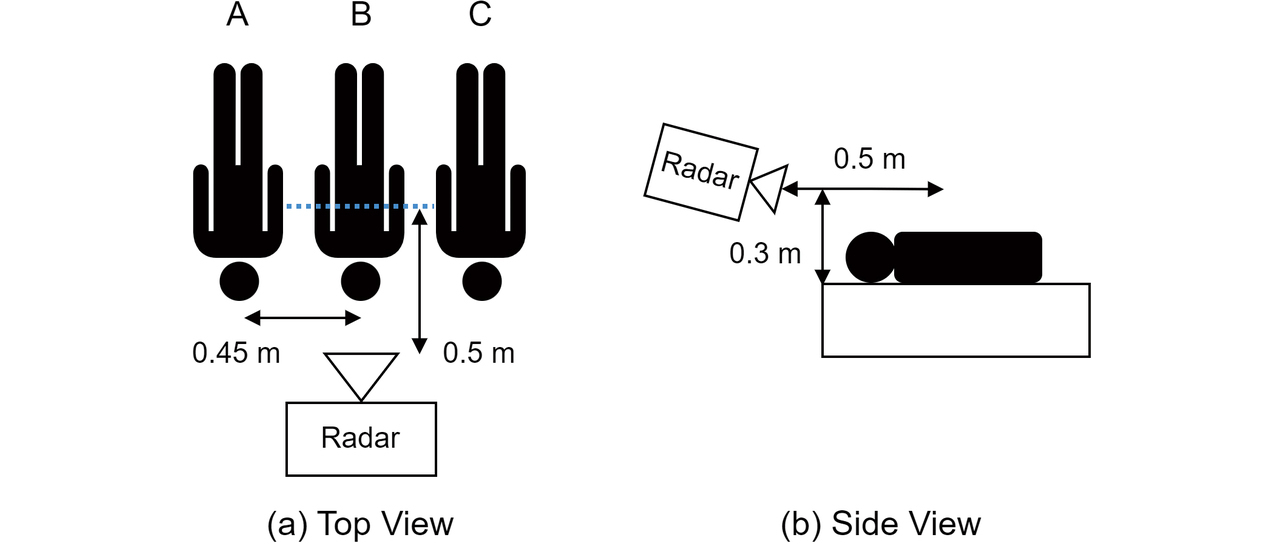
The radar system we used is an FMCW millimeter-wave radar system with its transmission signal set to a center frequency of 62 GHz and a bandwidth of 3.3 GHz. This radar system has a two-transmitter, three-receiver antenna, which forms a six-element, half-wavelength interelement spaced linear array antenna as the MIMO array. The radar (spatial profile) sampling cycle is 80 milliseconds. The observation interval has a duration of 20 seconds (number of sampling points N = 250). Fig. 6 shows the relative arrangement of the radar system and subjects in the experiment. Assuming a scene of a family sleeping at home, let three subjects (A, B, and C) lie face-up, side by side, shoulder to shoulder, and spaced 0.45 meters apart. The radar system is installed on the head side of these subjects, right in front of Subject B in the middle, with a horizontal distance of 0.5 meters from the subject’s chest and a vertical distance of 0.3 meters from the subject’s back. A respiration belt is worn around the trunk of each subject to ensure that the reference waveform is obtained simultaneously with measurement with radar. The radar and the respiration belts have it in common that they detect and convert body surface displacements into respiratory waveforms. Waveforms obtained by the former and the latter may ideally show a high correlation. The respiration belts are set to a sampling cycle of 10 milliseconds. The belts are synchronized to the radar’s sampling timing so that values obtained by the former and the latter can be compared at common sampling points.
Using the above experimental arrangement, we continuously measured the respiratory waveforms of each subject. Applying time-series clustering15) to the measurement results for 600 seconds, equivalent to 30 observation cycles/intervals, we extracted respiratory waveform groups subject by subject for each observation interval. If the number of waveform selections in each proposed method were set adaptively to suit the measurement conditions during each observation interval, the proposed methods would reduce the waveform discontinuities more efficiently. However, we leave this point as a challenge for the future. Instead, we set a uniform number of waveform selections for all the observation intervals. Accordingly, from among all the observation intervals, we picked the interval with the smallest number of waveforms obtained and set that number as the number of waveform selections for each proposed method. Based on this number, we selected waveforms using the proposed methods in the respective observation intervals.
5.2 Evaluation results
Using the proposed methods in the respective observation intervals, we selected waveforms to construct continuous respiratory waveforms extending over all the observation intervals. The continuous waveforms were constructed from the medians at the sampling points for the group of waveforms selected for each observation interval. Table 1 shows the mean values of the discontinuity indices at sampling points on the observation interval boundaries involved. For the waveforms based on no selection criteria and set as comparative controls, the selection was made in ascending order based on the indices uniquely assigned to bins during the clustering process for extracting the groups of waveforms corresponding to the respective subjects. This selection occurred as a by-product during the signal processing process and was not intended to reduce the discontinuities.
| \ | Subject A | Subject B | Subject C | |||
|---|---|---|---|---|---|---|
| Criterion/index | Difference | Gradient | Difference | Gradient | Difference | Gradient |
| None | 0.37 | 0.41 | 0.07 | 0.09 | 0.21 | 0.22 |
| Difference | 0.07 | 0.09 | 0.07 | 0.09 | 0.10 | 0.11 |
| Gradient | 0.08 | 0.10 | 0.06 | 0.08 | 0.11 | 0.09 |
| Bin | 0.06 | 0.06 | 0.06 | 0.08 | 0.10 | 0.10 |
Table 1 shows that the use of the proposed methods reduced the waveform discontinuities, except for the case of Subject B, whose waveforms showed only minor discontinuities in the first place. Besides, the three proposed methods showed minor differences in index values and similar levels of effectiveness in reducing the discontinuities at the observation interval boundaries. The probable causes of only Subject B showing no significant changes in index values include the fact that, with Subject B positioned right in front of the radar system, the signal resolution increased in the front direction due to the nature of bearing estimation, making it easier to obtain properly spatially separated signals in each observation interval, or fewer multipath reflection signals (explained below) occurred, causing only minor distortions to waveforms.
Table 2 shows the mean values of the discontinuity indices at sampling points other than the observation interval boundaries as of the points in time when the continuous waveforms were constructed. Similarly to the cases with the observation interval boundaries, the use of the proposed methods reduced the discontinuities. As explained in Subsection 3.1, the waveforms differed in the distortion component superposed on them. Relatively highly distorted waveforms can show a significant instantaneous change in estimated displacement values. Hence, under the difference/gradient-based selection criteria, such waveforms are more likely to be regarded as containing large discontinuities than slightly distorted waveforms. As a result of highly distorted waveforms ceasing to be selected, the index values become smaller even off the observation interval boundaries, leading to reduced discontinuities. Moreover, the multipath state in each observation interval also affects the discontinuities. While direct reflection signals from persons tend to be received relatively stable in the observation intervals before and after, multipath reflection signals may switch from one propagation path to another between observation intervals, depending on the person’s conditions or the surrounding environment. Direct and multipath reflection signals interfere with each other, causing fluctuations in received intensity or distortion in waveforms. Unlike the other selection criteria, the bin-based selection criterion has the function of making it difficult to select reflection signals that take significantly different propagation paths between observation intervals or do not show stable, received intensity. This function reduces the influence of multipath reflection signals, which take a variety of propagation paths only to intensify waveform distortions. As a result, waveforms estimated based on direct reflection signals from persons become easier to select, increasing the likelihood of reduced discontinuities.
| \ | Subject A | Subject B | Subject C | |||
|---|---|---|---|---|---|---|
| Criterion/index | Difference | Gradient | Difference | Gradient | Difference | Gradient |
| None | 0.10 | 0.09 | 0.07 | 0.09 | 0.10 | 0.11 |
| Difference | 0.06 | 0.06 | 0.07 | 0.09 | 0.07 | 0.08 |
| Gradient | 0.07 | 0.07 | 0.07 | 0.09 | 0.08 | 0.09 |
| Bin | 0.03 | 0.03 | 0.07 | 0.09 | 0.07 | 0.08 |
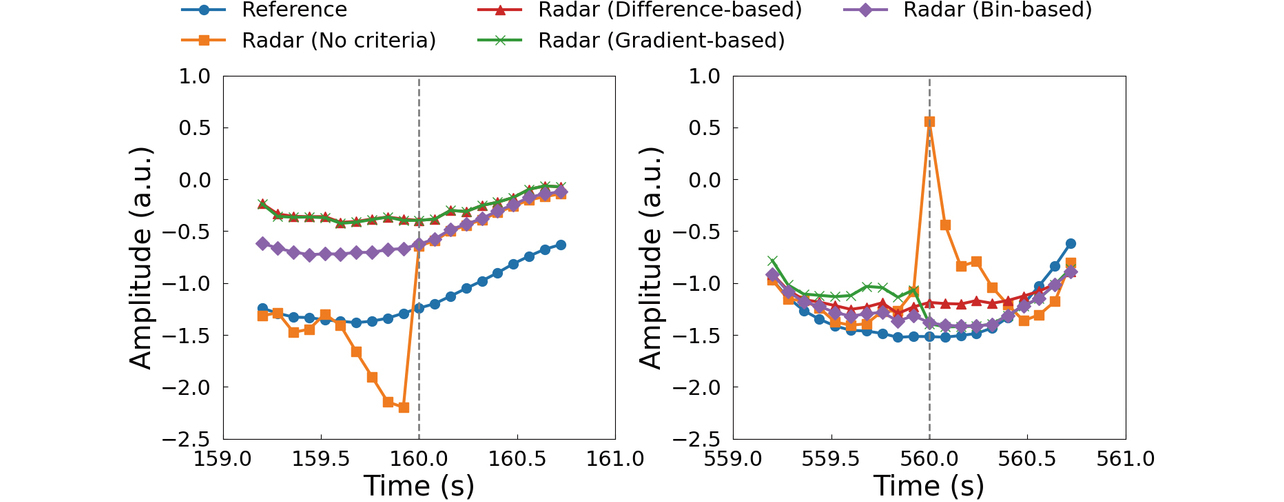
Fig. 7 shows Subject A’s reference continuous waveform, for which the proposed methods most effectively reduced discontinuity index values for the results shown in Tables 1 and 2, along with a continuous waveforms constructed without selection criteria and the continuous waveforms constructed using the proposed methods. The broken lines in the figure represent the boundaries of 20-second-long observation intervals. Fig. 8 shows enlarged views of the waveforms around the 160- and 560-second points in Fig. 7 as examples of discontinuity reduction at the observation interval boundaries. In Fig. 8, while the waveform based on no selection criteria shows prominent discontinuities, the other waveforms all show similarly reduced levels of discontinuities as a result of applying any of the proposed methods, thereby getting close to the reference waveform.
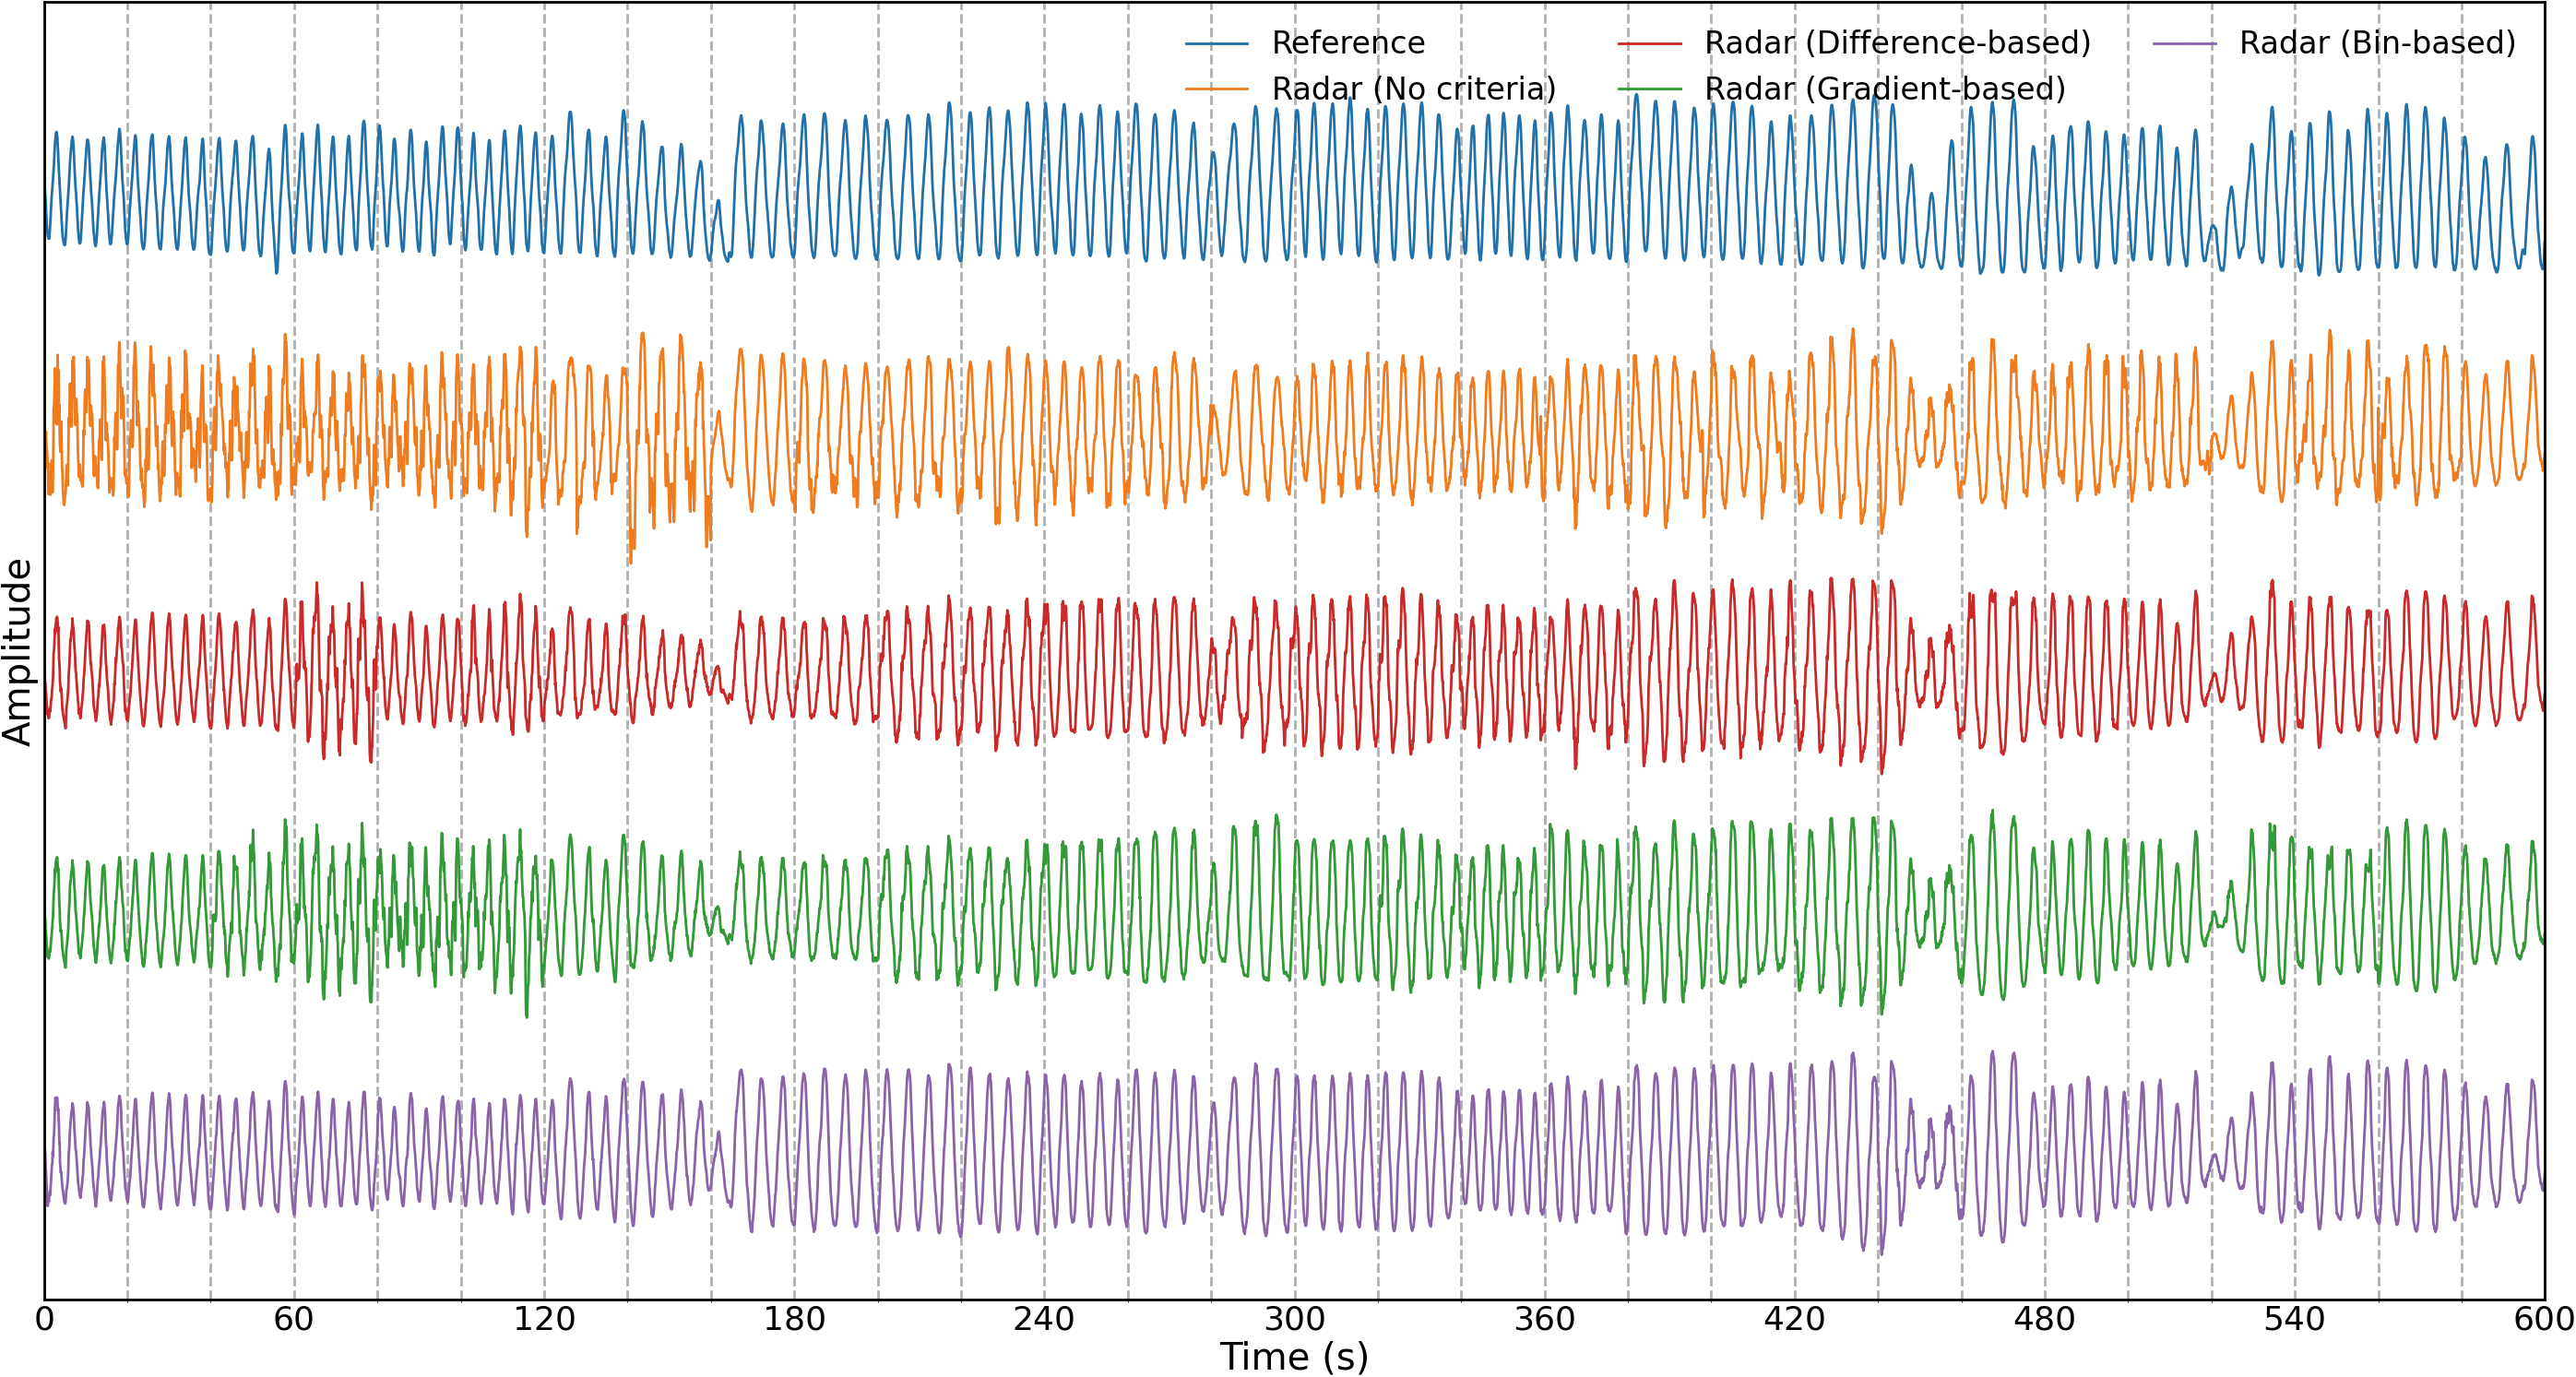
While the waveform constructed without selection criteria appears noticeably distorted in Fig. 7, especially at the 0- to 160-second points, the waveforms constructed using the proposed methods appear evidently less distorted in the same figure. This contrast reflects the discontinuity index value reduction effect shown in Table 2 (off observation interval boundaries). For the methods based on the difference/gradient-based selection criteria, estimated displacement values near the observation interval boundaries were used as judgment criteria. However, as explained earlier, these methods showed a certain degree of effectiveness in reducing waveform discontinuities even off the observation interval boundaries. Besides, a close look at the waveform constructed using the bin-based selection criterion reveals that it is less distorted than those constructed using the other selection criteria and that its amplitude change tendency in each observation interval is close to that of the reference waveform. Probably, this revelation reflects the effectiveness of the bin-based selection criterion with which less distorted, more stable waveforms can be obtained easily. The observations above confirm that, albeit with a limited number of subjects, all three proposed methods are effective in reducing waveform discontinuities, and the one using the bin-based selection criterion tends to exhibit the highest effectiveness among the three.
6. Conclusions
With a view to the application to measuring human respiratory waveforms using radar, this paper proposed waveform selection methods that can construct continuous waveforms with fewer discontinuities based on groups of waveforms estimated for observation intervals repeated at a predetermined cycle. This paper introduced a set of discontinuity indices for evaluating the effectiveness of the proposed methods. We performed a simulation to demonstrate that these indices work as intended. We applied the proposed methods to an experiment of measuring respiratory waveforms of multiple subjects using millimeter-wave radar for an indices-based evaluation, albeit with a limited number of subjects. The results showed that the discontinuities contained in the continuous waveforms of each subject were reduced whereby the effectiveness of the proposed methods was demonstrated.
The results obtained above only cover a limited number of subjects. Hence, the proposed methods need to be proven for effectiveness for larger numbers of subjects. The proposed methods premise that a normal respiratory waveform is discontinuity-free. However, when the respiration state somehow becomes anomalous, discontinuities may occur in the waveform, preventing it from getting selected. Therefore, in actual applications that estimate the conditions of a person based on a continuous waveform, the proposed methods must be further investigated for their influence on the estimation results. Given these challenges, we will consider deploying vital sign measurement using radar in the future.
References
- 1)
- Y. S. Can et al., “Stress detection in daily life scenarios using smart phones and wearable sensors: A survey,” J. Biomed. Inf., vol. 92, 103139, 2019.
- 2)
- A. L. Alfeo et al., “Sleep behavior assessment via smartwatch and stigmergic receptive fields,” Pers. Ubiquitous Comput., vol. 22, no. 2, pp. 227-243, 2018.
- 3)
- T. Hyuga et al., “Driver Status Monitoring System in Autonomous Driving Era,” (in Japanese), OMRON TECHNICS, vol. 50, no. 1, pp. 36-31, 2018.
- 4)
- J. Yin et al., “Depth Maps Restoration for Human Using RealSense,” IEEE Access, vol. 7, pp. 112544-112553, 2019.
- 5)
- G. Paterniani et al., “Radar-Based Monitoring of Vital Signs: A Tutorial Overview,” in Proc. IEEE, 2023, vol. 111, no. 3, pp. 277-317.
- 6)
- M. Alizadeh et al., “Remote Monitoring of Human Vital Signs Using mm-Wave FMCW Radar,” IEEE Access, vol. 7, pp. 54958-54968, 2019.
- 7)
- T. Koda et al., “Noncontact Respiratory Measurement for Multiple People at Arbitrary Loca-tions Using Array Radar and Respiratory-Space Clustering,” IEEE Access, vol. 9, pp. 106895-106906, 2021.
- 8)
- T. Penzel et al., “Cardiovascular and respiratory dynamics during normal and pathological sleep,” Chaos, vol. 17, no. 1, 015116, 2007.
- 9)
- H. D. Cohen et al., “The Effects of Stress on Components of the Respiration Cycle,” Psychophysiology, vol. 12, no. 4, pp. 377- 380, 1975.
- 10)
- T. Sakamoto, Wireless Human Body Sensing, (in Japanese), Ohmsha, 2023.
- 11)
- A. Albanese et al., “An integrated mathematical model of the human cardiopulmonary system: model development,” Am. J. Physiol. Heart Circ. Physiol., vol. 310, no. 7, pp. H899-H921, 2016.
- 12)
- B.-K. Park et al., “Arctangent demodulation with DC offset compensation in quadrature Doppler radar receiver systems,” IEEE Trans. Microw. Theory Tech., vol. 55, no. 5, pp. 1073-1079, 2007.
- 13)
- Q. Lv et al., “High dynamic-range motion imaging based on linearized Doppler radar sensor,” IEEE Trans. Microw. Theory Tech., vol. 62, no. 9, pp. 1837-1846, 2014.
- 14)
- H. Yamada, “High-Resolution Imaging Technology Using Millimeter-Wave Radar,” (in Japanese), Trans. Inst. Electron., Inf. Commun. Eng. B, vol. J104-B, no. 2, pp. 66-82, 2021.
- 15)
- K. Matsuura et al., “Realization of Multi-Person Respiratory Rate Measurement using Time-series Clustering with Millimeter-Wave Radar,” (in Japanese), OMRON TECHNICS, vol. 56, no. 1, pp. 97-104, 2024.
The names of products in the text may be trademarks of each company.