


Oxygen Gas Concentration Measurement in Trinary Mixture by Small Thermal Conductivity Gas Flow Sensor
- Thermal Gas Sensor
- Oxygen Concentration Measurement
- Trinary Gas
- MEMS
- Oxygen Concentrator
The demand for oxygen concentrators that support COPD (chronic obstructive pulmonary disease) patients will increase in the future. The device supplies oxygen generated by concentrating the surrounding air, and it is necessary to monitor the oxygen concentration in the gas for a stable supply. Therefore, we are developing the MEMS thermal flow sensor to apply to measuring the oxygen concentration. Generally, thermal sensors that identify gas components by measuring the thermal conductivity of the gas are relatively inexpensive and small. However, concentrated oxygen gas is a trinary gas composed of oxygen, nitrogen, and argon, and the oxygen concentration cannot be estimated by conventional methods of thermal sensors. In this paper, we report on the unique algorism we developed that makes it possible to estimate the oxygen concentration in a trinary gas by acquiring two thermal conductivity values at two different temperatures.
1. Introduction
Chronic obstructive pulmonary disease (COPD) is a symptom of a reduced respiratory function due to chronic pulmonary inflammation resulting from long-term exposure of the lungs to hazardous substances. In most cases, the cause is tobacco smoking. Although the proportion of smokers has been decreasing each year, smokers accounted for approximately 80 percent of the male population five decades ago. In recent years, with this generation of people being aged, the COPD death toll has been on the increase1). One of the guideline-recommended effective methods for coping with COPD is high-concentration oxygen inhalation to compensate for the reduced respiratory function2), and oxygen concentrators are used to take in ambient air and increase the oxygen concentration for this purpose. Large conventional indoor installation types have the drawback of narrowing the range of activities of patients. Meanwhile, the recent trends of placing importance on the improvement of the quality of life (QOL) of patients suggest an increase in future demand for compact, lightweight, portable types of oxygen concentrators2). Accordingly, OMRON has proposed applying a thermal flow sensor mounted with micro-electro mechanical system (MEMS) chips for miniaturization as a sensor for controlling the gas flow rate and the oxygen concentration in these products required to meet strict size specifications. The technical novelty of the proposed method lies in the application of the gas-type determination function of the sensor to the measurement of the oxygen concentration in ooxygen-nitrogen-argon gas mixtures. This paper presents a description of this method.
2. Operating principle of the MEMS thermal flow sensor
2.1 Structure and principle of the sensor chip
Fig. 1 shows an external view of the MEMS flow sensor chip, sized 1.55×1.55×0.4 mm thick. This section explains its structure and principle.
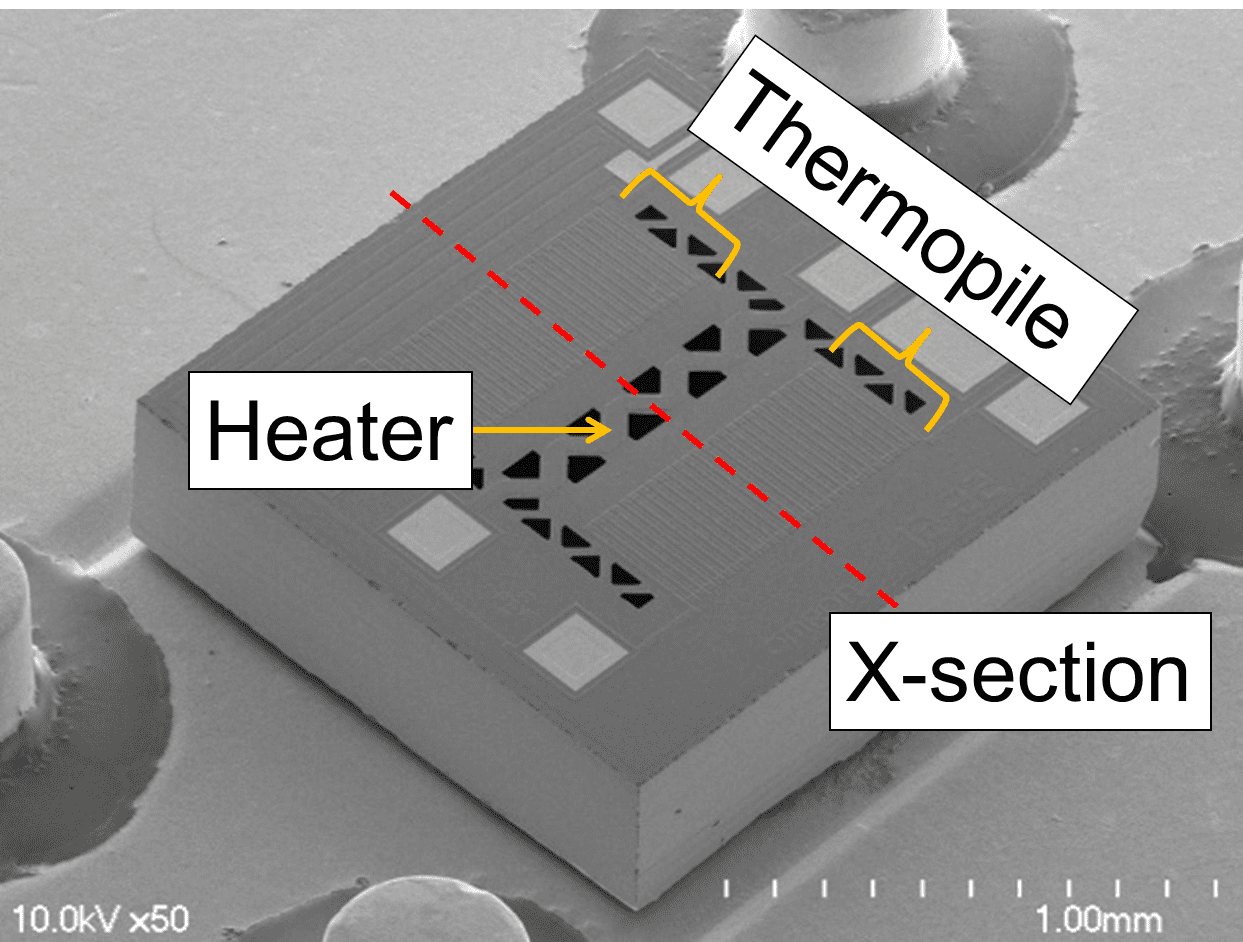
Fig. 2 shows a cross-sectional view of the structure indicated by the dotted line in Fig. 1 along with the thermal distribution change due to the airflow. The chip consists of a thin-film membrane for thermal insulation, a support, a centrally positioned heater, and thermopiles for detecting the temperature difference between the heater and the support.
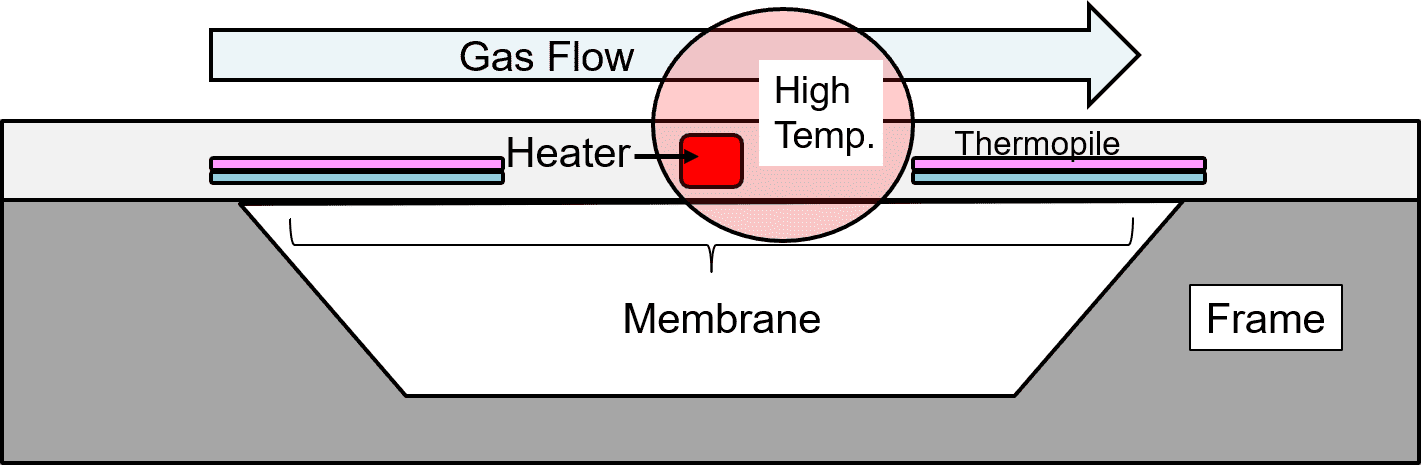
As Fig. 2 shows, when airflow parallel to the thermopiles occurs on the surface of the sensor chip, the heat generated by the heater shifts to the downwind side and causes a change in the temperature difference between the thermopiles on the upwind and downwind sides, resulting in an electromotive force difference. This electromotive force difference changes with the strength of the airflow and hence can be used for gas flow rate detection.
2.2 Principle of correcting the flow rate based on gas-type determination
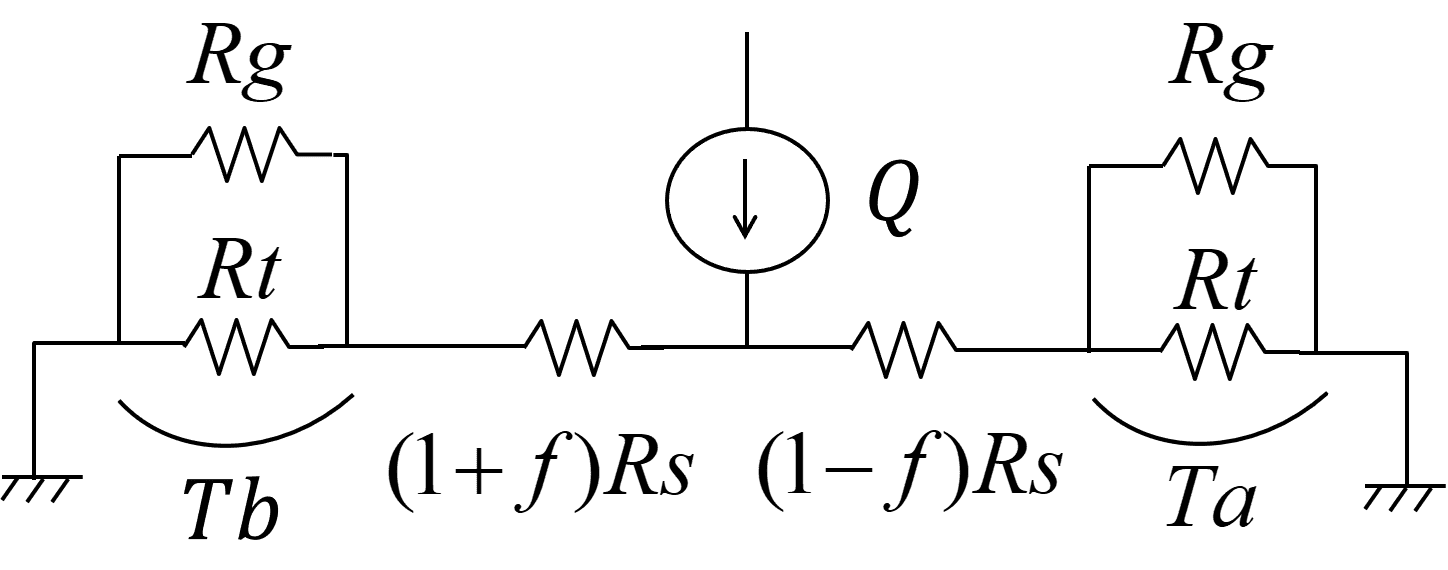
Gas-type determination takes advantage of the thermal properties of the gas. Hence, this section describes the principle of the flow sensor from the viewpoint of thermal design. Fig. 3 shows the heat equivalent circuit of the structure in Fig. 2:
See below for the definitions of the legends (with units in round parentheses):
-
 : Heating power of the heater
-
 : Coefficient of thermal resistance variation induced by the airflow (0 ≤ f
< 1)
: Coefficient of thermal resistance variation induced by the airflow (0 ≤ f
< 1)
-
 : Thermal resistance between the heater and the thermopiles
-
 : Thermal resistance of the thermopiles
-
 : Thermal resistance of the gas
-
 : Temperature difference between the ends of the thermopile (downwind)
-
 : Temperature difference between the ends of the thermopile (upwind)
The coefficient  variable by the airflow in Fig. 3 applies only to
  because heat shifts only between the heater and the thermopiles. A heat equivalent circuit can be handled in the same way as an electric circuit, which means that the use of Kirchhoffʼs Circuit Laws allows the determination of the relationship between and the thermopile outputs
  and
and  . Assuming that the total thermal resistance of the thermal path on the downwind side of the heater (the right half of Fig. 3) is
  , while that on the upwind side (the left side of Fig. 3) is
  , the equations corresponding to and hold as follows:


The heat flux  flowing through the path on the downwind side is expressed by equation (3), while is given by equation (4):


When equations (1) to (3) are combined by substitution into equation (4), the relational equation (5) between the downwind thermopile output and is derived. Similarly, equation (6) can be derived for the upwind thermopile output :
Equation for the downwind thermopile:

Equation for the upwind thermopile:

The actual thermopile outputs and , respectively, contain temperature offset noise, which causes errors. This is removed by subtracting the upwind output from the downwind output as follows for accuracy improvement:

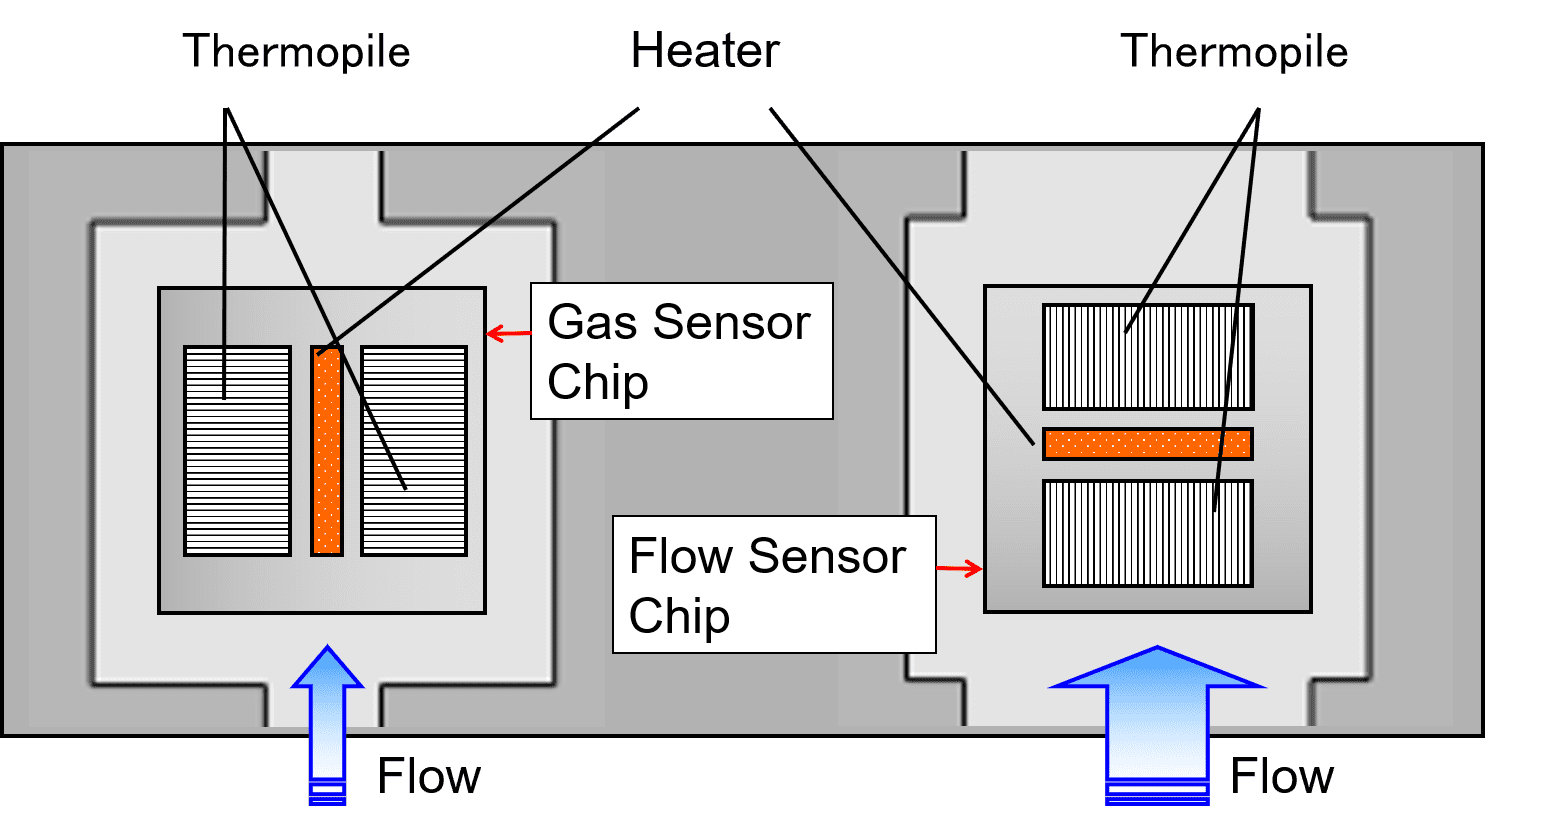
where  can be handled as a constant if the type of gas is invariable. If the variability is due to a change in the type of gas, needs to be determined separately. Therefore, as Fig. 4 shows, the flow sensor includes a second sensor chip mounted with thermopiles turned by 90° to be orthogonal to the airflow direction and uses this sensor chip for gas-type determination:
For the gas-type determination chip, equation (5), where is always 0, is modified into equation (8) to determine from the output  :
:

Its substitution into equation (7) results in equation (9), which determines :

With the relationship between and the flow rate being grasped in advance during calibration, the flow rate can be determined. The above is the principle of the flow sensor determining the flow rate. In the flow sensor for the oxygen concentrator, the mechanism of the gas-type determination chip for determining the thermal resistance of the gas is applied to oxygen concentration measurement.
3. Advantages of the MEMS thermal flow sensor
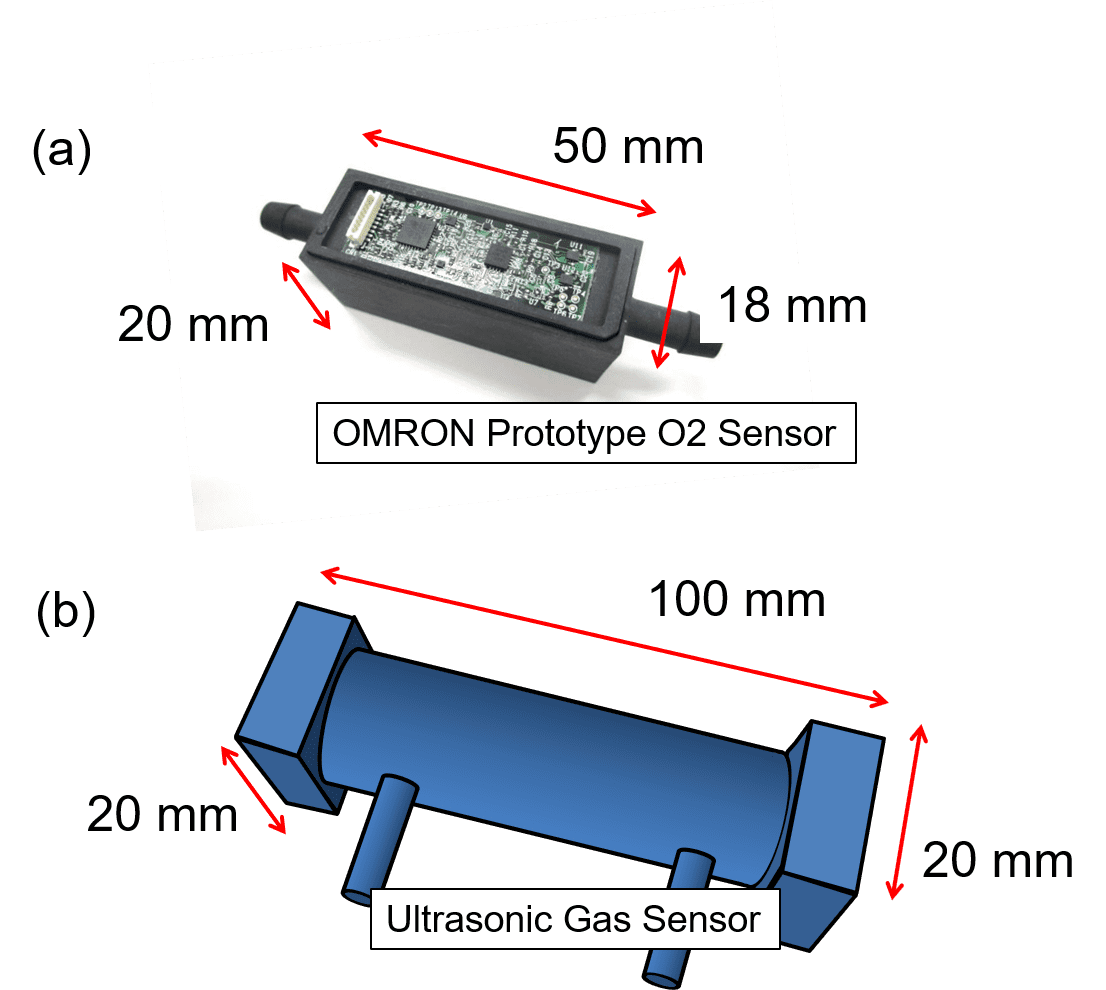
One of the advantages of thermal sensors is a relatively inexpensive price, and the MEMS type, in particular, has the advantage of miniaturization. Besides, the MEMS type also has a flow rate measurement function and hence can be said to have a very high added value. Table 1 compares typical oxygen concentration sensors. Although inferior in target error range to zirconia types, the MEMS type meets the standard for flow sensors for the oxygen concentrator:
| Type | MENS thermal type | Ultrasonic type | Zirconia type |
|---|---|---|---|
| Size (mm) | 50×18×20 | 100×20×20 | 17×17×19 |
| Cost |
 |
 |
|
| Concentration measurement tolerance |
±2% (target error range) |
±2% | ±0.5% |
| Flow rate detection | Available | Available | Unavailable |
Fig. 5(a) shows an external view of the prototype of the flow sensor for the oxygen concentrator, including its enclosure measuring 50 mm long, 18 mm wide, and 20 mm high (excluding the fittings). This enclosure contains two built-in sensor chips. Fig. 5(b) shows a conceptual image of an ultrasonic oxygen concentration sensor approximately twice longer in principle.
4. Application of the thermal sensor to oxygen concentration measurement
4.1 Mechanism of the oxygen concentrator
Fig. 6 shows a block diagram of the oxygen concentrator, which consists of two sieve bed filters that take in compressed air from an air compressor and selectively adsorbs nitrogen therefrom to feed concentrated oxygen gas via a downstream system to the patient.
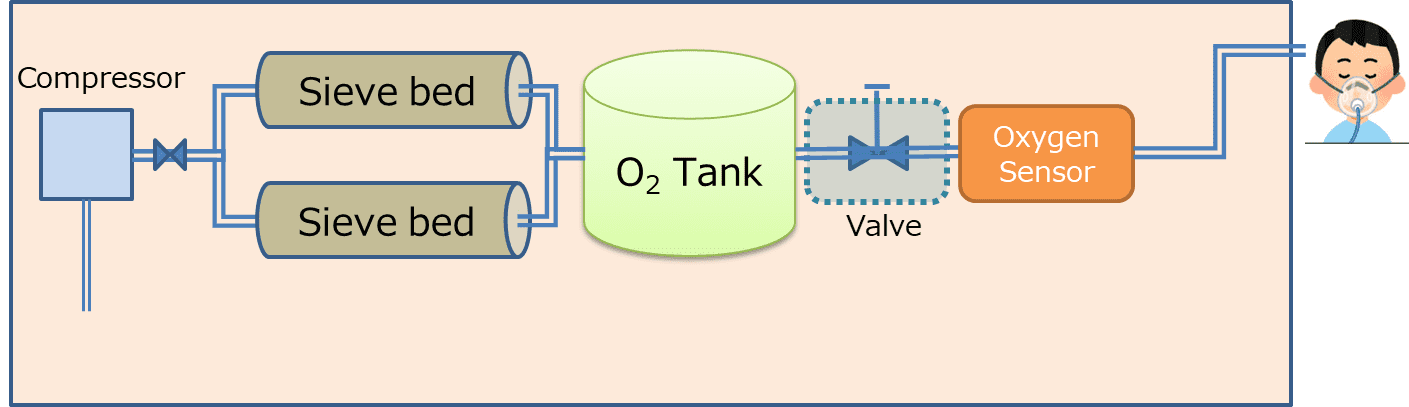
The sieve beds experience a decrease in the nitrogen adsorption rate over time and hence need to be replaced at a point in time when the oxygen concentration in the concentrated gas decreases because of the increase in nitrogen mix ratio over long-term continuous use. The oxygen concentration sensor is used to detect a change in the oxygen concentration in the concentrated gas and to prompt the replacement of sieve beds at the appropriate time.
4.2 Principle of concentration measurement of binary gas mixtures by the thermal sensor
This section describes the mechanism that determines the concentration of a binary gas mixture by measuring its thermal conductivity. The oxygen concentrator has a design that assumes a gradual increase in the mixing ratio of nitrogen to oxygen. In an atmosphere at 23℃, oxygen and nitrogen each have a thermal conductivity different from that of the other, with that of the former being 0.0265 W/(mK) and that of the latter being 0.026 W/(mK).
Therefore, the thermal conductivity and oxygen concentration in a gas containing a certain ratio of N2 are in a one-to-one correspondence with each other. It follows then that if the thermal conductivity of the gas is measurable, the oxygen concentration can be determined. The actual concentrated gas is, however, not a binary gas mixture consisting of oxygen and nitrogen but a ternary gas mixture containing a trace amount of argon. Where the ratios of the three components of the gas are variable, this method cannot determine the oxygen concentration. Hence, OMRON devised a new algorithm able to solve this problem. The next chapter first describes the effect of argon mixed in the concentrated oxygen gas.
5. Effect of argon mixed in concentrated oxygen gas
Typical air consists of approximately 78% nitrogen, 21% oxygen, and 1% argon. The oxygen concentrator consists of two sieve beds, each containing adsorbent, and selectively adsorbs nitrogen from the incoming air to increase the oxygen concentration. The adsorbent consists mainly of zeolite and adsorbs nitrogen, using the difference between nitrogen and oxygen in the interaction between the ion polarity of the zeolite grid and the quadrupole moment of the gas3). Under this principle, most of the argon component is mixed in the concentrated gas without being adsorbed. As a result, the ratio of argon after concentration increases to 4.11%, as shown in Fig. 7.
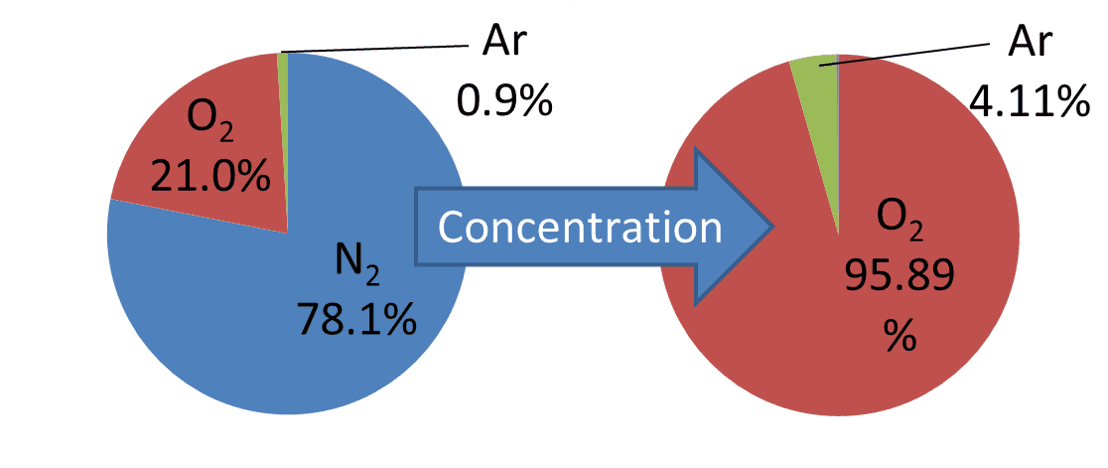
Where only nitrogen is removed, the ratio of argon to oxygen supposedly remains unchanged from 4.29% before and after concentration. In reality, this ratio is known to be variable due to some oxygen adsorption. Besides, the adsorption performance of the zeolite deteriorates mainly because of the moisture in the ambient air4). Consequently, nitrogen is also mixed in, resulting in a ternary concentrated gas. Fig. 8 compares the thermal conductivities of the component gases and shows that as compared with nitrogen, argon differs significantly in thermal conductivity from oxygen.
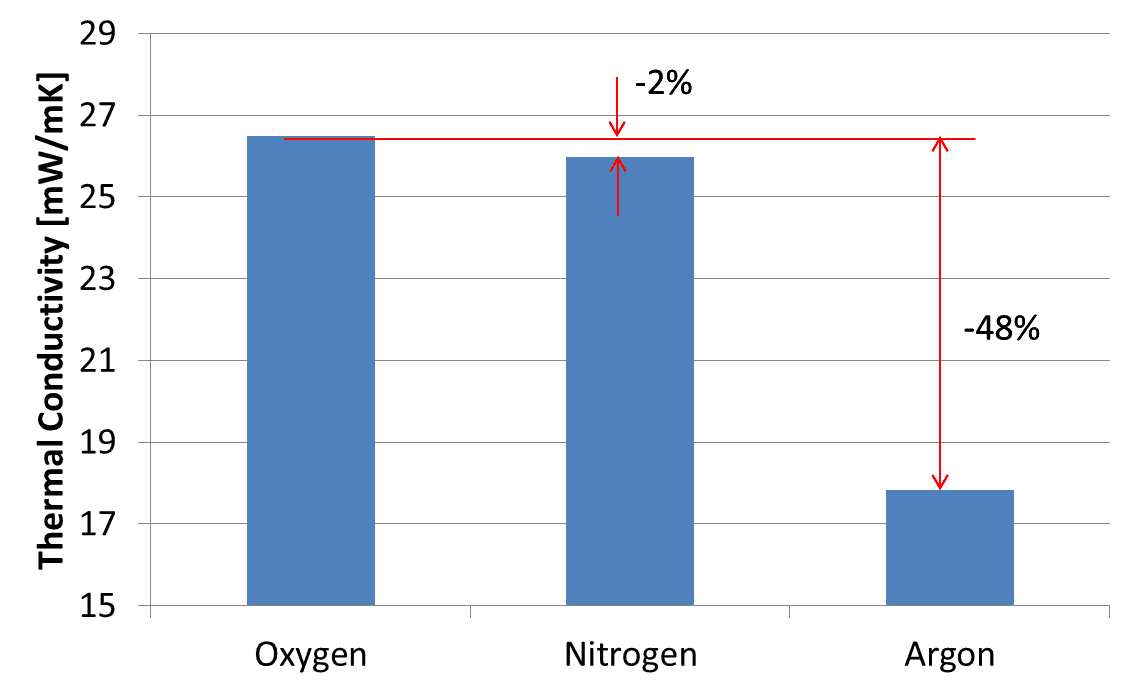
Therefore, although the approximately four percent argon ratio is smaller than the oxygen ratio, its effect is not negligible. Hence, OMRON developed an algorithm able to calculate oxygen concentrations in ternary gas mixtures passed through the thermal sensor.
6. Thermal sensing technology for measuring the oxygen concentration in ternary gas mixtures
6.1 Principle of measurement
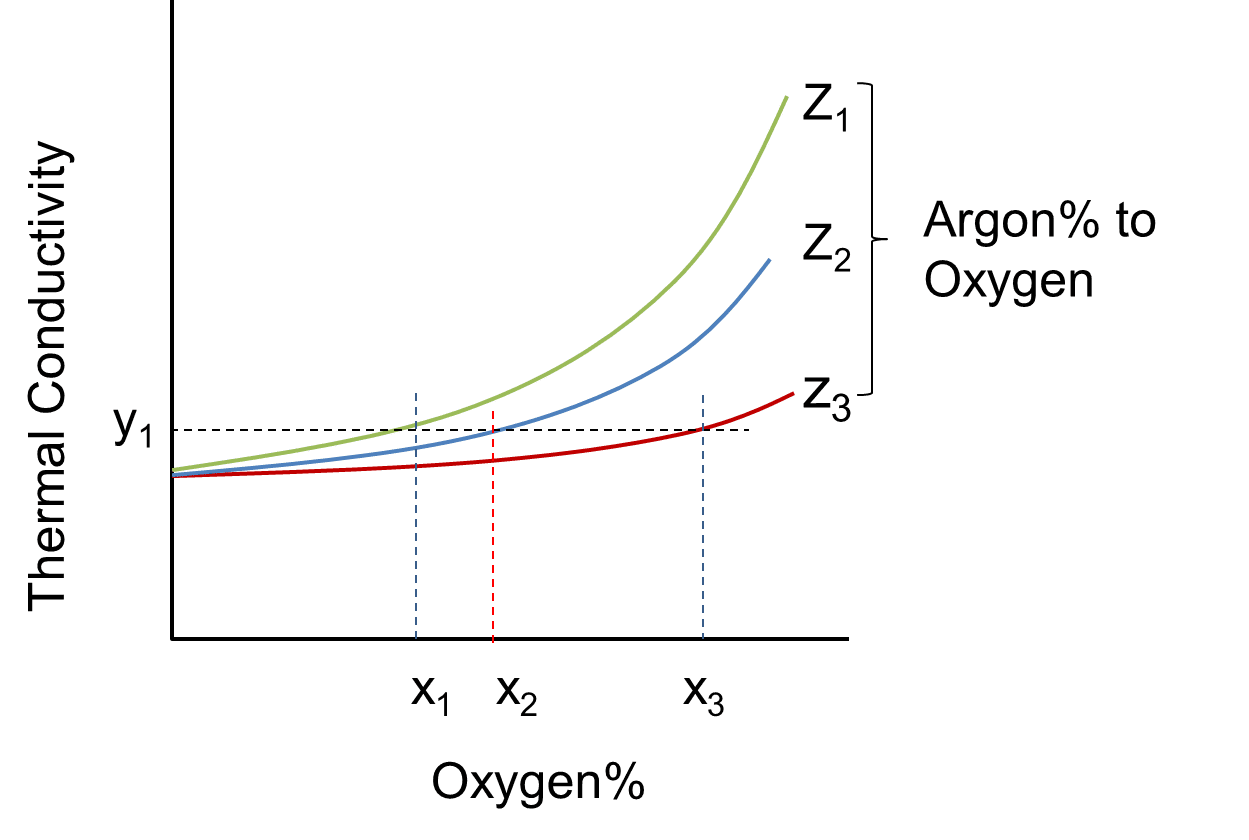
Fig. 9 shows the relationship between the composition ratio and thermal conductivity in the ternary gas mixture. Here,  is the oxygen concentration,
  is the ratio of argon to oxygen (hereafter simply “argon ratio”), and the remaining 1− (1+) is the nitrogen concentration. The correlation curve between the concentration and thermal conductivity of oxygen varies depending on the argon ratio. Accordingly, even if the thermal conductivity of a gas of a certain composition ratio is obtained by the thermal sensor, the oxygen concentration cannot be determined. If the argon ratio in Fig. 9 can take, for example, any of the three values
  ,
,  , and
, and  for the thermal conductivity
  , the oxygen concentration can also take any of
  ,
,  , and
, and  and cannot be narrowed down to one of them.
Therefore, the thermal conductivity  should be obtained at the temperature
  different from the temperature
  at which has been obtained. Fig. 10 shows a conceptual plot of the thermal conductivity curves obtained under the two temperature conditions.
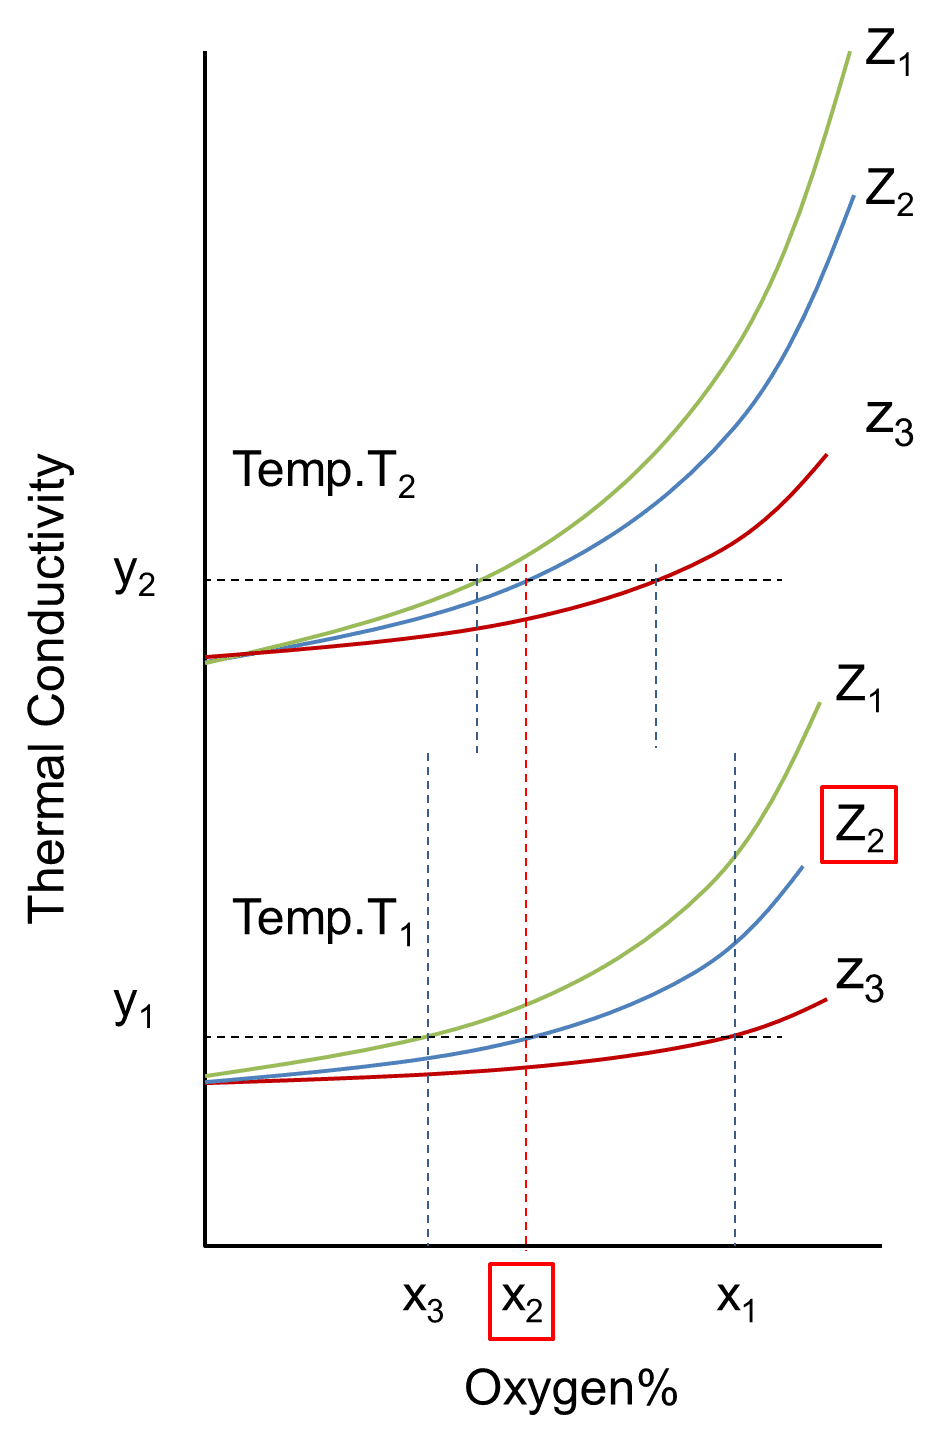
Because the thermal conductivity of the gas has gas composition-specific temperature characteristics, the curves obtained at the temperatures and change differently from each other depending on the composition ratio. Accordingly, the oxygen concentration common to and can be identified as  . In this connection, the argon ratio is also identified as
  , and hence the argon concentration is ×, with the rest being the nitrogen concentration, thereby revealing the composition ratios of the three components.
6.2 Calculation algorithm
In reality, the argon ratio can take a random value. This section describes the algorithm able to determine this value. Let the oxygen concentration and thermal conductivity in a mixed gas be and  , respectively. Let us assume that the thermal conductivities and are obtained at the temperatures and , respectively. The relationship between oxygen concentration and thermal conductivity is expressed by a quadratic equation. Hence, the following two equations are obtained, each with a coefficient different from that of the other:


where  and
and  are the known thermal conductivities of pure nitrogen at the temperatures and when the oxygen ratio is 0%. Accordingly, the unknown quantities in equations (10) and (11) are the five of
  , and
, and  . Here,
  and
and  are each a function of the argon ratio , i.e.,
  and
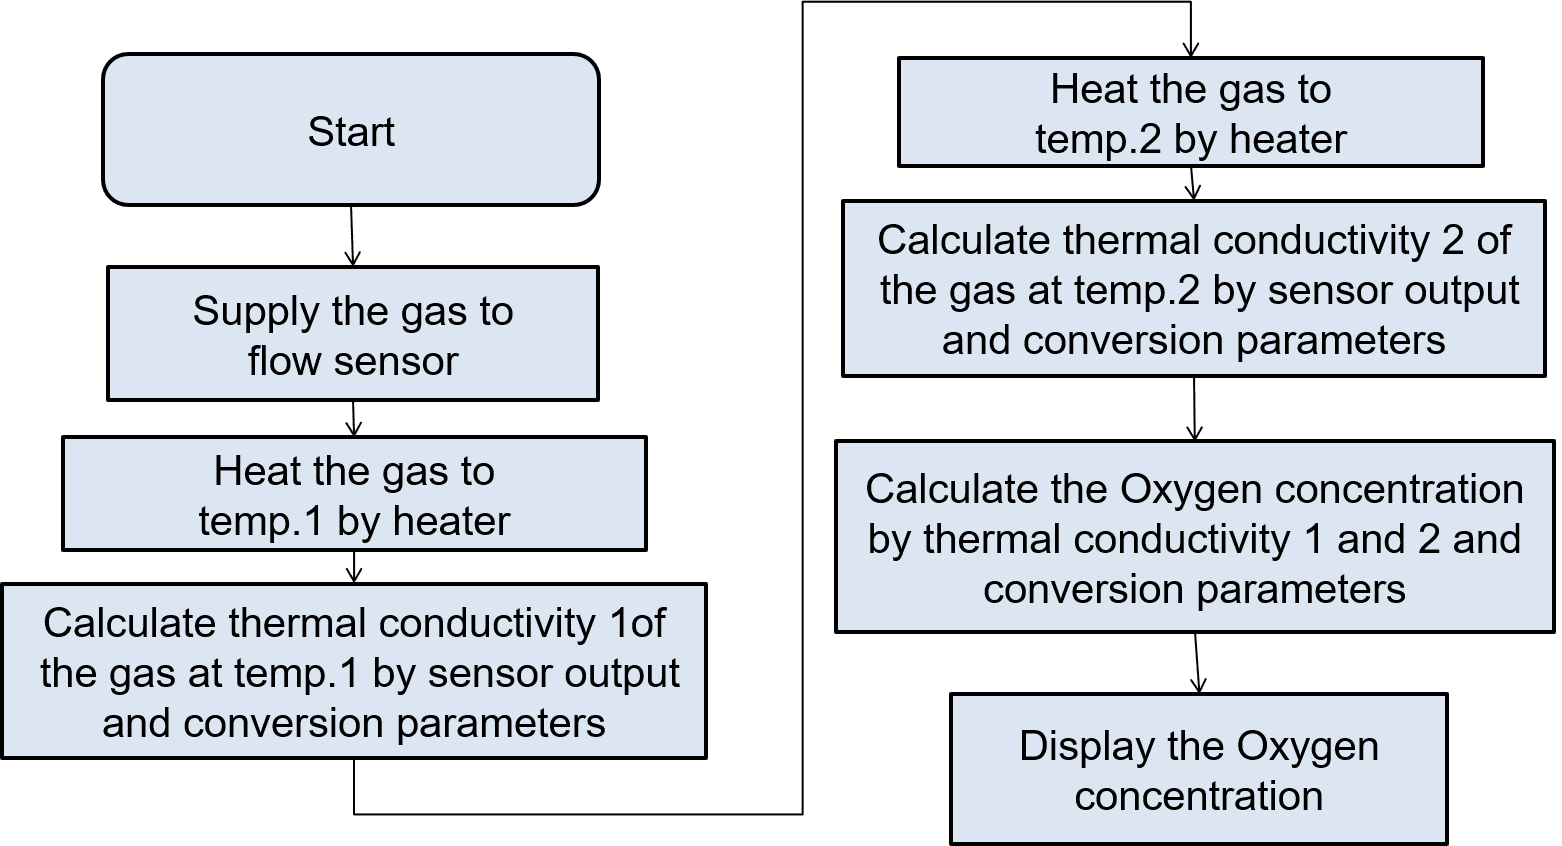
and  . Then, if these two are obtained in advance during calibration, the unknown quantities calibration can be reduced to the two of and . It follows then that these unknowns can be determined by solving the simultaneous equation of equations (10) and (11) above. Note that in the ternary oxygen-nitrogen-argon system, is a non--dependent constant while is a linear function of . An actual workflow would typically go as follows: Store in a device, such as a microcontroller, the function parameters identified through calibration; then, change the heater output and hence the temperature to obtain the two thermal conductivities. The required number of significant digits of the function parameters for the sensor sensitivity available at present is four and poses no problem to the storage capacity of the microcontroller. Fig. 11 shows the calculation flow chart.
6.3 Experimental oxygen concentration measurement in ternary gas mixtures
The algorithm described above was applied to an experiment to test its ability to determine the oxygen concentration in an actual ternary gas mixture. Fig. 12 shows a block diagram of the evaluation system:
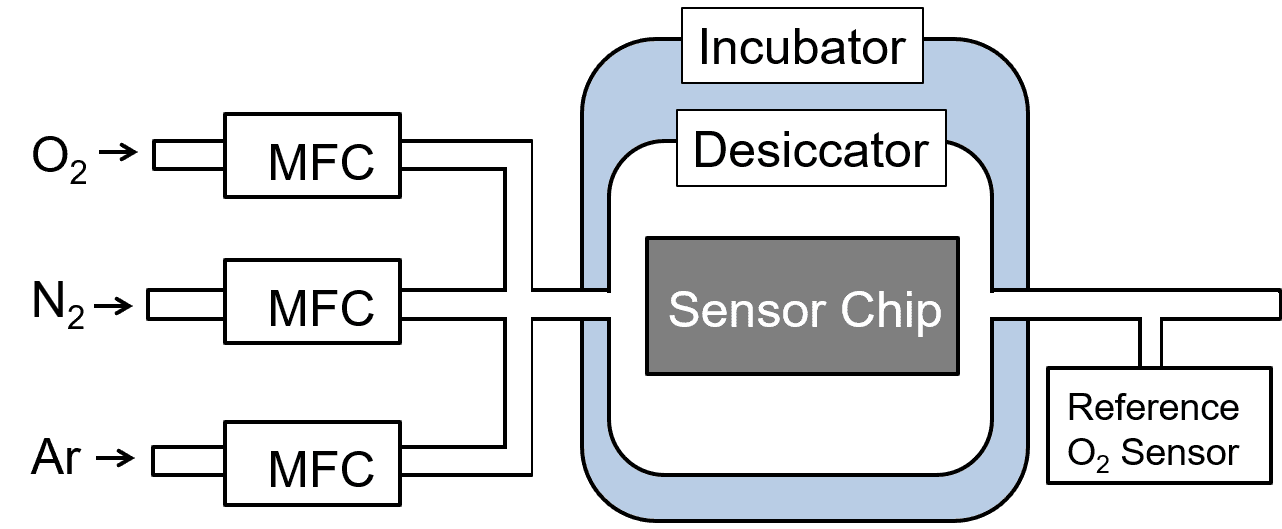
With the oxygen, nitrogen, and argon pipes connected, the flow rate ratio for each component gas was changed at the mass flow controller (MFC) to adjust the composition ratio in the ternary gas mixture. This gas was introduced into a desiccator containing a sensor chip to compare the measurement results with the readings by the reference oxygen concentration meter downstream. The experimental protocol is as follows:
- Sample: Sensor chip contained in a ceramic package
Number of samples to be tested: 1
Ambient temperature: 25°C
Composition of the gas under measurement: When the ratio of argon to oxygen in the oxygen-nitrogen-argon gas was set to the four levels of 4%, 5%, 6%, and 7%, the oxygen concentration at each level was adjusted from the maximum value to 0%. Table 2 shows the case for an argon ratio of 4%, where the argon ratio remained constant at 4% while the argon concentration changed depending on the oxygen concentration.
| No. | O2% | Ar% | N2% |
|---|---|---|---|
| 1 | 96.15% | 3.85% | 0% |
| 2 | 94% | 3.76% | 2.24% |
| 3 | 92% | 3.68% | 4.32% |
| 4 | 90% | 3.6% | 6.4% |
| 5 | 85% | 3.4% | 11.6% |
| 6 | 82% | 3.28% | 14.72% |
| 7 | 80% | 3.2% | 16.8% |
| 8 | 78% | 3.12% | 18.88% |
| 9 | 75% | 3% | 22% |
| 10 | 70% | 2.8% | 27.2% |
| 11 | 50% | 2% | 48% |
| 12 | 0% | 0% | 100% |
Gas flow rate: 10 L/min
Time required for the gas concentration to stabilize: 2 min
Heating temperatures of the heater: 135℃ and 78℃
Number of output measurements to be taken: 50 points per condition
Instrumental error of the reference oxygen concentration meter: ±0.1%
6.4 Evaluation results
Fig. 13 shows the error distribution for the oxygen concentrations calculated first using the conventional binary system approach for the data obtained by changing the argon ratio from 4% to 7%. More specifically, all these errors were obtained from calculations performed based on an assumption of a binary gas mixture consisting of argon-oxygen and nitrogen with an argon ratio of 4%.
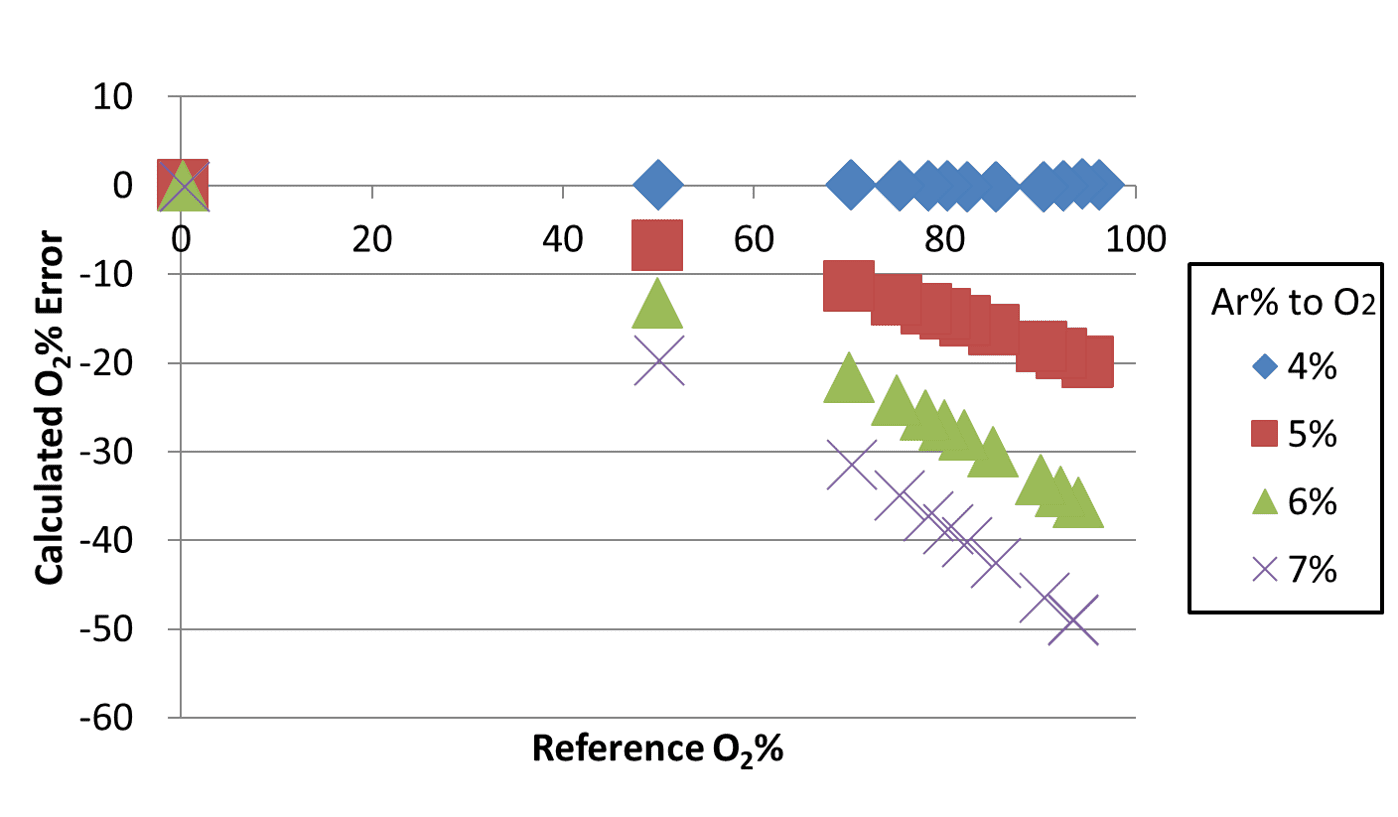
In this method, a change in the argon ratio by 1% caused an error of up to approximately 20% in the oxygen concentration. An argon ratio of 7% resulted in an error of approximately 50%. These errors occurred because the thermal conductivity of argon-oxygen per se changed because of the change in the argon ratio, contrary to the assumption of the binary system where the thermal conductivity of the gas changes only from the mixing ratio with nitrogen while the argon-oxygen component remains unchanged. For comparison, Fig. 14 shows the error distribution for the oxygen concentrations determined using the algorithm for calculating the oxygen concentration in ternary gas mixtures.
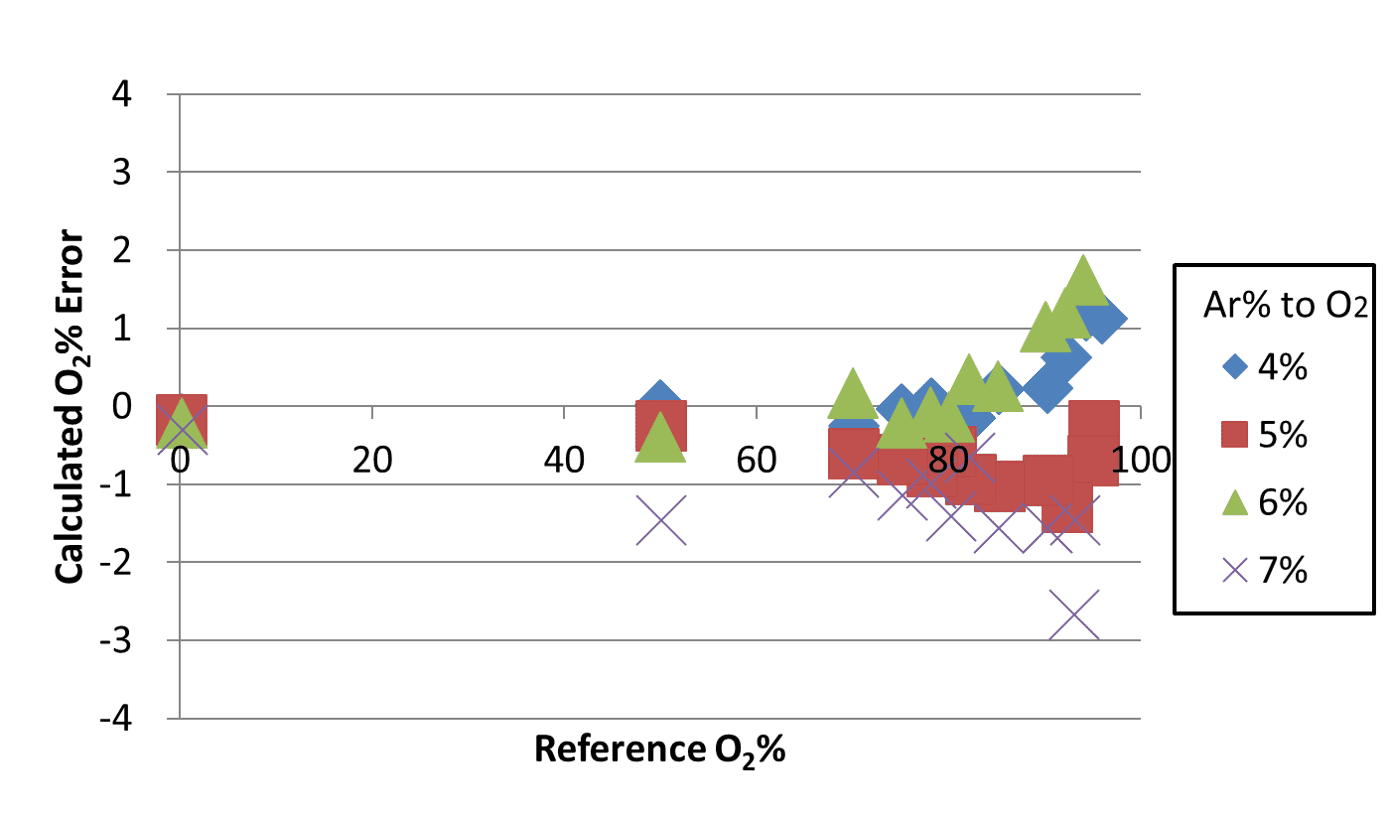
When this algorithm was applied, the resulting errors fell within a range from +2% to −3%. From the actual sensor outputs obtained for ternary gas mixtures using the evaluation system as explained above, the algorithm determined oxygen concentrations within an error range from +2% to −3%. OMRON has applied a patent for this technology (Japanese Patent Application No. 2019-152361).
7. Conclusions
A thermal sensor advantageous in size and cost would significantly contribute to improving the usability of oxygen concentrators for oxygen concentration monitoring. Because the gas to be measured consists of three components, this goal, however, has not been achieved thus far. The algorithm devised this time is a technology able to achieve the goal. In addition, when used in combination with MEMS technology, the algorithm is expected to realize a thermal sensor approximately half the size of conventional sensors at low cost. A compact oxygen concentrator would lead to improvements in the QOL of COPD patients, to which a compact sensor would contribute. The sensor currently under development has a problem with sensitivity. Toward its practical use, efforts are underway on its sensitivity enhancement.
References
- 1)
- General Incorporated Association GOLD Japan Committee, “COPD Information Site” (in Japanese), http://www.gold-jac.jp/copd_facts_in_japan/, (accessed Jan. 17, 2019).
- 2)
- K. Shigeru, “Current State and Future of Home Oxygen Therapy” (in Japanese), Medical Gases, Vol. 14, No. 1, pp. 99-103, 2012.
- 3)
- Y. Satoshi, H. Shigeru, and N. Masao, “Nitrogen and Oxygen Adsorption Properties of Ion-exchanged LSX Zeolite” (in Japanese), Kagaku Kogaku Ronbunshu, Vol. 30, No. 4, pp. 461-467, 2004.
- 4)
- T. Ayao and M. Yoshihiro, “Production of Oxygen-Enriched Air by Use of Selective Adsorption of Nitrogen on Itaya-Zeolite” (in Japanese), Journal of the Society of Materials Science, Japan, Vol. 28, No .312, pp. 794-797, 1979.
The names of products in the text may be trademarks of each company.