


Fast and Automatic Lighting Parameters Determination Technology for Visual Inspection
- Lighting
- Lighting conditions
- Visual inspection
- Phased search
- MDMC
In the visual inspection of the substrate, the crystal structure becomes irregular when the electrode is in the form of a thin film, causing an inconsistent color in the reflection characteristics when imaging is performed using coaxial lighting. The inconsistent color makes it difficult to detect discoloration defects, which can be improved by optimizing the angle and intensity of light applied to the substrate. Because this process can be time consuming even for an experienced worker, an automatic method has been devised. Conventionally, optimization is performed heuristically until the termination condition is satisfied after all the combinations that can be taken as parameters are thinned out. However, this method needs a long optimization time, which is proportional to the number of lighting parameters. In this paper, we propose a high-speed, highly-accurate method based on a stepwise search for uniform illumination parameters.
1. Introduction
In recent years, advanced driving assistant system (ADAS) and automated driving are coming into general use in the automotive market. These functions are controlled by automotive substrate (hereafter “substrates”). Failure of these functions may affect the safety of human life. Hence, zero defects (zero non-conformities) are a mandatory requirement.
Unlike conventional substrates, these substrates must undergo 100-percent inspections rather than sampling inspections. Foreign matter on substrates can cause short-circuiting between terminals due to vibrations when traveling thus leading to an eventual failure. Hence, for substrates, visual inspection is also indispensable besides functional verification. In a conventional visual inspection, inspectors used to perform visual inspections of substrates by eyesight while changing the lighting condition by tilting each substrate to different angles. Naked-eye visual inspections, however, can be affected by the inspectorsʼ skills or degree of fatigue, making it difficult to maintain stable quality. Thus, needs are growing for automated inspection by visual inspection machines.
A visual inspection machine has a built-in camera (lens) and light source, both of which require parameter settings to suit the substrate or the defects to be inspected. Among such parameters are lighting parameters. Lighting parameters are used to determine the amount of light projected on the substrate surface.
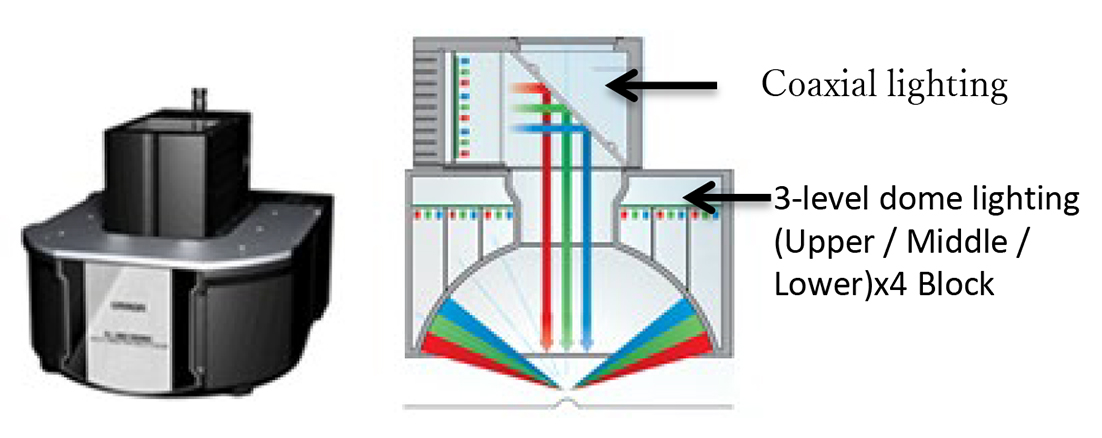
OMRONʼs VT-M12 Series visual inspection machines are equipped with an MDMC (Multi-Direction, Multi-Color) light (Fig. 1) as the lighting device. The distinction of the MDMC light is that it allows the switching of the light to be projected on the substrate between 13 different directions (coaxial lighting+three levels of dome-shaped lighting×4 block), imitating the way an inspector tilts the substrate to change the lighting conditions. Besides the lighting direction, the MDMC light allows the adjustment of light intensity (RGB (three wavelengths in all, each with 127 steps)) as the input to a total of 39 channels (ch) of lighting parameters in 13 directions and in three wavelengths. These settings must be made to suit the substrate to be inspected or the non-conformity to be detected. The number of available combinations amounts to as many as 12739. The right combination of lighting parameters can only be found through trial and error by changing lighting parameters. This parameter combination selection task is time-consuming even for knowledgeable and skilled workers and needs to be improved into a non-skill-dependent, time-saving one.
Efforts have been underway to develop automatic lighting-parameter determination as the solution to the above challenges. The outcome of one such effort is a method that determines lighting parameters based on simulated measurements of the Bidirectional Reflectance Distribution Function (BRDF). The only way to achieve a complete BRDF measurement would be to place the object under inspection in an omnidirectional lighting environment and observe the reflected light in all lines of sight. Its realization is, however, physically difficult1). Therefore, some methods have been proposed that simplify the problem by assuming that the surface under inspection has uniform reflection characteristics to provide a reflection coefficient as a parameter2)-3). With these methods, however, it is difficult to obtain the BRDF of a materially non-uniform object under inspection. Another alternative is provided by the method proposed by YUKISAWA et al.4) Its idea is to define the optimal conditions for the desired lighting parameter and then switch lighting parameters one after another with the lighting kept on experimentally to obtain evaluation values and find the lighting parameter with the best evaluation value. In this method, however, the processing time increases proportionally to the number of combinations. Hence, when the number of combinations is large as is the case with the MDMC light, the method developed by YUKISAWA et al. takes a problematically long time to determine the lighting parameters. This problem can be fixed by reducing the sampling size to shorten the processing time. The resulting lighting parameter, however, will have a lower evaluation value.
On the basis of the above method used with the lighting kept turned on experimentally, this paper proposes a method that can determine lighting parameters rapidly with high accuracy by dividing the optimization process into the two steps of coarse search and detailed search.
2. Technical details
2.1 Overview
Fig. 2 shows the flow up to lighting-parameter determination. First, a tentative lighting parameter is used to capture images of the substrate containing a defect to be detected (Fig. 2(a)). As long as the defect and the conforming part in the captured image can be distinguished on the screen by naked-eye observation, the lighting parameter at this point is acceptable and has no influence over the one to be automatically determined. Then, for the defect and the conforming part, their respective areas (zones) are specified (Fig. 2(b)). The lighting parameter to be determined is intended for the zones specified here. Its optimality, however, may vary depending on the algorithm applied to the image for acceptability judgment at the time of inspection. In other words, evaluation axes must be defined for determining the acceptability of the lighting parameters. For the explanatory purpose here, let the algorithm be one such that discriminates between the conforming part and the defect based on the concentration difference. Then, let us assume that from among the combinations of lighting parameters, the one with the largest concentration difference between the conforming part and defect (called “evaluation value”) is the optimal lighting parameter.
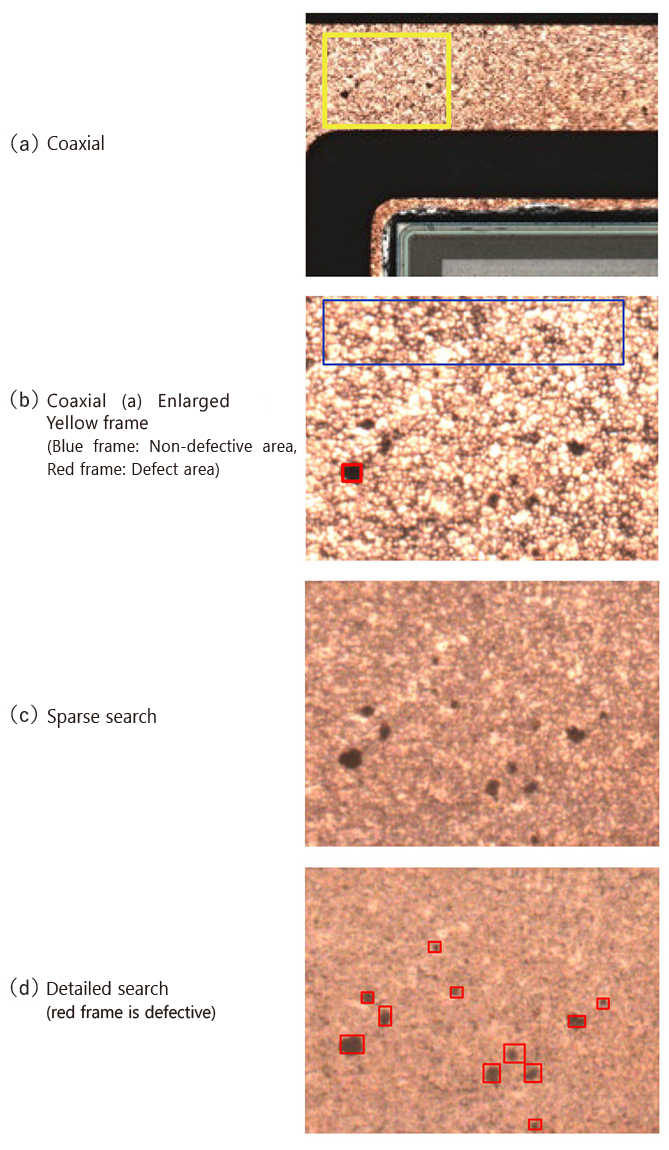
In the case of the MDMC light, the number of the combinations of lighting conditions amounts to 12739 (= Steps 0 to 127×12 ch). In other words, the lighting parameter determination process searches from these combinations the pattern with the largest concentration difference between the conforming part and defect. Assuming that it takes 0.07 seconds to determine the concentration difference per image capture, the required time amounts to 1.1×1082 (12739×0.07) seconds, it then follows that the searching cannot be completed in a realistic time frame. Then, from the above set of combinations, an N-number of combinations is sampled to determine a tentative optimal evaluation value from among the N-number of combinations of lighting parameters (this search is called a “coarse search”) (Fig. 2(c)). The neighborhood of the lighting parameter for the evaluation value obtained here is searched to determine the lighting parameter (Fig. 2(d)).
2.2 Defining the evaluation axes and evaluation value
To determine a lighting parameter, evaluation axes must be defined with which the optimality of the lighting parameter is determined. This evaluation axes may differ depending on the algorithm to be employed for acceptability judgment.
Let us take as an example here the discoloration defects, which are defects typically encountered in a visual inspection. These defects occur on the substrate surfaces and take the form of solder residue or any other adherent not included in the design. The simplest algorithm for detecting these defects is binarization. In other words, to make an absolutely correct pass/ fail judgement by a method that uses as feature quantities the concentration of a non-defective portion and that of a defective portion, the non-defective portion and the defective portion must have a concentration difference. This relationship can be expressed by the equation below. For the sake of explanatory simplicity, let the image here be a gray-scale image with no concentration variation in the non-defective portion and the defective portion:

where  is the average pixel value concentration of the nondefective portion,
  is that of the defective portion, and Score is the evaluation value. The greater the
  , the better separated the two portions and the better the lighting parameter. In other words, the evaluation value is a formal representation of the easiness for the defect detection algorithm to discriminate between the conforming part and the defect.
2.3 Coarse search
Coarse search is a process of obtaining a neighborhood value for the optimal lighting parameter from a massive number of lighting parameters. In the case of the MDMC light, the number of combinations of lighting parameters is as large as 12739. Hence, a constraint is specified to reduce the number of combinations.
Although the MDMC dome-shaped lighting device consists of a top stage, a middle stage, and a bottom stage, with each stage divided into four blocks, all these blocks are handled collectively as a single block. Moreover, a constraint that red, green, and blue (RGB) change simultaneously at the same rate (= white) is added to reduce the number of combinations. In other words, the three RGB channels are handled collectively as a single channel (gray-scale) to reduce a total of 39 channels to four (coaxial/top stage/middle stage/bottom stage: white). Thus, the number of combinations is reduced from 12739 to 1274. Furthermore, an N number of light intensity steps are sampled out of 127 steps. The number N is a parameter and, if set small, can reduce the sampling size and the processing time. The optimization result is, however, a locally optimal value. The sampling method is one with the light intensity Steps 0 to 127 divided at equal intervals into N steps, in other words, a method of changing light intensity in increments of 128/(N−1). This paper sets N = 5 and changes the light intensity in increments of 32 {128/(5−1)}. In other words, the light intensity is changed from 0 to 32, 64, 96, and 127 (rounded from the naturally expected 128 because the upper limit is 127). As a result, the number of combinations is reduced from 12712 to 54. The time required to determine the optimal value from among these combinations of lighting parameters is approximately 43 seconds (54×0.07 seconds) if the time required to determine the evaluation value per cycle is 0.07 seconds. First, from among these, the highest tentative evaluation value should be determined.
In other words, what coarse search means is that while the evaluation value takes only one peak from all the combinations (Fig. 3 [red circle]), there are more than one near-peak value (called “spike” here) (Fig. 3 [green circle]). Coarse search is a process used to find the highest spike.
2.4 Detailed search
The lighting parameter obtained by the coarse search was found from among sampled combinations and hence may not be the peak of the evaluation value (hereafter “optimal value”). Hence, the optimal value should be searched for. The basic idea is that this is a problem of finding the optimal value from a size-128 four-dimensional space because there are 127 light intensity steps for each of the four angle channels. The neighborhood of the optimal value has been identified by the coarse search and is used as the starting point for the search below.
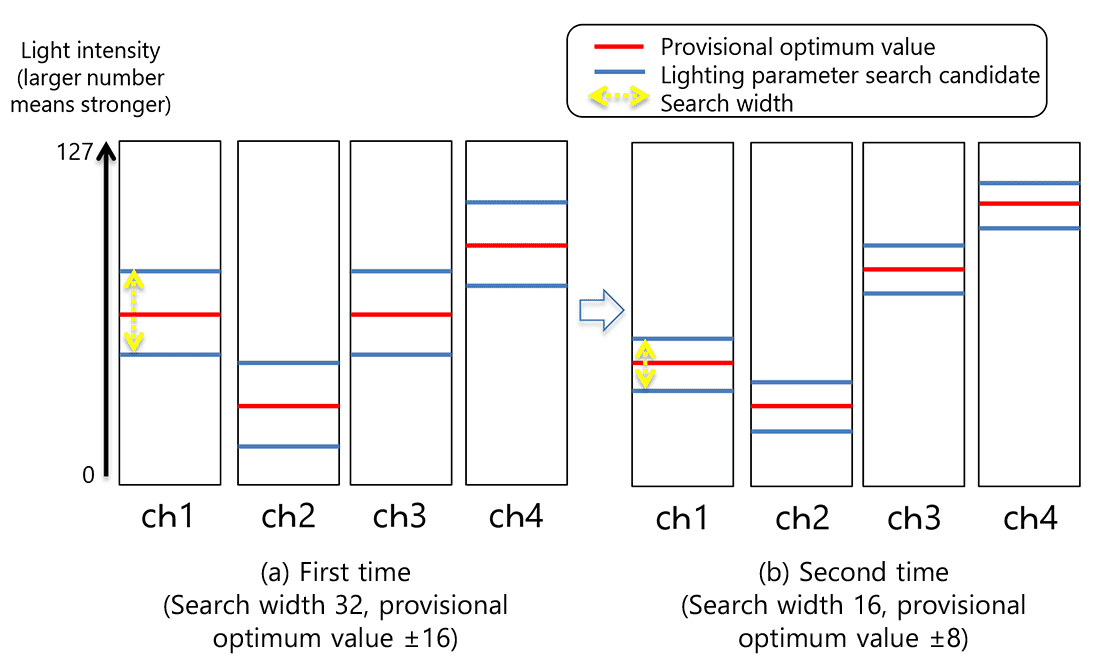
Let us take Fig. 4 as illustrative example to see the flow of the process. In Fig. 4, the vertical axis represents the light intensity, while the horizontal axis represents the channel (lighting angle). The lighting parameter obtained by the coarse search is shown by the red line in Fig. 4(a). In the coarse search, sampling was changed in multiples of 32 steps when  = 5. Accordingly, the optimal value lies in the ±32-step range of the red line. The optimal value is searched for according to the concept of the binary search method. First, ± 16, one-half of ±32 steps, is used as the initial value for the search width (Fig. 4(a) yellow arrow). Then, the evaluation values for +search width, 0, and −search width of the tentative optimal value (red line) for each channel are determined. The lighting parameter for the smallest evaluation value is used as the next tentative optimal value (Fig. 4 (b) red line). This process is repeated until the search width is 1 or less. Then, the
number of evaluation value determinations is given by the following equation.
= 5. Accordingly, the optimal value lies in the ±32-step range of the red line. The optimal value is searched for according to the concept of the binary search method. First, ± 16, one-half of ±32 steps, is used as the initial value for the search width (Fig. 4(a) yellow arrow). Then, the evaluation values for +search width, 0, and −search width of the tentative optimal value (red line) for each channel are determined. The lighting parameter for the smallest evaluation value is used as the next tentative optimal value (Fig. 4 (b) red line). This process is repeated until the search width is 1 or less. Then, the
number of evaluation value determinations is given by the following equation.

where  represents the number of channels (four channels in this paper),
  represents the number of steps adjustable in the coarse search (32 in this paper).
If the time required to determine the evaluation value per cycle (including image capturing) is 0.07 seconds, the optimal value will be obtained in 28 seconds.
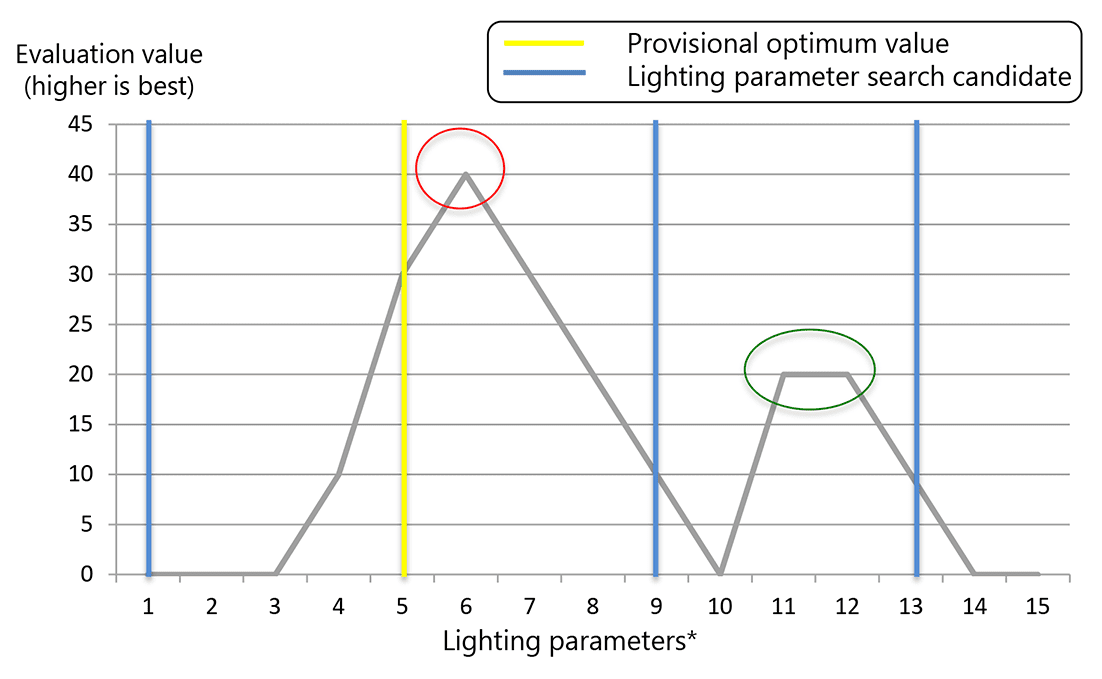
* In the case of MDMC, the lighting parameter is 4D, so in the figure, a part of it projects to 2D as an example.
- The yellow line and the blue line show the lighting parameter for obtaining the evaluation value.
- The yellow line shows the lighting parameter of the highest tentative optimal value.
- The red circle shows the peak of the highest spike.
- The green circle shows the peak of the second-highest spike.
3. Performance evaluation
3.1 Evaluation method
Using substrates for evaluation, our proposed method was compared with a conventional method1) to evaluate its performance. The substrate and evaluation equipment used are as shown below:
| Substrate for evaluation | Power MOSFET (with discoloration defect) |
|---|---|
| Image sensor | Model FH-5050 |
| Lighting device | Model FL-MD180MC(MDMC lighting) |
| Camera | FH-SCX12 |
| Lens | OMR-THV0575-220_S (pixel resolution 6  m/pixel) m/pixel) |
The inspection items selected for the substrate for evaluation were foreign matter (discoloration defect), fading, and solder balls. As for the evaluation axes, our simple and fast algorithm uses as feature quantities the hue, saturation, and brightness in the HSV color space to discriminate (binarize) between conforming and nonconforming parts at thresholds. This algorithm was adopted because fast algorithms are required on FA sites where inspection time affects inspection costs. As for evaluation axes, similarly to the discriminant analysis method5), separation metrics are determined based on the inter-class variance and intra-class variance ratio of the concentrations of non-defective and defective regions and are used as evaluation values. In other words, the following equations are used to obtain the evaluation value (separation metrics). Then, the lighting parameter with the largest evaluation value is adopted.
Inter-class variance

Intra-class variance

Separation metrics

where  and
and  represent the numbers of pixels in non-defective and defective regions, respectively,
  and
and  represent the average concentrations of non-defective and defective regions (calculated after RGB-to-gray-scale conversion), respectively,
  and
and  represent the variance of non-defective and defective regions, respectively.
Note, however, that if a non-defective or defective region shows halation (phenomenon in which the concentration value saturates due to overlighting) (average concentration after gray-scaling ≥ 240), the light and shade information will be lost. In such a case, let the evaluation value be 0. As for zoning, similarly to Fig. 1(b), the inside of the defect was selected as a defective zone, so that the non-defective region would not include the defective zone.
The evaluation was performed based on the evaluation value, the false detection and the processing time in the sample substrate assuming to apply N=5 and N=11 to the coarse search for the conventional sampling method and apply the combination of the coarse search of N=5 and the detailed search for our proposed method.
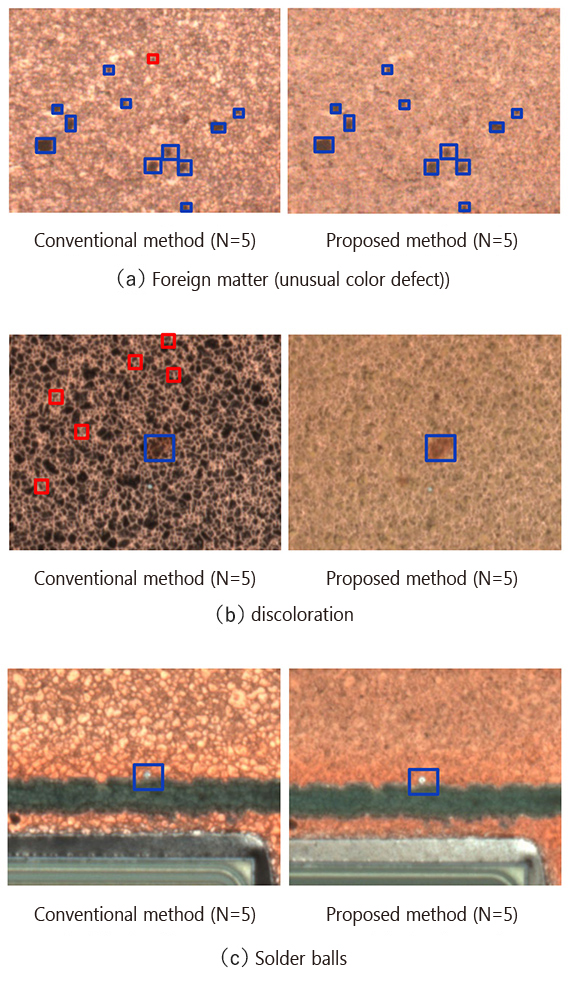
3.2 Evaluation results
Regarding the inspection item, the foreign matter and the fading, the processing time was 42 seconds and the separation metrics were as low as 0.13 and 0.01, respectively, in the conventional method (N=5). When discriminating the conforming part and the defect assuming the hue, saturation, and brightness as thresholds in the algorithm that makes the black with three pixels or more the defect after binarization, foreign matter at a place and fading in six places were erroneously detected even if the threshold was adjusted (Table 2 conventional method [N=5]). In our proposed method (N=5), the processing time was 69 seconds, and the separation metrics increased to 0.22 and 0.04, respectively. Further, no foreign matter and fading were erroneously detected. For reference, the assumption of N=11 in the conventional method eliminated false detection and the processing time was 1144 seconds. In addition, no false detection was generated in the solder balls in any method. These results confirm that our proposed method can suppress the extension of processing time, improve the separation metrics, and reduce the number of false detections in comparison with the conventional method.
| Inspection item | Method | False detection [place] |
Evaluation value [separation metrics] |
processing time [seconds] |
|---|---|---|---|---|
| Conventional method (N=5) |
Foreign matter (discoloration defect) |
1 | 0.13 | 42 |
| Fading | 6 | 0.01 | ||
| Solder ball | 0 | 0.01 | ||
| Our proposed method (N=5) |
Foreign matter (discoloration defect) |
0 | 0.22 | 69* |
| Fading | 0 | 0.04 | ||
| Solder ball | 0 | 0.22 | ||
| (Reference) Conventional method (N=11) |
Foreign matter (discoloration defect) | 0 | 0.20 | 1144 |
| Fading | 0 | 0.03 | ||
| Solder ball | 0 | 0.20 |
* Total time for coarse search and detailed search
4. Conclusions
This paper proposed an algorithm able to determine lighting parameters automatically and faster than the conventional method (N = 11). This time, automotive substrate and MDMC were used to evaluate our proposal. It was found that this technology does not only apply to these objects under inspection and lighting, but can also apply to the lighting if light intensity, and the angle can be set as parameters. As a prospect hereafter, we consider eliminating the constraint of the limitation to gray-scale and to deal with even a discrimination algorithm that assumes color difference as a feature quantity.
References
- 1)
- F. Hisato, K. Hiroshi, K. Yoshinori, F.Ryo, “Efficient Reflectance Property Estimation of 3D Objectʼs Surface” (in Japanese), IPSJ SIG Technical Report, pp. 1234-1241, 2010.
- 2)
- B. T. Phong, “Illumination for computer-generated images”, in Proc. Special Interest Group on Computer GRAPHics (SIGGRAPHʼ75), 1975, pp. 311-317.
- 3)
- Z. Zhang, H. Yoshioka, S. Ren, T. Akiduki, and T. Miyake, “Optimization of light source position in apperance inspection system for specular reflection surface”, ICIC International 2017, pp. 575-589, 2017.
- 4)
- Yukisawa, D., Ogata, D., Takada, T. Ueyama, T., Ota, J. “Automatic design of image recognition system including photographing environment targeting picking.” (in Japanese), The Japan Society for Precision Engineering Spring Convention in 2016 Academic Lecture Meeting Lecture Proceedings.2016, pp. 155-156.
- 5)
- O. Nobuyuki, “An Automatic Threshold Selection Method Based on Discriminant and Least Squares Criterion” (in Japanese), IEICI Transactions (D), Vol. 63, No. 4, pp. 349-356, 1980.
The names of products in the text may be trademarks of each company.