Q-upAuto, Failure prediction system with AOI-mounter collaboration
- Real-time anomaly detection
- Potential defect prevention
- Quality management
- SMT
- Solder inspection
Recently, manufacturers of printed circuit boards are required more high quality and more cost competitiveness. Therefore the manufacturing lines must keep high quality autonomously without human skills and work.
Omron Corporation Inspection Systems Business Division has been providing the inspection system which performs 3D-measuring and inspection by quantified quality standard. And it contributes to prevent outflow of defects at many manufacturers.
To make their manufacturing lines that does not produce defects, we have developed Q-upAuto; M2M system of inspection machines and chip mounters. It can detect failures in manufacturing process in real time and automatically.
We installed Q-upAuto to Mass production lines and confirmed effectiveness to rise and keep quality.
1. Introduction
In recent years, the rapid spread of vehicle safety equipment and hybrid vehicles has caused a soaring number of electronic
component boards to be used in automobiles. Since such components installed in automobiles require high quality,
manufacturers of printed circuit boards are forbidden not only to release defective products but also to rework defective units into conforming products in some cases, thus requiring the prevention of defects.
In addition, because of the aging of skilled mounting-line personnel and manufacturing engineers who have extensive experience and knowledge, human resources to achieve and maintain high quality have been decreasing over the last 10 years. Even if such human resources are sufficient at a manufacturer, not so many man-hours can be used for improvements with demands for cost competitiveness ever more prominent. In the context of industrial globalization, such personnel and engineers are often absent while supporting overseas sites, and efforts to maintain and improve quality cannot be achieved under such conditions.
The Inspection Systems Business Division had already launched a quality control system called Q-upNavi. This system has the following features: a Pareto function (Fig. 1) for accumulating inspection data from a solder paste inspection (SPI), post-mounted automated optical inspection (AOI), and post-reflow AOI for compiling defect status reports by SPI, AOI, or products, as well as a process reference function (Fig. 2) to check the images and measurements of each process for defect cause analysis.


However, inspection data can only help to check the status after the occurrence of a defect. To determine the cause of the defect, it is necessary for users to assume the cause based on images or other data or investigate the cause on the actual mounting line. As described above, since human resources capable of performing such analyses are insufficient in number and the available time for such an investigation is limited, quality improvements cannot be facilitated. Furthermore, efforts are undertaken only after the occurrence of defects, and thus defects cannot be avoided or prevented.
Under these circumstances, the Q-upAuto system was developed to determine the cause of defects, as well as to avoid or prevent defects in a very short period of time by automating the collection, analysis, and monitoring of even more data. As the first step, a product targeted for the mounting process was developed. Since 2017, the product was released only to operate in several mass production fields in a limited way, and the official release was made in 2018.
Through the approaches studied in these fields, quality was maintained and effectively improved. The following outlines the mechanisms and effects of Q-upAuto.
2. Background
2.1ŃĆĆDefect Causes in Mounting Process
The mounting process for printed circuit boards is comprised of the following: from the starting point, a solder printer, SPI, chip mounter (hereinafter called ŌĆ£mounterŌĆØ), pre-reflow AOI, reflow oven, and post-reflow AOI are aligned. These systems are arranged in a straight line, as shown in Fig. 3, where printed wiring boards (hereinafter called ŌĆ£boardsŌĆØ) are mounted while passing from the upstream to the downstream (from left to right as shown in this illustration). A solder printer prints solder paste through a stenciled metal sheet onto a board, and an SPI inspects the printed state of the solder paste. A mounter mounts an electronic component onto the solder paste, and a pre-reflow AOI inspects the mounted state of the component. A reflow oven heats the board where the component is mounted to melt the pasted solder, and then cools the board to cure the solder paste, thereby fixing the electronic component on the board. A post-reflow AOI inspects the finished product where the component is mounted in this way.

The mounter is an apparatus to mount electronic components onto a printed wiring board (PWB). The following is the mechanism for mounting electronic components, which is the most relevant to mounting quality. Fig. 4 shows the mounter structure.

First, electronic components are supplied by a feeder. The feeder supplies electronic components one by one from the attached reel by feeding a tape loaded with the components. If the section for feeding electronic components is worn out, it may cause variations in the component supply positions, thereby degrading the mounting quality.
Second, electronic components are sucked up by nozzles, and after undergoing component checks, carried to the appropriate positions on the board for attachment to the board (Fig. 5).

Electronic components are sucked up by nozzles by vacuuming the areas in contact with the nozzles. Various types of nozzles are available, but if the selected nozzles are not suitable for electronic components, or the mechanism of vacuuming is not working well owing to wear, a vacuum cannot be maintained, and the electronic components drop or shift from the pickup positions, thereby causing defects.
These nozzles are fitted to a head, and the head moves vertically and horizontally to suck up, check, and attach the electronic components. Approximately 10 nozzles are simultaneously fitted to one head. If the head becomes worn, the vacuum pressure decreases, or the positions of electronic components become unstable because of the variations in the positions to which the nozzles are lowered to suck up or attach the electronic components, thereby causing defects.
These feeders, nozzles, and heads have mounting parameters that are set not only for wear and tear, but also for the coordinates to suck up electronic components, coordinates to attach electronic components, the height of electronic components, and shape models of electronic components, respectively, and defects will occur when the parameters are incorrect.
Technological innovations in manufacturing facilities have improved mounting quality compared with the past. However, for example, since a large number of electronic components are mounted by a mounter at high speed, wear of the mechanism for mounting is severe and causes defects in mounting. Furthermore, because of variations in the quality of electronic components and boards, the mounting conditions often need to be adjusted. Accordingly, several to several tens of mounting defects occur per line per day in the mounting process, although the number of the defects varies depending on the production volume, and further efforts are necessary to maintain and improve the quality.
2.2ŃĆĆConventional Methods to Prevent the Recurrence of Defects in the Mounting Process
By using a pre-reflow AOI and post-reflow AOI system, it is possible to identify the position and the model where the defect occurred, as well as the component number of the electronic component that is defective. In addition, by using 7 QC tools, such as Pareto charts, it is possible to identify component numbers and positions vulnerable to defects. However, the cause of defects in a mounter cannot be determined as described in the preceding section.
In addition, a mounter has a compiling function intended to prevent defects and analyze their cause, which can identify the number of times nozzles and feeders have been used and the cumulative number of mounting errors, such as pickup errors. By using this function, potentially worn nozzles and feeders can be selected, and heavily used items can be maintained or replaced. However, because it cannot be confirmed whether such nozzles and feeders indeed caused the defective mounting, unnecessary maintenance may be performed, or the defect may reoccur as a result of overlooking the nozzle or feeder that caused the defect.
Usually, multiple mounters are arranged along one line in order to complete chip mounting on one board, and each mounter mounts different electronic components. This is because the number of feeders attached to one mounter is limited, and line tact can be reduced. In addition, it is common to reduce line tact by supplying them with multiple feeders or sucking up and attaching them simultaneously with multiple nozzles when many components with the same component number will be used. In addition, in the event of a mounting error, such as a pickup error, a mounting retry will be performed using feeders and nozzles different from those typically used.
To determine the cause of defects, it is necessary to identify which head, nozzle, or feeder from which mounter caused the mounting defect. However, data obtained from AOI and data obtained from the mounter are independent of each other, such that information has to be retrieved and cross-referenced from the respective data sources. Usually, identification cannot be made simply from the component number or position on the board, and thus it takes time and effort to store the mounting information of every board and necessarily cross-reference the serial number and individual chip number or circuit number marked on the board. Practically, such time-consuming operations cannot be afforded, and even if such operations could be performed, there would be other technical issues, such as not being able to take the necessary correction because the models in production have changed over the course of time, and feeders and nozzles fitted to the mounter may be replaced.
2.3ŃĆĆConventional Methods to Avoid Potential Defects in Mounting Process
To avoid potential defects, it is necessary to monitor variations in quality in real time before a defect occurs and then to take prompt correction on manufacturing facilities if any defects are detected. AOI data will be used to capture variations in quality, but an AOI system that determines only acceptability or unacceptability cannot acquire data before a defect occurs. Omron AOI systems (e.g., VT-S730, VT-S530) determine whether the unit is acceptable in accordance with numerically defined quality standards based on measurements to quantify quality evaluation items, such as the work positions, postures, and solder paste conditions. IPC-A-610 is widely used as the numerical quality standards in the industrial sector, but further quality evaluations and examinations will often be performed for each user to establish specific inspection standards.
The quality is evaluated by the bonding state of the land formed on a printed circuit board and the electrode of an electronic component (Fig. 6)1’╝ē. Even if an electronic component is mounted accurately in the position calculated from a fiducial mark on a printed circuit board and the coordinates specified by the CAD system, the land is not always present as given by CAD data owing to warping and distortion of the printed circuit board or land offset during production. Omron AOI systems can accurately measure mounting quality because the system measures the positional relationship between the electronic components and the electrodes after extracting the land position for each board.
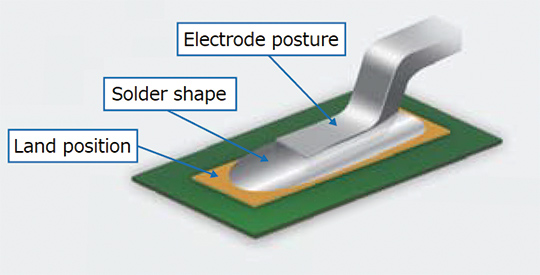
To capture variations in quality before a defect occurs, quality evaluation items should be numerically expressed in values proportional to the proximity to defects, which are physical measurements of the state of work ranging from good to defective. Conventional AOI systems, which quantify the number or percentage of pixels meeting a preset brightness or color for images taken by the AOI systems, cannot make such measurements.
As a method to monitor variations in quality, control charts2’╝ē are available. This method statistically processes measurements of several tens of units or more to detect the conditions for potential defects by evaluating variations and average deviations against the quality standards. However, this method requires a very large number of calculations, and therefore requires substantial computer resources for application to all boards and electronic components. Furthermore, the method is useless when applied to measures for avoiding potential defects because this method can detect quality deterioration only owing to the lack of information on manufacturing facilities. Accordingly, this method is rarely used in the electronic board mounting process.
3. Purpose
The purpose of this paper is to resolve these issues with the conventional methods and to provide a mounting line that prevents the recurrence of defects and avoids potential defects in real time, without the manual operation of manufacturing engineers and line operators. The final purpose is to enable automated correction on mounters and autonomous manufacturing of good products, such that the features to automatically identify heads or nozzles and feeders that potentially cause defects and provide data for correction are developed this time.
4. Issues and Solutions
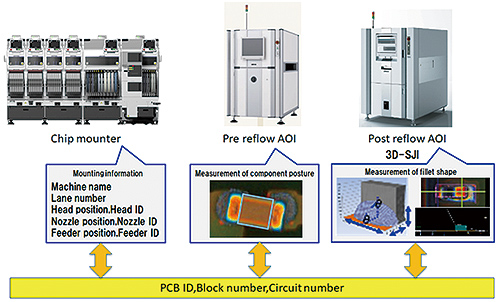
The first issue is linking inspection information and mounting information on mounters. The interface is designed to obtain necessary information from mounters and enables the acquisition of information in collaboration with mounter manufacturers. By using this interface, information on the mounter name, head ID, nozzle ID, feeder ID (hereinafter these three IDs are called ŌĆ£mounter device IDŌĆØ) of the mounter used for mounting and the position for mounting of all the boards and all the electronic components can be obtained for each serial number and individual chip number or circuit number of the boards. This information will be obtained immediately after the completion of mounting by each mounter and can be processed in real time. Linking the inspection results is made by using the serial number and individual chip number or circuit number of the boards (Fig. 7).
The second issue is the detection and reporting of the cause of defects or signs of defects in the mounting process. If the cause is attributed to the printing process or reflow process other than the mounting process, costs are wasted on the mounting process. First of all, to solve this issue, monitoring will focus on the types of defects caused in the mounting process and measurement items that deteriorate quality. In addition, quality will be observed for each mounter device ID to enable accurate observation of variations in such quality owing to factors in the mounting process. Meanwhile, factors in the printing process or reflow process affect the ranges different from those affected by mounter devices, which contribute less to quality deterioration of a specific mounter device ID and a reduction in potential false alarms. For example, in the printing process, the volume of solder paste at a specific point on the board is often excessive or insufficient, but the electronic components for mounting by a nozzle are predetermined, and the points are dispersed on the board and thus affected differently in the printing process.
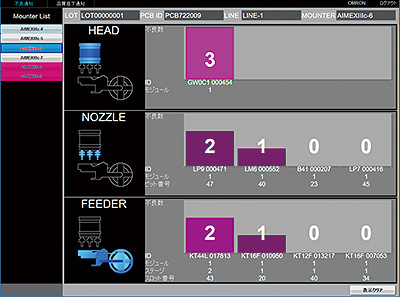
As for the prevention of the recurrence of defects, a defect report function will aggregate the number of times of mounting defective components for each mounter device ID, and report on the mounter device IDs and the number of times in descending order by head, nozzle, and feeder (Fig. 8). Aggregate results can be displayed by mounter, and when a defect occurs in a mounter, the aggregate results of the mounter will be displayed. The names of the mounters are listed on the left side where the mounter in which a defect occurred is displayed in red, and by selecting the name of the mounter, the display will switch.
The targets of the aggregation include stock-outs, wrong components, wrong polarity, X-directional deviation, Y-directional deviation, angular displacement, electrode side protrusion, electrode end protrusion, floating component, and component inclination. The displayed mounter device ID includes the mounter name where the device is fitted, the mounter module, the nozzle pit number where the nozzle is set, and the position on the stage where the feeder is fitted. According to this information, the mounter device ID where defects are concentrated and the fitted position of the device can be identified without investigation, thereby enabling prompt correction.
As for the avoidance of potential defects, a quality degradation report function is provided for each head ID, nozzle ID, and feeder ID on all electronic components mounted by them to calculate the process capability index for each measurement and to provide data on the mounter device IDs for which the process capability index decreased, as well as to graphically show the transition of the process capability index (Fig. 9). Measurement items include the component position before defect, measurable postural X-directional deviation/Y-directional deviation/angular displacement, electrode side protrusion, electrode end protrusion, floating component, and component inclination. The fitted positions of mounter device IDs are displayed by this function to enable and support prompt correction . Past reports are listed in the lower section, and the description of the selected past report can be displayed and checked in the above section.
A defect may be caused by inappropriate mounting parameters for the respective component numbers, in addition to worn-out mounter devices. Because most of the mounting parameters are set for each component number, component numbers are listed in ascending order of the process capability index for each combination of mounter device IDs and component numbers. This allows operators to discriminate between quality deterioration owing to the combination of a specific mounter device ID and a specific component number and quality deterioration regardless of component number. Accordingly, a decision can be made whether to maintain or replace the mounter device or to change the mounting parameter.
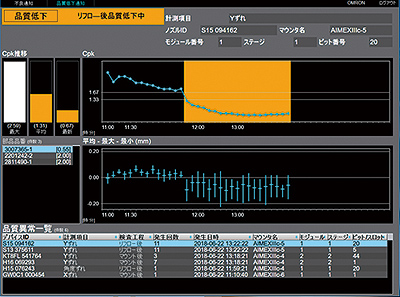
As a method to detect defects, when the average of the process capability index of a series of 20 consecutive boards is lower than the threshold value, a defect is considered possible. This is because the intention is to avoid the black box effect of the method to detect defects and make the method easy for users to understand and explain. Particularly in the on-board industry, process monitoring, measurement, and analysis must use statistical methods, such as the process capability index, under the IATF16949 international standard for quality management systems, and a standardized method should be adopted.
The process capability index for each mounter device ID is inadequate for determining what correction to take. The process capability index decreases when variations increase or when the average shifts, and therefore we cannot tell which event occurred. To solve this issue, a method using Xbar-R control charts is applied to check the transition of the average values and variations. If a component number is selected, the average, maximum, and minimum values of the measurements will be shown in a transition graph (in the default setting, the component number with the lowest process capability index is selected). This graph also displays the inspection standards. By enabling a check of the transition of the distribution of the measurements, comprehension of the events, such as the proximity to defects, direction of transition of the average, or any increase in variations with the average unchanged, and whether such events occurred suddenly or continuously, is facilitated, thereby helping to determine what correction to take.
Correction to take are as follows: for example, if a shift in the average of the X-directional deviation or Y-directional deviation continues, the cause is a deviated mounting position, and therefore the mounting position parameter should be adjusted, or if variations gradually increase without a shift in the average, the cause is a worn-out mounter device, and therefore mounter device maintenance should be carried out.
The above two functions are applied to both pre-reflow and post-reflow measurements. If the work is charged into the reflow oven, because the electronic components move when the solder paste melts, the component posture changes between prereflow and post-reflow. In most cases, the amount of deviation tends to decrease because of the self-alignment phenomenon, but it may sometimes increase. Accordingly, monitoring is required for both processes. In the post-reflow process, the work is ready to be shipped as a product for which the data represent the direct measurements of the product quality. Therefore, more urgent and important defects can be detected. Meanwhile, in the pre-reflowprocess, because the state of the electronic component mounted by the mounter can be measured directly, the effect of the cause of defects appears significant. If the pre-reflow quality deteriorates, the post-reflow quality does not always deteriorate to a level that requires correction, and less urgent and important defects can be detected, which serve as preventive maintenance measures.
5. Results
Here are some cases where Q-upAuto was applied to a mass production line, and the quality was maintained and effectively improved.
The first case is a modification of the nozzle model. There was a defect detected in a nozzle ID (Fig. 10), and in another nozzle ID of the same component number (Fig. 11). Since the quality of several nozzle IDs deteriorated, the component number and the nozzle model might have been inappropriate. A modification of the nozzle model was implemented as a corrective action. The defect rate of this component number was 1.00%, but 0.00% after the modification (Table 1).


| Before correction | After correction | |
|---|---|---|
| Inspected component count | 5620 | 5662 |
| Defect count | 56 | 0 |
| Defect rate | 1.00% | 0.00% |
The second case is nozzle maintenance. There was a defect detected in a nozzle ID (Fig. 12). As a result of a manual inspection of the movement of the nozzle, there was an abnormality in the sliding motion, and then the nozzle was tested with the nozzle check system, and the result was an error. Maintenance was implemented, and the nozzle was returned to the line. In this case, a defect did not occur, but an X-directional deviation near the limit under the inspection standards occurred. In addition, 37 pickup errors occurred while mounting 459 boards. Several tens of nozzles are set on one mounter, but the specific nozzle that needs maintenance was found without wasting time and effort to test all the nozzles one by one.

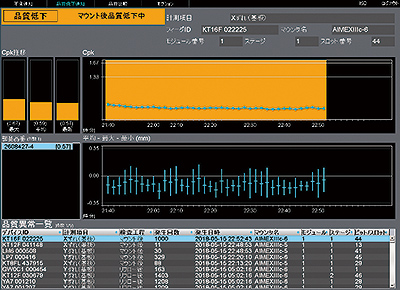
The last case is the detection of continuous component deviations. There were potential defects detected continuously with a pre-reflow X-directional deviation (Fig. 13). With reference to the graph, the process capability index continued to be below 1.0, and the average of the X-directional deviation measurements was shifted approximately 100 to 200 ╬╝m in the X-direction. Because the minimum value had an allowance in the inspection standards, no correction was taken, but if the value had been close to the inspection standards, the coordinates to mount components would need to be adjusted.
As described above, the application of Q-upAuto helps to detect the conditions in which defects are likely to occur, such as inappropriate mounting parameters and situations where maintenance is required, as well as to determine what corrective action should be taken without using man-hours of manufacturing engineers and operators. With a conventional system, such detection requires substantial effort and time, and real time detection is not practical, but this system performs such detection and takes the corrective action before defects occur, thereby maintaining and improving the quality.
6. Conclusion
At this time, the defect sign detection system, Q-upAuto, using inspection data of AOI and mounting data for the mounter, has been developed, and its effect on quality maintenance and improvement was confirmed on actual production lines.
As part of future planning, the entire SMT line, including printers and reflow ovens, will be monitored, and based on the defect sign detection results, automatic feedback to manufacturing facilities, such as mounters, will be incorporated to develop an evolved system that can achieve higher quality without requiring human effort and skills.
Finally, we would like to express our deepest appreciation to the staff of the Inspection Systems Business Division and the people at the production sites for their tremendous support for this development effort and the verification of the results.
References
- 1’╝ē
- Sugiyama, T.; Kishimoto, M.; Fujii, S.; Sugita, S. SJI (Solder-Joint-Inspection) Solving with 30 years and 3D technology, The Japan Institute of Electronics Packaging, The 31st Spring Lecture Meeting, 2017.
- 2’╝ē
- Nagata, Y.; Munechika, M. Process capability indexŃĆĆPractice method and the theory, Japanese Standards Association. 2011, p.41.
The names of products in the text may be trademarks of each company.


