


Development of AI Technology for Machine Automation Controller (1)
- AI Technology
- Real-time anomaly detection
- Equipment maintenance
- Programmable logic controller
- Machine learning algorithm
The equipment maintenance and production management for manufacturing, which have been dependent on experience and knowledge of workers, are being improved by AI, IoT, and big data. It is necessary to collect and analyze high-time resolution data that is sufficient to describe the condition of the manufacturing equipment in order to automate maintenance tasks similar to experts. In this paper, we propose an anomaly detection method by utilizing control data which can be acquired from industrial controllers installed in production lines. In addition, we show that a controller with the proposed method, which is installed in an automatic packaging machine, can detect anomalies in real time.
1. Introduction
Due to the influence of the declining birthrate and increasing aging population, the proportion of productive-age population in our country has been decreasing year by year. According to the national census carried out by the Ministry of Internal Affairs and Communications, the productive-age population rate began to decrease after peaking in 1995, and labor shortages are expected in the future. A similar tendency is also seen among economic powers such as Germany, and this problem is expected to be global in the future. Also in China and other developing countries which play a role in global manufacturing, the labor costs have been rising, and it has been becoming more difficult to secure labor. Under such circumstances, the movement toward labor saving has accelerated in manufacturing fields through the utilization of AI (Artificial Intelligence) and IoT (Internet of Things). And in particular, the introduction of technologies to production management and equipment maintenance work is actively under consideration1) – 3).
At the latest production sites, large amounts of control data are collected in the cloud through IoT. Also, products and services, which are designed to improve productivity through big data analysis, have begun to be introduced. Utilizing them enables production management and equipment maintenance which are effective for daily-level production improvement, and the operational rate of production lines is expected to increase. On the other hand, most maintenance expertise is still highly dependent upon the hunches and experiences of experts who are working full-time in the field. The experts always sense the behavior of devices installed in the field through their five senses to describe “unusual conditions”. They also estimate the cause of abnormal phenomenon based on their past experiences and knowledge to immediately develop and take countermeasures. For these reasons, for the further improvement of maintenance quality based on the data, it is considered necessary to at least collect data with a sampling period (such as milliseconds) that enables to completely capture the behavior of equipment operated in the field and to provide the analysis results to workers on a real-time basis. Therefore, focusing on an industrial controller which is used to control manufacturing equipment, we considered the anomaly detection method utilizing control equipment input/output information, which is collected at high speed and with high accuracy with the control period of the equipment, to enable even non-experts to identify equipment quality in the same manner as experts.
In this paper, we propose an anomaly detection method utilizing the control data which can be obtained from the controller which controls a device, for manufacturing equipment which performs production repeatedly on a periodic basis. In addition, we also demonstrate that the controller, which is programmed based on the data analysis results according to the proposed method, can detect anomalies in real time, using a packaging machine prepared for the experiment.
2. Issues
The PLC (Programmable Logic Controller) is a typical controller used at production sites, and it was born as a substitute for the electromagnetic relays which were used for automating production lines. A PLC mainly executes sequence control in which control is performed according to the order established in advance by a program. And it recently also serves as an interface with production site information and high-order production management systems, because it achieved increased functionality, such as motion control and network communication. This kind of controller can collect input/output information of various control instruments constituting production equipment such as relay contact on/off state and servomotor torque (hereinafter referred to as “control data”) at intervals of several hundreds of microseconds or several milliseconds.
Utilizing control data, which can be collected with a controller, is considered to produce benefits as follows:
- It is possible to detect a change in the behavior of devices which are utilized for control such as sensors and servomotors, without newly installing another sensor.
- When regarding a controller as a subsystem of the cloud, programming the data analysis method (such as preprocessing and the device anomaly detection method) in advance eliminates the need for sending all data to high-order systems, enabling a reduction in communication load.
To realize these values, we determined the following two matters as issues that should be solved:
- Data analysis for detecting anomalies on a device basis
- Execution of data analysis on a controller
From the next section, we describe the methodologies to solve these two issues.
3. Technical content
3.1 Packaging machine
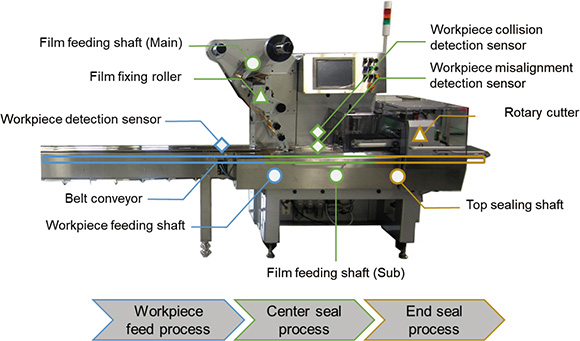
For the explanations in Section 3.2 and subsequent sections, we first introduce the packaging machine for the experiment. The packaging machine we deal with in this paper is a horizontal pillow type packaging machine which packs products into pillow shapes with plastic film. As the system configuration in Fig. 1 shows, this packaging machine consists of four servo motors and three fiber sensors, and the controller performs control in a skillful way using them to automate packaging. This packaging machine packages workpieces into pillow shapes through the following three processes: workpiece carrying-in process, center sealing process and top sealing process.
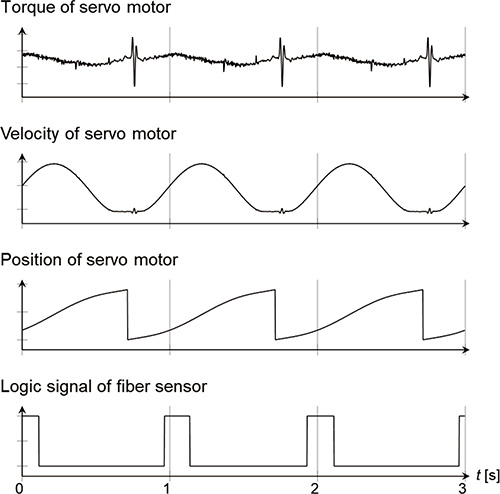
A total of fifteen signals, which are composed of the torque, velocity and position of the four servo motors as well as the logic signal of the three fiber sensors, are collected at a constant frequency by the controller which controls the packaging machine, through a fieldbus. As an example of collected data, Fig. 2 shows the torque, velocity and position of the top sealing shaft, as well as the logic signal of the workpiece detection sensor. The behavior of these data shows that there is an interval of approximately one second. This is because the packaging machine packages one workpiece per second.
3.2 Detection of production equipment anomalies using control data
To solve the two issues described in Section 2, we examined the feasibility of introducing a machine learning algorithm to the controller. On production sites where high reliability is required, highly-precise explanation of the reasons for the estimation results is important. Therefore, in the method we propose, the feature values used by the algorithm is determined through data analysis, before anomaly detection is operated by the controller, to clarify which features are used for executing anomaly detection as well as to ensure highly-precise explanation of estimation results. In addition, a method with low calculation cost during operation is applied as an outlier detection algorithm, so that even existing controllers with few computing resources can execute anomaly detection in real time.
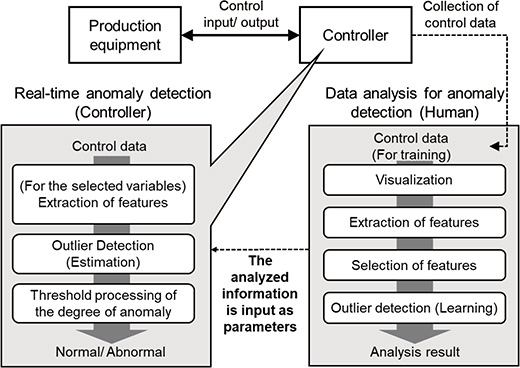
Fig. 3 shows the conceptual diagram of the proposed method. Specifically, anomaly detection using control data is realized according to the following procedures:
- Collection of control data, extraction/selection of features, and outlier detection are performed to detect anomalies offline (Parameter calculation)
- The results obtained through data analysis (The feature values to be observed and threshold) are given to the controller as parameters to operate real-time anomaly detection with the controller
3.3 Visualization
Visualization is the first thing which humans perform using the data provided by the controller, to grasp the current situation. It is checked whether the data is correctly obtained.
3.4 Extraction of features
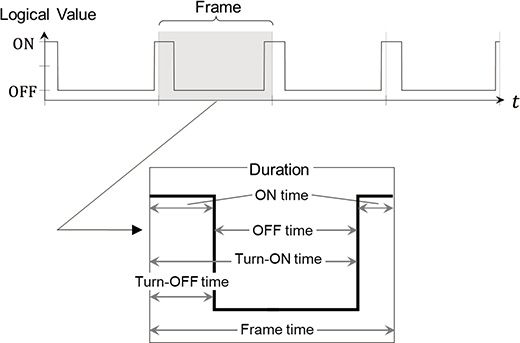
In this paper, a period of repeated operation of production equipment is called a “frame.” Citing the packaging machine described above as an example, a period of one second, during which one workpiece is packaged, corresponds to one frame. In this proposed method, the control data are divided into frames to calculate the feature value. In addition, the feature values used are different between cases where the data result in continuous values and cases where the data result in a logical value of ON and OFF. Next, we explain about the feature values.
Provided the data in the ith frame of certain control data are expressed as follows:

Where,
 represents the type of control data such as torque and velocity, and
 represents the total of data in the frame
 . Suppose the start time of the frame
is
. Suppose the start time of the frame
is
 , the time when the
 th data of the frame
,
th data of the frame
,
 (
(
 ) can be expressed as follows:

Where,  is the sampling period of the control data.
Fig. 4 shows the concept of feature value calculation when
(
)
results in continuous values. This feature value calculation detects the distribution changes by frame as a statistical feature. The formula for calculating the feature amount of continuous values is as follows:
-
1) Average:

-
2) Standard deviation:

-
3) Skewness:

-
4) Kurtosis:

-
5) Maximum:

-
6) Minimum:

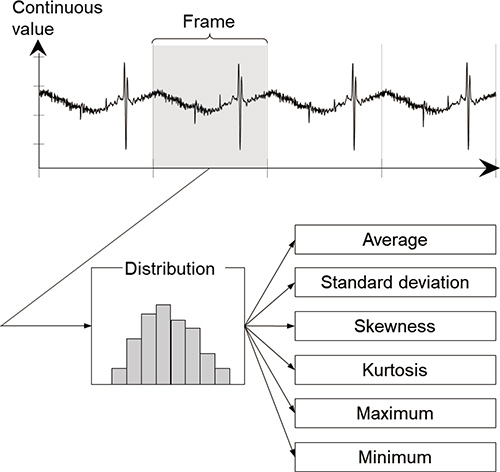
Fig. 5 shows the concept of feature amount calculation when
 results in a logical value. This feature amount calculation detects the change in the timing, at which the logical value of each frame turns over, based on the features of duration. Following is the formula for calculating the feature amount of a logical value:
-
1) ON time:

-
2) OFFtime:

-
3) Turn-ON time:

-
4) Turn-OFF time:

-
5) Frame time:

Where,
 is a function which outputs 1 when the input is ON and outputs 0 when the input is OFF, and
 is a function which outputs 1 when the input is OFF and outputs 0 when the input is ON. Furthermore,
 represents the data length until the logical value switches from OFF to ON for the first time in the frame i, and
  represents the data quantity until the logical value switches from ON to OFF for the first time.
3.5 Selection of feature values
It is very troublesome for humans to ascertain the meaning of each single feature value calculated. In addition, if all feature values are monitored uniformly by a controller, the calculation resources will be insufficient. Therefore, it is necessary to reduce the number of the variables which should be observed, with a certain method. Needless to say, if the details of the production equipment of concern as well as the points to be observed are already known, their variables should be used. However, it is often the case that only a few people understand the production equipment in detail, and it is generally difficult to select the variables which should be observed, based only on their knowledge. In such cases, the variables, which are useful in anomaly detection, should be selected through data analysis. As a variable selection method, mechanical learning such as decision tree5) and logistic regression should be used. Specifically, the normal and abnormal labels, which are attached to the training data, are used as objective variables, and all feature values, which are calculated from each frame of control data, are used as explanatory variables, to select the explanatory variable which is most appropriate for explaining about the objective variables. Therefore, for this variable selection, training data with normal and abnormal labels are required.
By reducing the number of the feature values, which are used for anomaly detection, through data analysis, it becomes easy to maintain the real-time performance, because only selected feature values need to be processed even in the case of a controller with insufficient calculation resources.
3.6 Outlier detection
In outlier detection, the degree of anomaly is calculated from the features and defined as the degree of deviation from the target data which is obtained in a normal state. The outlier detection methods in practical use include Local Outlier Factor and One Class SVM (Support Vector Machine), both of which are independent of the distribution of object data. Although there are various outlier detection methods, we used Isolation Forest 4), which enables high-speed and light-weight processing, in the experiment described in Section 5.
Isolation Forest is a tree-structured outlier detection method based on data density. It produces binary partition trees by dividing training data recursively with a hyperplane which is vertical to a randomly-determined coordinate axis, to calculate the degree of anomaly based on the information on the node depth of the binary partition trees which were produced. When performing data analysis, it is necessary to generate binary partition trees using training data, to learn the model used for outlier detection. In addition, by setting any given threshold value for the degree of anomaly which is output by the outlier detection model, it becomes possible to determine outliers based on training data.
4. Proof-of-concept experiment
This section describes the results of verifying the practical utility of the proposed method, using the controller which controls the packaging machine for the experiment as described in Section 3.1.
4.1 Experimental outline
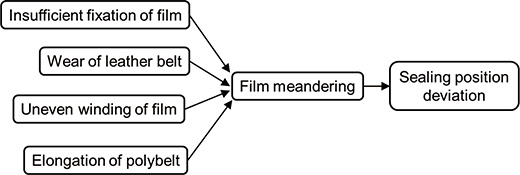
“Sealing position deviation” is one of the packaging failures of packaging machines. “Sealing position deviation” is a failure in which a film is welded with its horizontal position deviated, due to improper feeding of film from any cause when welding a film in the center sealing process. Because the welding of misaligned film can result in inadequate sealing, this failure could lead to a significant product failure. Fig. 6 shows the causality when “sealing position deviation” is regarded as the result. It shows the relationship in which “sealing position deviation” was eventually caused by the “film meandering” phenomenon due to “insufficient fixation of film,” “wear of leather belt,” “uneven winding of film” and “elongation of polybelt.”
In this experiment, we attempt to detect “film meandering” due to different causes, as an early sign of “film position deviation.” It is considered that if “film meandering” can be detected as an early sign of “sealing position deviation,” it will be possible to take countermeasures before “sealing position deviation” occurs, preventing failures from occurring. Specifically, we measure a total of fifteen signals, which are composed of the torque, velocity and position of four servo motors as well as the logical values of three fiber sensors, as described in Section 3.1. We also perform the procedures described in Sections 3.2–3.6 using these data as inputs. The operating conditions of the packaging machine used for the experiment are as shown in Table 1.
| Packaging length | 190 mm |
|---|---|
| Packaging speed | 60 bags/min. |
| Sampling period | 2 ms |
| Workpiece | Eraser (Width: 24 mm × Length: 65 mm × Height: 13 mm) |
4.2 Data analysis for anomaly detection
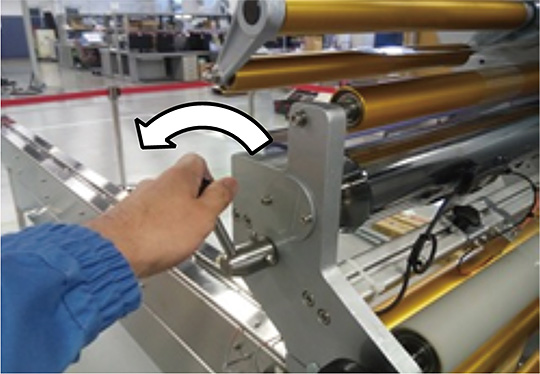
As the training data for anomaly detection, we collected the control data for 400 workpieces when the packaging machine was operating normally as well as those for 100 workpieces when “film meandering” occurred. We reproduced “film meandering” by loosening the locking lever for film fixation completely as shown in Fig. 7. After that, we calculated the feature values of the collected training data, to select the feature values used for anomaly detection, to learn about the outlier detection model, and to specify the threshold for determining normal and abnormal conditions.
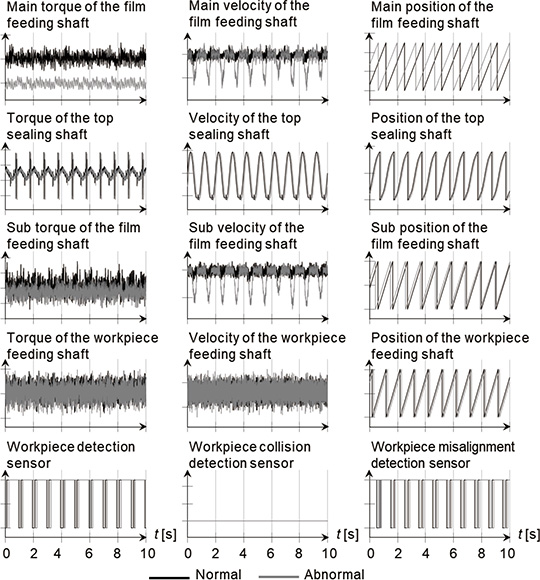
Fig. 8 shows part of the training data. As a result of analyzing these data using a decision tree, the five feature values shown in Table 2 were selected as the feature values which were useful for detecting “film meandering.”
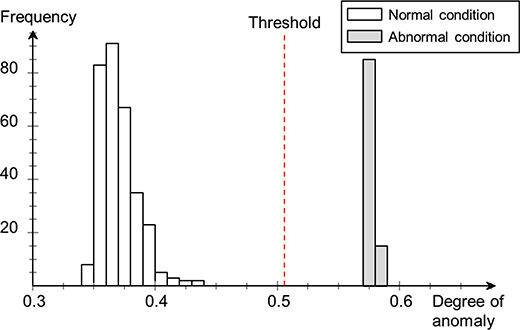
Fig. 9 shows the distribution of the degrees of anomaly which are output when the training data are input to the outlier detection model, after learning the outlier detection model using the selected feature values. As mentioned below, we used 0.505 as a threshold value for determining normal and abnormal conditions here.
| Data | Feature values | Importance |
|---|---|---|
| Main torque of the film feeding shaft | Average | 150.0 |
| Sub torque of the film feeding shaft | Average | 150.0 |
| Main torque of the film feeding shaft | Maximum | 150.0 |
| Main torque of the film feeding shaft | Minimum | 150.0 |
| Main torque of the film feeding shaft | Standard deviation | 150.0 |
4.3 Real-time anomaly detection
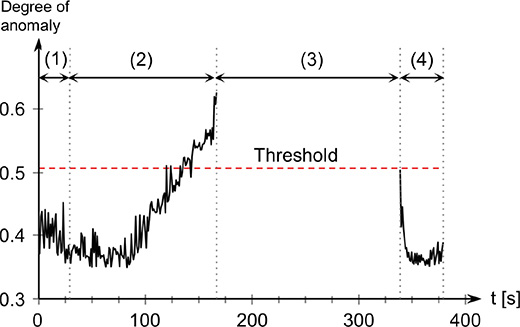
We incorporated the feature values which were selected in the data analysis described in the previous Section, the outlier detection model, and the threshold value for anomaly detection into an actual controller, to perform the anomaly detection of “film meandering” in real time. In this experiment, we operated the packaging machine, according to the following procedures from (1) to (4):
- (1)
- Operate the packaging machine as usual.
- (2)
- Loosen the locking lever by five degrees every ten seconds in stages to cause “film meandering.”
- (3)
- Bring the packaging machine to an emergency stop and return the locking lever to its original position to perform recovery work.
- (4)
- After confirming the safety, operate the packaging machine again.
Fig. 10 shows the time variation of the degree of anomaly which was output by the outlier detection model. It means that the higher the degree of anomaly, the farther the packaging machine has deviated from its normal condition. The numbers (1) – (4) in the figure correspond to the above experimental procedures. In addition, because no degree of anomaly is calculated while the operation of the packaging machine is under suspension, the plot of that period was omitted.
4.4 Discussion
As the time variation of the degree of anomaly shows in Fig. 10 in the previous section, in status (2), it can be confirmed that the degree of anomaly increased and finally exceeded the threshold value, due to “film meandering” which was caused by loosening the locking lever. Furthermore, it can also be confirmed that the degree of anomaly returned to the threshold value or lower in status (4), where the operation of the packaging machine was resumed after the packaging machine was recovered in status (3). The reason the degree of anomaly did not change when initially loosening the locking lever is that the locking lever has an allowance. From the above results, it can be said that “film meandering”, caused in a simulated manner, is properly detected by the proposed method. In addition, because the degree of anomaly increases in a phased manner in response to the occurrence of “film meandering,” it is considered that monitoring the trend of the degree of anomaly enables even non-experts to notice an “unusual condition” of a device. For example, setting phased threshold values for the degree of anomaly enables workers to be notified of appropriate maintenance timing.
In this experiment, the intermediate value between the maximum value of the degree of anomaly calculated from normal data and the minimum value of the degree of anomaly calculated from abnormal data was used as a threshold value, as shown in Fig. 9. This threshold value actually needs to be adjusted according to the characteristics of the anomaly to be detected, because it determines the trade-offs for the erroneous detection and missing of anomalies. Furthermore, because it is adequately anticipated that the distribution characteristics of the degree of anomaly change during operation of equipment it is also required to update the threshold value according to the characteristics.
According to Fig. 8, the anomalies, which were subject to detection this time, can be detected by setting a threshold value for the raw data of “main torque of the film feeding shaft.” However, in order for humans to determine which signal needs to be monitored for detecting a certain anomaly, complicated confirmation work as described in Section 3.5 is required. Using this proposed method enables the determination of the feature value which is useful for automatic anomaly detection through a series of data analyses. In addition, using the algorithm based on machine learning enables anomaly determination setting, based on simple threshold value setting which requires no complicated rules.
Because this proposed method enables the quantification of the health condition of a device, which used to be determined based on the hunches and experiences of experts, in an objective way by following certain data analysis procedures, it can be a powerful tool to realize an increase in the operational rate of devices.
5. Conclusion
In this paper, we proposed an anomaly detection method by utilizing the data of a controller which controls manufacturing equipment, and also showed an example of application to an actual packaging machine.
In this paper, we proposed an anomaly detection method by utilizing the data of a controller which controls manufacturing equipment, and also showed an example of application to an actual packaging machine.
Finally, we would like to express our deepest gratitude to those who engaged in the technical and product development of the controller for their extensive cooperation.
References
- 1)
- OMRON Corporation. “Bigdata visualizes manufacturing sites at OMRON Kusatsu Factory”. http://www.fa.omron.co.jp/solution/sysmac/technology/bigdata/index.html, (accessed 2018-03-01).
- 2)
- IBM Japan. “Predictive Maintenance and Quality (PMQ): Anticipate and prevent asset failures to improve capacity utilization rate and yield”. IBM Japan. https://www-01.ibm.com/software/jp/info/predictive-maintenance/, (accessed 2018-03-01).
- 3)
- NEC Corporation. “NEC Launches System Invariant Analysis Technology Package for AI Engines”. https://www.nec.com/en/press/201804/global_20180423_01.html, (accessed 2018-03-01).
- 4)
- John Ross Quinlan. Induction of decision trees. Machine learning, Vol. 1, Issue. 1, p. 81-106, 1986.
- 5)
- Fei Tony Liu.; Kai Ming Ting.; Zhi-Hua Zhou. Isolation-based anomaly detection. ACM Transactions on Knowledge Discovery from Data (TKDD), Vol.6, No.1, p.3, 2012.
- 6)
- OMRON Corporation. “OMRON Develops AI-Equipped Machine Automation Controller: Real-time integration of machine control and AI”. https://www.omron.com/media/press/2017/04/c0425.html, (accessed 2018-03-01) .
The names of products in the text may be trademarks of each company.