


Development of air quality sensor for air purifier
- Air purifier
- Microparticle detection sensor
- High-sensitive photo IC
- Dust collection structure
- High frequency wave filtering
Air pollution by fine particulate matter PM 2.5 is becoming a big topic and increasing people’s interest. PM2.5 sensors are installed in air purifiers in our immediate surroundings vicinity and are also pervasive in our daily lives. On the other hand, conventional particle detection sensors have not reached sufficient performance to detect PM 2.5 particles with high accuracy. In order to increase the detection accuracy of PM 2.5 particles, it is important to increase the sensitivity to finer-scale particles and to allow particles to flow into the detection area efficiently. In this development, we have realized highly accurate particle detection sensor which can detect micro particles with a particle diameter of 0.5 μm by a flow path structure with dust collection structure and original optical system by using light scattering method.
1. Introduction
Recently, the health impact of fine particulate matter containing particles which are 2.5 μm or smaller in diameter, so-called “PM2.5,” has been revealed, which is attracting people’s attention.
Among the generation sources of PM2.5 such as industrial smoke, vehicle emissions, volcanic ash, etc., one of the representative is cigarette smoke. The particles contained in cigarette smoke are microparticles which are 1 μm or smaller in diameter. Since it is particularly recognizable as a microparticle generation source in an indoor environment, the test conducted using tobacco is stipulated as the standard of the dust collection performance test for air purifiers by the Japan Electrical Manufacturers’ Association.
Microparticle measurement methods include the filter method in which the atmospheric air is sucked into a filter and particulate matter is collected on the filter, the filter vibration method which is intended to conduct automatic measurement, and the beta-ray absorption method, as well as the light-scattering method as a simplified measurement method.
The filter method is said to be the most reliable measurement method. In addition, the filter vibration method and beta-ray absorption method are used in the environment ministry’s widearea air pollutant monitoring system (commonly known as “Soramame-kun”) as measurement methods equivalent to the filter method 1).
On the other hand, since these methods are very large in scale and expensive, the light-scattering method, which is compact and low in cost and enables real-time measurement, is incorporated in household air purifiers and is in widespread use as a familiar particle detection sensor.
However, the minimum detectable particle diameter of conventional particle detection sensors is approximately 1 μm, which cannot be said to be sufficient to detect microparticles including cigarette smoke. In addition, the measurement values vary significantly. Therefore, in terms of promoting the efficient operation of air purifiers, the need for high-precision microparticle detection sensors is increasing.
2. Measurement principle
This sensor measures the microparticles in the air using the lightscattering method to output the detected signal of the particles which passed the sensor as a pulse.
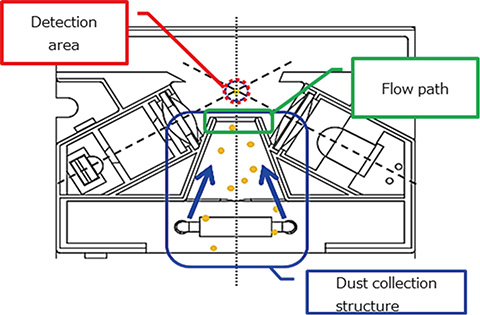
As Fig. 1 shows, the overall structure is divided into the particle introduction section which brings microparticles to the detection section, the detection section which irradiates the particles that reached the detection area with light and detects the scattering intensity of the scattered particles irradiated with light, the amplifier circuit and computation unit which process the scattered light signals, and the particle discharge section which discharges the particles.

We describe the functions of the detection section and the particle introduction section which are the core of the lightscattering method below.
2.1 Detection section
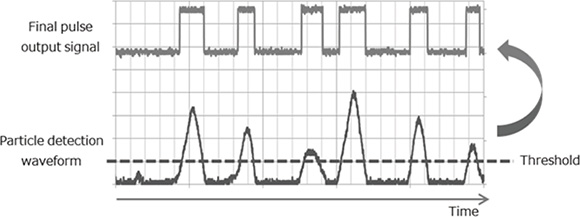
The particle detection sensor based on the light-scattering method detects particles by detecting the scattered light generated when the light-projecting element irradiates the particles that reached the detection area with light. Both the light-projecting element and the light-receiving element have an aspheric lens to set a light collection optical system for the detection area, to secure the intensity of the light-receiving signal. The light-receiving signal is converted into an electrical signal through photoelectric conversion and it is transferred to the processing circuit in the latter stage. Fig. 2 shows the conceptual diagram of the signal waveforms obtained when particles are detected. Since the scattering signal is output according to particulate passage, deducting a certain threshold value enables the particulate passage to be detected.
The minimum detectable particle diameter depends on the level of S/N ratio that can be secured in this detection section, because the light-receiving signals from microparticles are buried in noise and cannot be detected if the S/N ratio is low. In other words, the higher the S/N ratio is, the finer the microparticles can be detected.
2.2 Particle introduction section
Another important compositional unit is the particle introduction section.
Although the particle detection principle was described in Section 2.1, the function cannot be fulfilled unless the particles reach the detection area. Introducing particles smoothly to the detection area is the role of the particle introduction section.
In order to introduce particles, it is necessary to generate air flow. The methods for generating air flow include that of taking in the external air strongly using an agitation fan as well as that of utilizing a rising air current which is generated by causing a temperature difference in the atmosphere through the heating of a resistor.
Although the selection differs depending on the application, simplified particle detection sensors which are incorporated into household air purifiers, etc., often use the resistor heating method owing to the cost requirements from the market. This sensor also uses the resistor heating method.
Securing the inflow at this particle introduction section to create a stable flow is directly linked to the precision of the sensor because it leads to a reduction in variation and detection error.
3. Technical issues
As described above, the following are necessary to increase the microparticle measurement accuracy:
- (1)
- Increase the S/N ratio to detect finer microparticles accurately
- (2)
- Increase the inflow to reduce the variation in detection results
Previously, compact sensors which are incorporated into home electronics did not have a level of performance which could satisfy (1) and (2) described above. As a result, the detection accuracy was low and the detection results varied significantly.
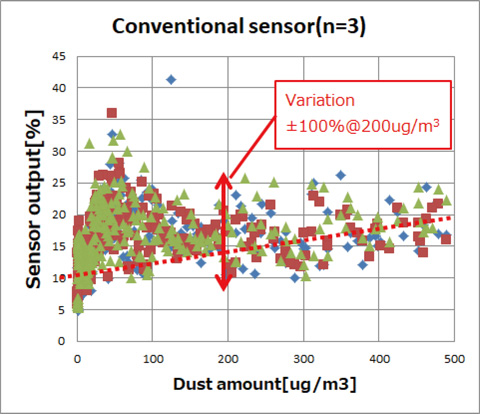
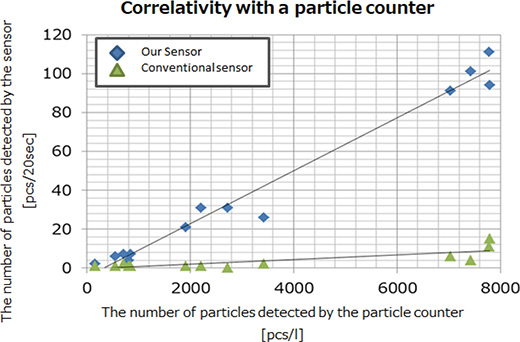
Fig. 3 is a graph showing the results of measuring the correlation with a dust concentration measuring instrument obtained by measuring cigarette smoke with a conventional sensor. We can see that the variation is significant and the correlativity is low.
The issues concerning above (1) and (2) are as described below.
3.1 The issue concerning the securement of S/N ratio
In order to enhance the microparticle detection performance, the intensity of the scattering signal needs to be increased first. Although signal intensity can be increased by general methods such as increasing the intensity of and sensitivity to projected and received light and increasing the gain on the circuit, the influence of noise also increases. In particular, since particular detection sensors need to retrieve the faintest scattered light from microparticles of 0.5–1 μm in size, how to reduce noise signals is the issue.
In addition, since the housing size cannot be increased because the sensors are incorporated into home electronics, all the light which passed through the detection area is scattered in the housing. This light reaches the light-receiving section to generate steady output. Such unexpected light other than the signal light from particles is called “stray light.” This stray light prevents the increase of S/N ratio as a significant noise source.
3.2 The issue concerning the securement of inflow
The particle detection sensors based on the light-scattering method detect signals by capturing the particles passing through the detection area stochastically. Therefore, the securement of particle inflow is greatly related to detection accuracy in terms of increasing the detection opportunity.
The sensors which are incorporated into instruments often have a resistor heating structure which generates a rising air current using inexpensive heater resistance owing to cost requirements. In this case, it is important to create a structure which leads the air flow of the rising air current to the detection area efficiently.
Generally, when a viscous liquid flows around an object, the action of viscosity forms a boundary layer near the object surface, which reduces the current speed. In theory, the current speed is expressed by the model shown in Fig. 4. We can see that if a fluid flows into a circular tube with a diameter of a, the average current speed is proportionate to the square of the circular tube diameter 2).
-
Average current speed

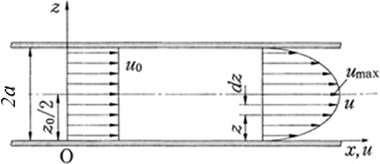
Since the current speed bears a proportionate relationship to the inflow, if the container wall surface approaches the flow path owing to a reduction in its size, the current speed decreases to cause a decrease in inflow. On the other hand, if the space is expanded to secure the inflow, the sensor container increases in size. This tradeoff makes it difficult to secure the inflow.
4. Technical content
Our approach to the issues described above and the structure which resolved them are as follows:
4.1 Our approach to reducing noise
For this sensor, to detect faint signals from 0.5 μm-diameter particles, we developed a new high-sensitive photo IC (PIC) to attempt to increase the detection signal intensity. The PIC has a simple structure in which a photo diode and a current amplifying circuit are placed in a chip. Therefore, the sensitivity of the PIC is dependent on the current amplifying circuit inside and very flexible.
However, as described above, increasing the sensitivity too much may increase the influence of stray light in the container, causing output saturation.
The most efficient method to eliminate the stray light is to discharge it out of the sensor. However, since a significant amount of ambient light may enter the sensor section if the optical system is oriented to the opening, conventional sensors could not have this structure to reduce stray light. As a result, it was too difficult to secure sufficient signal intensity for detecting microparticles.
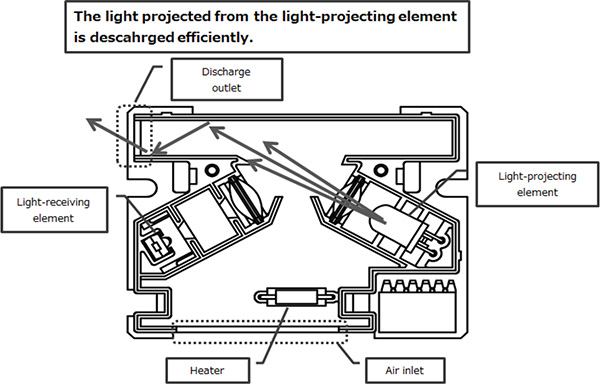
However, this sensor is devised to have the particle outlet in the opposite direction to the light-projecting element intentionally to discharge most of the stray light out of the sensor. At this time, we succeeded in leading stray light outside the sensor while promoting the reflection in the housing, by bending the opening section at a given angle but not placing it on the extension of the light path (Fig. 5). Conversely, adopting this structure also produced a disturbance suppression effect that prevents the light that entered from outside from easily reaching the light-receiving section (Fig. 6).
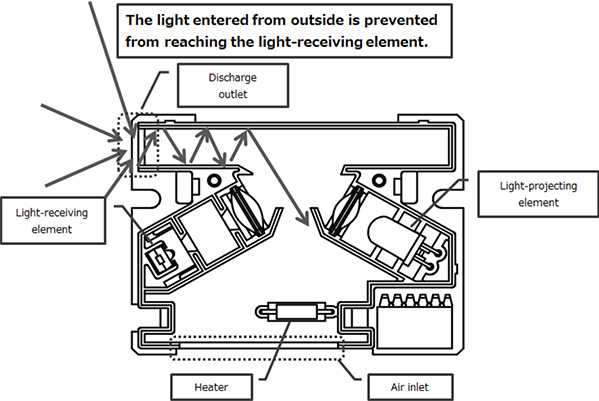
For this reason, we could decrease the stray light level to onefifth or lower compared with conventional sensors.
Next, we eliminated electrical noise from the light signals retrieved from the above structure as described below.
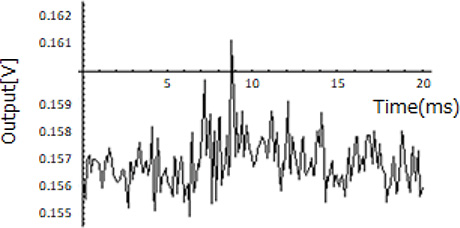
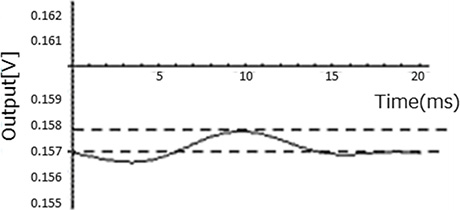
Since electrical noise contains a significant amount of highfrequency components, it is necessary to preform filtering properly considering the frequency of particle detection signals. Since this sensor utilizes rising air currents generated by resistance heating, the inflow velocity of microparticles is slow and they pass through the detection area at approximately 100–500 Hz. Therefore, the signals which are 1 kHz or higher can be regarded as noise. By filtering high-frequency waves to amplify the signal frequency of microparticles selectively, we could achieve a sufficient S/N ratio for 0.5 μm-diameter standard particles which were difficult to detect in the past. Fig. 7 shows the waveform before the highfrequency wave filtering, and Fig. 8 shows the waveform in which high-frequency signals are cut by signal processing.
4.2 Approach to inflow
As described in Section 3.2, the smaller the interface is for the flow path, the smaller the loss of inflow becomes. Therefore, to secure the inflow first, we studied how to expand the space in the small container (Fig. 9).
It is true that expanding the space in the container leads to an increase in the inflow. However, we reached the idea that the important thing is not simply to increase the inflow, but how to secure the particle density in the detection area.
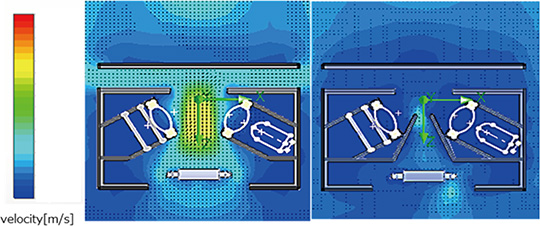
Therefore, we thought of adopting a structure in which the flow path is narrowed down toward the detection range. This is intended to collect particles toward the detection area efficiently (Fig. 10).
However, as a matter of course, reducing the size of the flow path aperture too much decreases the inflow significantly (Fig. 11).
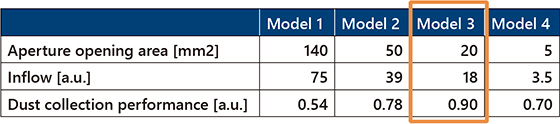
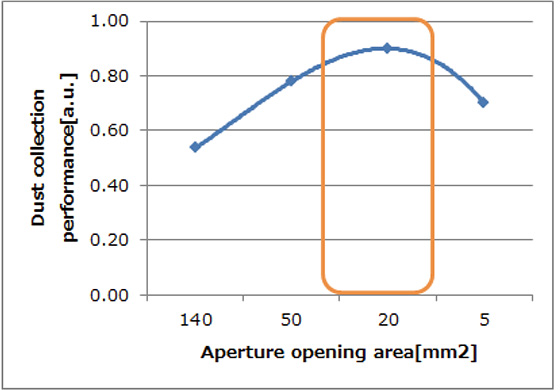
Therefore, the optimum aperture shape needs to be determined using the aperture opening area and the inflow as parameters.
The dust collection performance is to be expressed by the ratio between the inflow and the aperture opening area. This is an indication of how many particles that flowed in are collected in the detection area.
Through the evaluation of the dust collection performance indicator conducted using several models, we derived an optimum structure and achieved a detection efficiency which was six times higher than that of conventional sensors (Fig. 12).
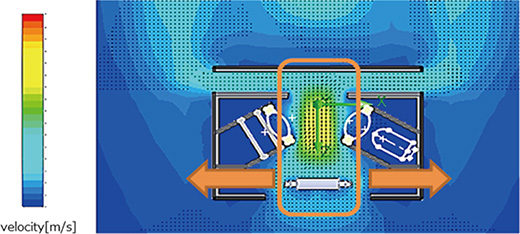
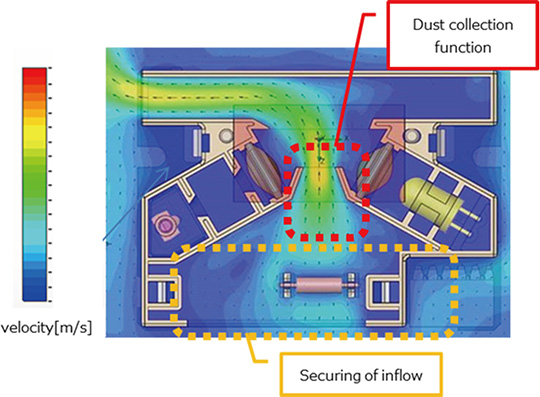
This structure may be called a hybrid structure which realizes both the “securing of inflow” and a “dust collection function” by forming a funnel-shaped dust collection structure in which the space near the air inlet is expanded and the particles are guided from near the detection area while securing the inflow (Fig. 13)
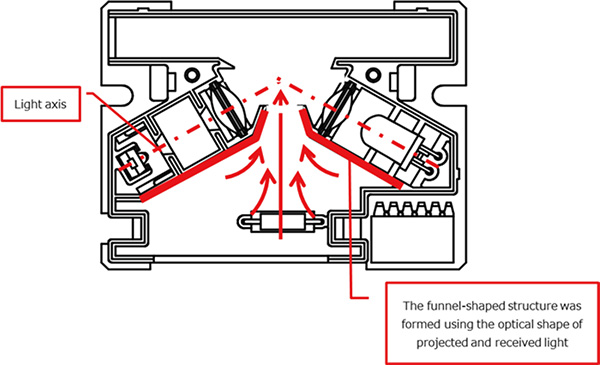
In addition, this dust collection structure is characterized by simultaneous realization of the integration of the optical shape and flow path and the reduction in size as a result of forming this structure utilizing the optical shape of projected and received light. This structure enhances both the flow path and optical function because changing the taper angle of the funnel shape in two stages reduces the resistance, which prevents fluid flow as well as realizes the function of suppressing stray light optically (Fig. 14).
In order to confirm the effect of increasing the detection opportunity produced by this structure, we compared the detected number of particles using a particle counter. Fig. 15 shows that the detected number of particles increased drastically compared with the conventional products.
5. Effect
We would like to show the results of confirming the effects of the two aforementioned approaches, based on the standard for air purifiers (GBT18801-2015).
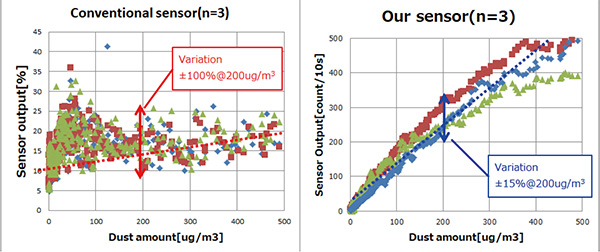
We conducted a measurement according to the above standard in an environment where the cigarette smoke density fluctuated in a closed space to confirm the correlation of the fluctuation of sensor output with the dust concentration measuring instrument used (Fig. 16).
As a result, the variation relative to the dust concentration measuring instrument under the cigarette smoke environment was reduced to +/− 15 % when the new sensors were used, while it was +/− 100 % when conventional sensors were used.
In addition, we also investigated the case where this sensor was applied to the general environment where PM2.5 is scattering.
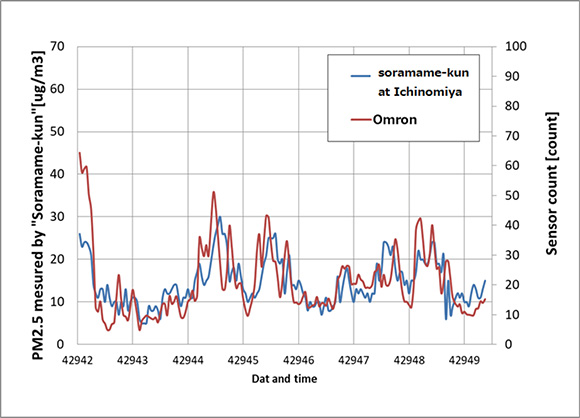
Fig. 17 is a graph showing the results of confirming the correlation of the number of particles detected by this sensor (Blue line) with the results of measuring PM2.5 with the widearea air pollutant monitoring system (Soramame-kun) installed in each prefecture (Red line). The measurement was conducted in Ichinomiya city, Aichi Prefecture for eight days. As a result, we confirmed that the measurement results of this sensor followed up the increase/decrease of PM2.5 indicated with the red line and obtained the correlation coefficient of 0.79. Since it is said that there is a correlativity if a coefficient of correlation of 0.6 or higher, we can see that this value shows sufficient correlation.
6. Conclusion
As a microparticle detection sensor, we developed a sensor which can detect microparticles as small as 0.5 μm in diameter that also achieves a much higher correlation accuracy than conventional sensors in terms of airborne measurement, by combining a new optical shape with a new flow path structure.
With increased concern about PM2.5, the need for particle detection sensors are increasing not only in terms of air purifiers targeted this time, but also for incorporation into air conditioners and cleaners, stationary terminals which are familiar to everyone and enable constant monitoring, in addition wearable terminals. This development provides a solution to such social needs.
In the future, to satisfy additional customer needs, we would like to develop smaller sensors that can be incorporated into any of the items described above, as well as sensors equipped with a dust concentration output function that can give more accurate information to users.
References
- 1)
- Evaluation Committee for Measurement of Fine Particulate Matter (PM 2.5). ”About the measurement method of microparticulate matter (PM2.5) in the atmosphere”. Ministry of the Environment. 2008.
- 2)
- Hidemi Yamada. et al. Rheology-Foundations of Fluid Dynamics and Fluid Machinery. Morikita Publishing Co., Ltd., 2016.
The names of products in the text may be trademarks of each company.