


Sensing Technology for Worker Location Adaptable to Various Factory Environments for Measuring Actual Work Time
- Industrial Engineering
- Productivity improvement
- Worktime measurement
- Human sensing technology
- Image processing
In recent years, production factories are required to identify the productivity bottlenecks and factors to respond to the diversification of production variety and/or worker turnover. An analysis of bottlenecks requires not only equipment operation data but also work time. However, the method for measuring work time has not been established.
Therefore, we have developed a worker-position-detection technology for work time measurement. Our developed method enables the detection of the position of color markers worn by workers by an image processing algorithm. In general, color detection is sensitive to environmental changes, such as brightness, so initial setup takes much time. We improved the algorithm so that it can detect color markers even when the environment changes. In addition, by turning the functions necessary for configuration into software tools, it is possible to configure in a short time. Since the setting time will be significantly reduced, it can be installed in many environmental factories. In addition, the results of the verification at a factory confirmed the high accuracy of work time measurements with a work time accuracy of less than 0.1 seconds.
By utilizing this technology, productivity issues of the dispersion of work time by workers and processes that take longer than expected can be clarified so that customers are able to solve issues in a short time.
1. Introduction
Recent factories are challenged by increased variation factors, which immediately lead to reduced productivity or product quality. Responsible factors include increases in multi-variety, small-lot production due to diversified consumer needs or frequent workforce turnover due to falling retention rates. Variation factors can only be identified with data on equipment and tasks during production. However, no methods available are intended explicitly for the automatic collection of worker’s task data. One of the known methods of worker’s task data acquisition is the direct time study (DTS) method.
This method involves observers taking time measurements while observing workers on-site and could be made more efficient. Besides the DTS method, another method known as the work sampling method is also available. In this alternative method, observation times are randomly set to observe the content of a task and obtain a statistical breakdown of the task’s time and content1). However, even this method requires at least one day for analysis and is challenged by the inability to analyze variation factors that occur outside set times.
Many have proposed automated measurement technology for work time to solve this problem. One such proposed method is worker’s task recognition technology. This method uses AI to analyze workers’ hand and finger movements based on video images and to recognize worker’s processes2-4). On the one hand, task recognition technology enables detailed task analysis. On the other hand, this technology requires installing cameras at one-to-two-meter intervals, posing the challenge of massive man-hours for implementation.
Other automatic measurement methods proposed for work time include one that measures process dwell time as work time5). This method measures workers’ positions to estimate the work-area dwell time per process. Known examples of worker’s positioning methods necessary for this purpose include those that use ultra-wideband (UWB) radio or camera-based human image recognition.
However, radio-based methods have the problem of being time-consuming to implement, involving antenna installation and calibration. Meanwhile, human image recognition-based methods generally take whole-body shots obliquely from above and hence cannot identify individuals. Besides, these methods are challenged by the inability to detect workers hidden behind equipment or other workers.
As a technology to solve the above challenges, this paper presents a worker’s positioning technology that can be implemented on-site quickly and accurately. Section 2 details the challenges in the existing technologies. Section 3 describes in detail our developed worker’s positioning technology. Section 4 discusses the verification results for the principle of our proposed technology (identification accuracy verification). Section 5 discusses the results of implementing this technology in our factory production line and performing a verification of the effectiveness of time measurement. Section 6 concludes this paper with future challenges and prospects.
2. Challenges
2.1 Production system of our interest
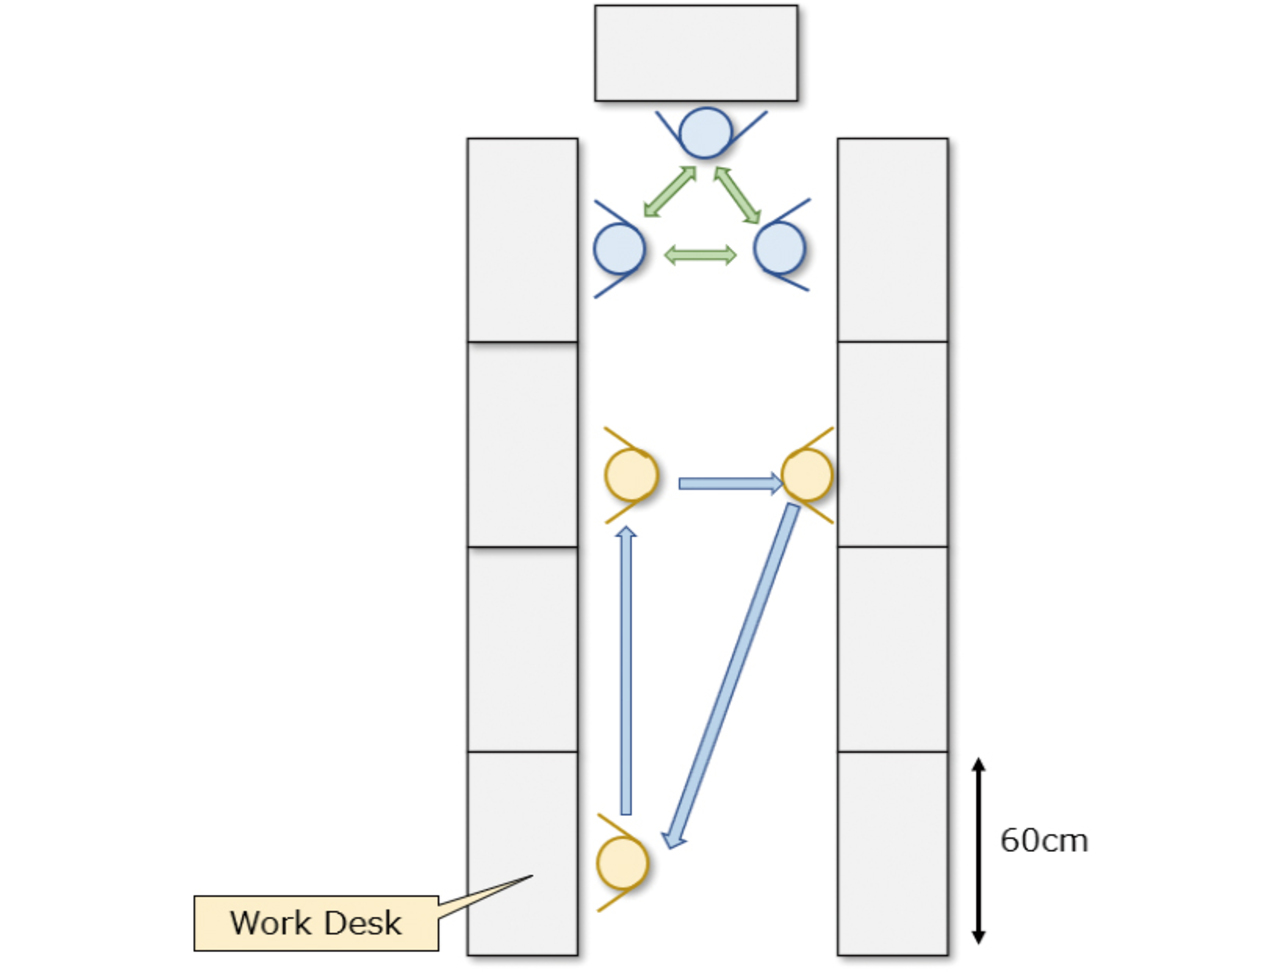
This paper covers processes where workers perform tasks while moving between multiple areas. More specifically, it assumes a cell production system or multi-machine handling process. Fig. 1 shows a typical cell production system (U-shaped). The cell production system is a production system adopted for electronic parts and automotive assembly processes. In this process, tasks are performed by a worker or shared between several workers, depending on the production volume. Each workbench is approximately 60 cm wide. Each process task is performed within approximately 5 to 20 seconds. The assumed moving range for each worker is approximately 15 meters at maximum.
2.2 Requirements for automated worker’s positioning
The following functions and performances are required of our worker’s positioning technology to enable the automatic measurement of work time for the process shown in Subsection 2.1:
1) Positioning accuracy
The positioning is required to be sufficiently accurate relative to the workbench width. Hence, the tolerance must not exceed 10 cm. As regards the accuracy measurement range, a 15 m by 5 m area was provided to accommodate a typical cell production line with a safe margin.
2) Work time measurement accuracy
work time varies by at least 1 to 2 seconds per process. Hence, the measurement accuracy tolerance must be sufficiently smaller than work time variations.
3) Worker identification
A cell line involves multiple workers performing tasks in the same work area. As such, it requires worker identification as well as worker’s positioning. This identification must accommodate frequent entries and exits of workers to and from the line, posture changes, or changes in the task environment factors, such as lighting brightness.
4) Easy implementation
Preparations, such as calibrations, are required before starting measurement. A factory has a variable lighting environment and line layout, making their premeasurement calibrations general necessities. Therefore, our proposed technology must be speedily implementable.
2.3 Challenges in existing technologies
This subsection explains the technical challenges according to a broad division between the conventional worker’s positioning technologies, in other words, wireless radio wave and human recognition AI systems.
1) Wireless radio wave systems
Known wireless radio wave systems include satellite-based GPS positioning, Wi-Fi positioning using access points, Bluetooth beacon positioning, and wireless (UWB) triangulation positioning.
Among these systems, GPS, Wi-Fi, and Bluetooth positioning have errors of several meters or more and cannot be used to achieve our purpose of measuring workers’ moving distances between cell production workbenches.
Wireless triangulation allows positioning within errors of several ten centimeters6). However, UWB positioning takes time to implement. The cause is that it requires the calibration work of receiver position adjustment for radio wave shielding and reflection-effects elimination, as well as installation and wiring work at elevated heights. It takes at least one day or more to complete these tasks. The wireless system has another problem: although it may help identify bottlenecks present in work- times, it provides no visual images of specific real-time on-site situations and, hence, is less likely to lead to feedback for improvements.
2) Human recognition AI system
The human recognition AI system is a method that uses learned human recognition models to detect workers captured in images. This system is utilized for, for example, pedestrian detection in automated car driving. It achieves high-precision detection when it can use a full-body image of a person7). However, it generally does not support personal identification. Besides, when built in a cell production system, it has the problem of the inability to detect workers hidden behind equipment or other workers. One of the solutions to the problem is to take direct downward shots from the ceiling directly above the cell line, which may provide a visual image of workers but only of the tops of their heads. Therefore, using this solution in human recognition AI only reduces detection accuracy.
3. Our proposed method
As explained in Section 2, no technology available during our study met the required positioning accuracy, detection accuracy, worker identification, and implementability for worker positioning.
Therefore, we developed a worker’s positioning technology that uses multiple color markers (color caps). Such color marker-based position detection methods have been traditionally known in image recognition. An example is a method that tracks preset feature objects8). However, such a method is prone to false detection of similar colors and accuracy deterioration due to lighting brightness. Our developed method adopted an algorithm and setup tool specifically customized for factory work time measurement to solve this problem. Table 1 shows a list of anticipated factory environmental characteristics and measures.
| Variation factor | Factory environmental characteristic | Measure (color detection technology) | |
|---|---|---|---|
| Lighting | Color | The initial value varies depending on the site but remains unchanged over time. | Hassle-free initial setup tool (gain/color adjustment) |
| Illuminance | |||
| Similar color | Floor color | Color detection algorithm development 1. Multi color range setting 2. Tracking correction 3. Size specification |
|
| Equipment and materials | Present | ||
| Worker’s posture change | Ceiling-to-worker distance remains almost constant. | ||
| Line scale | 2 to 15 m | Interlocking of multiple cameras | |
Moreover, we developed a hassle-free initial setup tool, considering that lighting color/brightness remains almost unchanged over time, though variable depending on the factory. To address the issue of false detection of similar colors, we improved the color detection algorithm and added tracking correction. Subsection 3.1 describes the improvements to the algorithm. Subsection 3.2 presents an overview of the “toolization” of the initial setup procedure.
3.1 Color detection algorithm
1) Multiple color ranges of detection
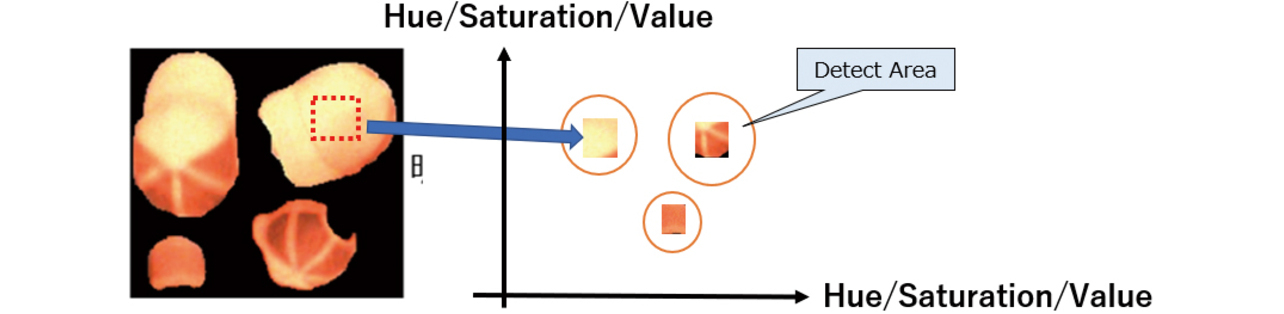
In standard color detection, one detection area per color is set in an HSV color space (coordinate system of hue, saturation, and value). However, when it comes to production shop floors, the on/off of spot or ambient lighting and other affecting factors exist. Consequently, the HSV values vary depending on the place, resulting in reduced color detection accuracy. Moreover, equipment and materials or workpieces similar in color to the color cap lead to false detections. To solve this problem, we specified a range of areas to accommodate the color variation of the color cap. The idea here was that even if the HSV values vary, the resulting values can be classified by multiple clusters. More specifically, we employed the K-means method to classify the HSV values of a color cap’s image shot on-site beforehand. This method performs clustering based on the distance between data points under the theory that proximate data points belong to the same cluster.
Fig. 2 shows the concept of detection area setting for an orange color cap. In this example, three detection areas were set to accommodate the cap’s hue and brightness variations.
2) Correction of the detection results for the color cap
As explained in the previous section, detection accuracy deteriorates because of changes in lighting color and illuminance. Moreover, non-detections occur when a worker changes posture (e.g., by squatting) or is hidden behind an adjacent worker. Our solution to this issue was to track human motions and predict the direction of movement for detection result correction. For this prediction, we used optical flow analysis. More specifically, we specified the following steps of color detection to be consistently followed to perform the abovementioned correction:
- Predict the cap’s direction of movement based on previous points of detection and current position.
- If no cap is detected, interpolate detections in the predicted direction of movement.
- Exclude detection results that fall far outside the prediction.
This method is specifically customized to detect workers’ positions in addition to the tracking target. As such, it performs corrections without detecting completely stationary objects. We took advantage of this aspect to prevent false detections.
3.2 Easy implementation using the initial setup tool
We developed a setup tool with the following functions as widgets for speedy implementation without specialist skills in image recognition:
1) Camera gain adjustment
Image shooting with high visibility to the human eye causes whiteouts, reducing task measurement accuracy (Fig. 3(a)). Accordingly, we intentionally reduced the camera gain to prevent whiteouts. More specifically, we “toolized” a function that allows the worker to adjust the gain until no whiteouts are visible while checking the color spectrum (Fig. 3(b)). As a result, even a layperson can now make gain adjustments rapidly.
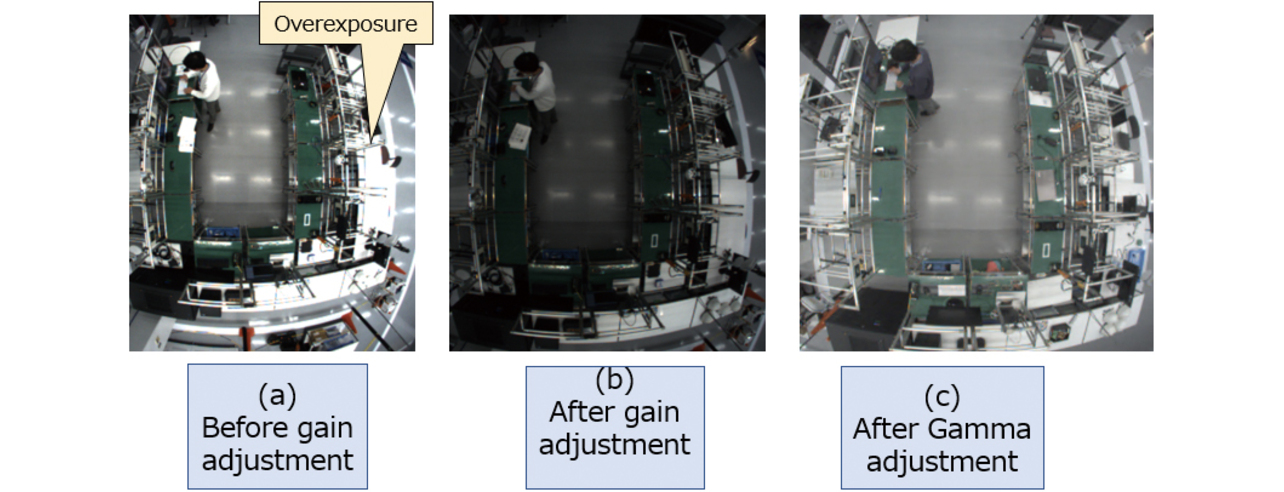
Incidentally, this tool makes gamma correction after color detection and saves the corrected results to secure useful visibility for process improvement (Fig. 3(c)).
2) Color correction
We also “toolized” the color detection area setting mentioned in Subsection 3.1. More specifically, we made it possible to perform the following steps just by button operations to specify a color detection area:
- (1)Adjust the camera white balance.
- (2)Shoot a video clip of the target walking on the line with a color cap on (approx. 1 min. per color).
- (3)Classify the HSV values of the color cap in the obtained video images into clusters to specify multiple color detection areas.
- (4)Replay the video and check the color cap detection results based on the specified detection areas.
As a result, these steps have enabled the speedy setting of color detection areas.
Thus, even a layperson can now perform the initial setup rapidly. Moreover, we added linkable functionality between up to three cameras per personal computer to this tool to support even a relatively extensive cell line that does not fit within the coverage of a single camera.
4. Verification of the color detection algorithm
For the algorithm and tool described in Section 3, we verified their effectiveness in a lab environment according to the following methods:
4.1 Identification of the detection areas and the worker
The first step was to perform verification for the detection areas and accuracy. This verification used eight caps of different colors to check for false and non-detections of a total of 18 postures (three different postures [upright standing/forward leaning/squatting] taken at six points within 3 meters from directly below the camera). The camera used was a fisheye lens camera. The ceiling height was 3 meters. The worker’s height was 1.7 meters. The worker’s position was set as the center of the rectangular cap-color detection area. Table 2 shows the distances from directly below the camera for each color and the experiment results for the occurrence numbers of false and non-detections.
| 2 m | 2.5 m | 3 m | |
|---|---|---|---|
| Cyan | 0 | 0 | 3 (non-detection) |
| Orange | 0 | 0 | 0 |
| Pink | 0 | 0 | 0 |
| Yellow | 0 | 0 | 3 (non-detection) |
| Light green | 0 | 0 | 3 (non-detection) |
| Green | 0 | 0 | 3 (non-detection) |
| Red | 0 | 4 (False detection) | 4 (False detection) |
| Purple | 6 (non-detection) | 6 (non-detection) | 3 (non-detection) |
The six colors other than red and purple were verified to be detectable without false or non-detections at distances within 2.5 meters from the camera’s center. Non-detections occurred to many of the colors at a distance of 3 meters. The cause of such non-detections was that because of the characteristics of the fisheye lens camera, the cap appeared smaller with an increased distance from directly below the camera. Moreover, even at the 2.5-meter range, false detections of the red color occurred at four points, and non-detections of the purple color occurred at all six points.
The next step was to consider the responsible factors for these false and non-detections. Table 3 shows the results of measuring the HSV values of each color for this purpose.
| Color | Hue (H) | Saturation (S) | Value (V) |
|---|---|---|---|
| Cyan | 196 | 171 | 68 |
| Orange | 12 | 206 | 204 |
| Pink | 2 | 183 | 117 |
| Yellow | 37 | 165 | 130 |
| Light green | 66 | 129 | 159 |
| Green | 114 | 108 | 83 |
| Red | 7 | 207 | 115 |
| Purple | 228 | 94 | 55 |
The hue and value differences between the red and pink colors were as small as 5 and 2, respectively, which probably led to false detections. The purple color had lower saturation and value than the other colors and was probably difficult to detect in the first place. On the other hand, the orange and pink colors were detectable, suggesting that colors were detectable with a hue difference of 10.
From the above observation that six colors were identifiable in a 5-square-meter area, we consider that our color detection algorithm could identify workers in many of the production systems for which it is intended. For large-scale lines with seven or more workers, authentication would be achievable by making position and tracking corrections for workers wearing caps of the same colors.
4.2 Flexible environmental adaptability
We evaluated the effects of lighting color and illuminance for flexible environmental adaptability. We used the six identifiable colors for verification.
1) Lighting color
As described in Subsection 3.2, the color caps’ hue changes due to lighting color were minimized by camera white balance adjustment. Table 4 shows the HSV values of the orange and pink colors, whose hue difference was small, as the representative HSV values after the white balance adjustment for each lighting color.
| Color | Color temperature [K] | Hue (H) | Saturation (S) | Value (V) |
|---|---|---|---|---|
| Orange | 2700 | 17 | 186 | 228 |
| 5000 | 16 | 189 | 214 | |
| Pink | 2700 | 7 | 164 | 172 |
| 5000 | 4 | 168 | 169 |
The orange and pink colors showed a hue change of 3 or less for the color temperature change. These values were sufficiently small relative to the hue difference (10) between the orange and pink colors. Other colors showed similar tendencies. The lighting color change did not result in occurrences of false detections/non-detections.
2) Illuminance
As described in Subsection 3.2, the effect of illuminance was minimized by camera gain adjustments. Table 5 shows the HSV values after gain adjustments for illuminance changes.
| Color | Illuminance [Lux] | Hue (H) | Saturation (S) | Value (V) |
|---|---|---|---|---|
| Orange | 530 | 16 | 220 | 168 |
| 700 | 16 | 218 | 180 | |
| 820 | 16 | 221 | 181 | |
| Pink | 530 | 4 | 175 | 132 |
| 700 | 7 | 186 | 123 | |
| 820 | 4 | 177 | 145 |
The orange and pink colors showed a hue change of 3 or less for illuminance changes. These values were sufficiently small relative to the hue difference (10) between the orange and pink colors. As with the case of lighting color, other colors showed similar tendencies. The illuminance changes did not result in occurrences of false detections/non-detections.
The above verification confirms that our developed algorithm and tool enable color detection without occurrences of false or non-detections even when the lighting color or illuminance varies.
4.3 Positioning accuracy
Then, we performed verification for positioning accuracy. This verification was performed in an experimental cell line environment of the size described in Subsection 2.1. A color cap was fixed and measured for 30 seconds at five points directly below the camera and the line’s front and back corners (four corners of the 2.5-square-meter area directly below the camera) to measure variations in measurement position. Table 6 shows the variations in pixels (in the X- and Y-axis directions) and the results of their conversion into lengths.
| Variations (pixel value) |
Variations (length [cm]) |
|||
|---|---|---|---|---|
| X | Y | X | Y | |
| Directly below | 2.1 | 2.1 | 1.7 | 1.7 |
| Line’s left-back | 4.0 | 0.6 | 0.0 | 0.5 |
| Line’s right-back | 0.0 | 0.0 | 0.0 | 0.0 |
| Line’s left-front | 0.0 | 0.4 | 0.0 | 0.3 |
| Line’s right-front | 0.0 | 2.4 | 0.0 | 2.1 |
All the variations at the five points were less than 5 cm, confirming that the positioning accuracy requirement was met.
4.4 Summary
The above verifications show that our developed algorithm sufficiently met the required worker identification performance, flexible environmental adaptability, and positioning accuracy for work time measurement in manned production systems represented by cell production systems.
5. Verification of the work time measurement
Then, we implemented our developed solution on the factory production shop floor to verify it for implementability and work time measurement accuracy.
5.1 Implementability Verification
Using the tool described in Subsection 3.2, we measured the required initial setup time. The results were as follows: it took 3 minutes for gain adjustment and 10 minutes for color correction per camera, respectively. Therefore, we consider that the tool could be rapidly implemented.
5.2 Work time measurement
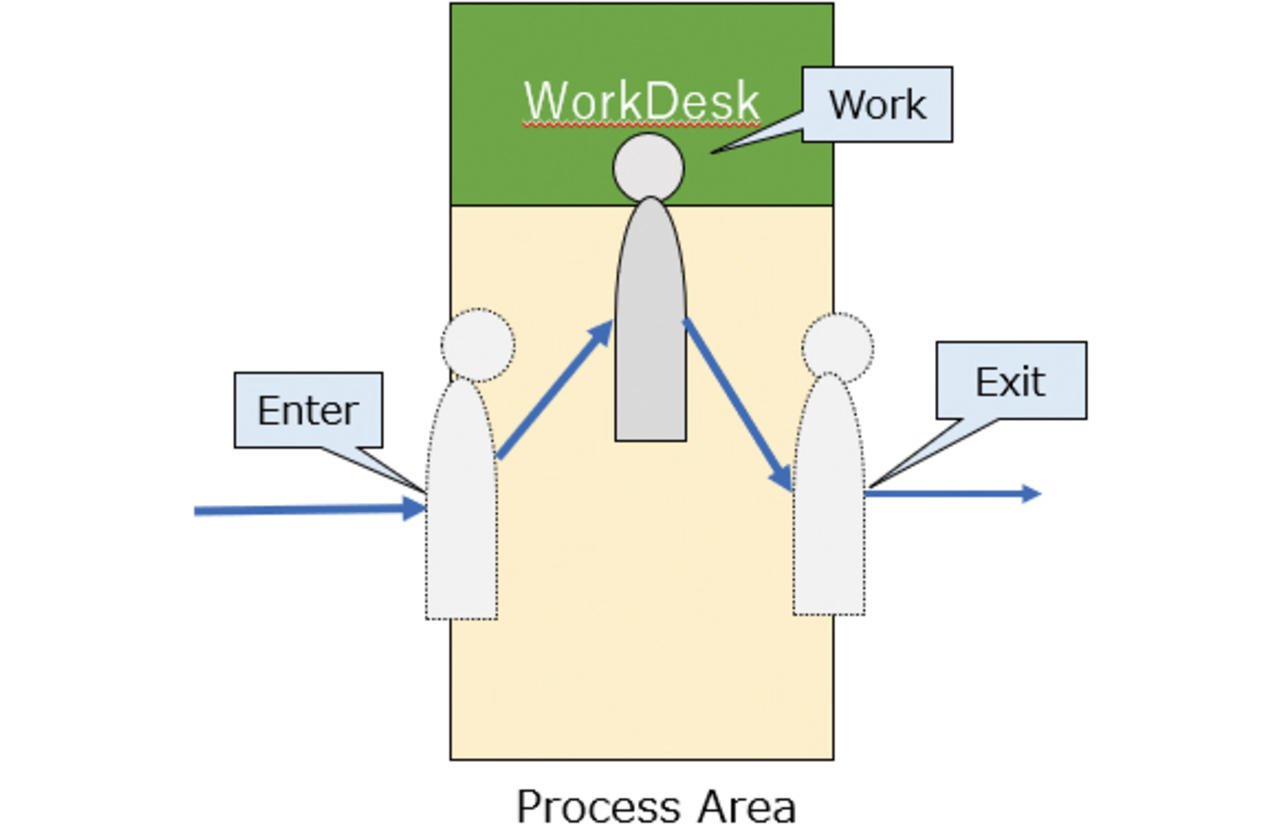
We performed this verification test on a four-manned cell production line. We specified a work area for each of the ten 60 cm wide workbenches. We regarded the dwell time in each area as work time. What we mean here by the term “dwell time” is the time that starts from the entry into the area, followed by the task duration at the workbench, and ends with the exit from the area as shown in Fig. 4. The results for work time measurement accuracy were evaluated by comparison with the results of visual time measurement with a stopwatch.
5.3 Verification results
Table 7 shows the results of comparing automatically measured work times with visually measured results.
| Cycle | Automatically measured work time (sec) |
Visually measured result (sec) |
Error |
|---|---|---|---|
| 1 | 8.14 | 6.90 | 1.24 |
| 2 | 9.05 | 7.80 | 1.25 |
| 3 | 9.44 | 8.30 | 1.14 |
| 4 | 9.14 | 7.92 | 1.22 |
| 5 | 7.88 | 6.67 | 1.21 |
| 6 | 8.49 | 7.29 | 1.20 |
| 7 | 7.88 | 6.66 | 1.22 |
| 8 | 8.18 | 6.97 | 1.21 |
| 9 | 7.61 | 6.41 | 1.20 |
| 10 | 7.92 | 6.70 | 1.22 |
In each of the ten cycles, the work time measured by our proposed method was 1.1 to 1.2 seconds longer than the visually measured result. The responsible factor was the difference in definition between the two work times, while the latter was the time from the start to the end of the task duration at the workbench, the former consisted of that time and additional time required to walk to the workbench after entering the area and to exit the area after completing the task.
Thus, the automatically and visually measured work times showed more than 1-second differences. However, we focused on the point that these time differences remained nearly constant across all cycles. In other words, the moving speed is constant on a production shop floor regardless of the work time. Therefore, subtracting the moving time from the measurement time per our proposed method enables work time measurement with the same accuracy (error < ±0.1 seconds) achievable by existing methods. Thus, with variations in work time being sufficiently smaller than measurement errors, our proposed method can be utilized for worker’s work time measurement.
6. Conclusions
Aiming to achieve automated measurement of work time, we developed worker’s positioning technology using color markers. More specifically, the aim is to shoot workers’ images from the ceiling and detect the positions of the color markers captured in the images. We developed the following detection algorithms: a multiple marker-color detection area setting algorithm using the clustering method and a worker’s position correction algorithm using optical flow, thereby enabling detection regardless of illuminance and lighting color changes or worker’s posture changes. Moreover, we “toolized” the initial setup, including calibration to suit the shop floor conditions, enabling easy implementation of our proposed technology in various factory environments.
The effects of implementing our proposed technology include obtaining information on, for example, out-of-standard tasks leading to quality defects and work time variations between skilled and unskilled personnel through the real-time acquisition of all work times during production. We expect that appropriate task modifications based on such information will help stabilize productivity/quality even with an increasing number of variation factors.
We also expect that feeding back the obtained information to workers will lead to improving workers’ proficiency and motivation. In addition to the above-discussed kinds of shop floor-led quick adaptation to changes, we will work on developing technologies aimed at creating exciting manufacturing shop floors where workers can tangibly feel improvements in their work skills. More specifically, we will explore technologies for visualizing and analyzing bottlenecks or detecting anomalous worker behaviors based on measured work times.
References
- 1)
- W.-H. Tsai, “A Technical Note on Using Work Sampling to Estimate the Effort on Activities Under Activity-Based Costing,” Int. J. Prod. Econ., vol. 43, issue 1, pp. 11-16, 1996.
- 2)
- S. Okumura et al., “KOTSUMON: Solution for Work Analysis,” (in Japanese), Mitsubishi Electric Tech. Rep., vol. 94, no. 6, pp. 352-355, 2020.
- 3)
- K. Nishida and H. Onda, “Development of Worker’s Nonstandard Motion Detection System in Cell Production Line,” (in Japanese), J. System Control Inf. Soc. Jpn., vol. 33, no. 5, pp. 149-155, 2020.
- 4)
- Library Inc. “3D Video Measurement Software.” (in Japanese), Cosmos. https://www.library-inc.co.jp/product/?id=1372147489-429207&ca=11&list_flg=1 (Accessed: Mar. 6, 2024).
- 5)
- OMRON Corporation, “Data Extraction Apparatus, Control Method, Information Processing Program, and Recording Medium Therefor,” (in Japanese), Patent JP-A 2020-205027, Dec. 24, 2020.
- 6)
- F. Mazhar et al., “Precise Indoor Positioning Using UWB: A Review of Methods, Algorithms and Implementations,” Wireless Pers. Commun., vol. 97, pp. 4467-4491, 2017.
- 7)
- H. Fukui et al., “Research Trends in Pedestrian Detection Using Deep Learning,” (in Japanese), Tech. Rep. IEICE, vol. 116, no. 366, pp. 37-46, 2016.
- 8)
- Library Inc. “2D Video Measurement Software.” (in Japanese), Movetr/2D. https://www.library-inc.co.jp/product/?id=1372146225-105767&ca=11&list_flg=1 (Accessed: Mar. 6, 2024).
The names of products in the text may be trademarks of each company.