


Development of Data Collection/Analysis Platform that Supports Q-upSystem for Improving Non-defective Product Productivity
- Data analysis platform
- SMT
- Solder inspection
- Data warehouse
- Data mart
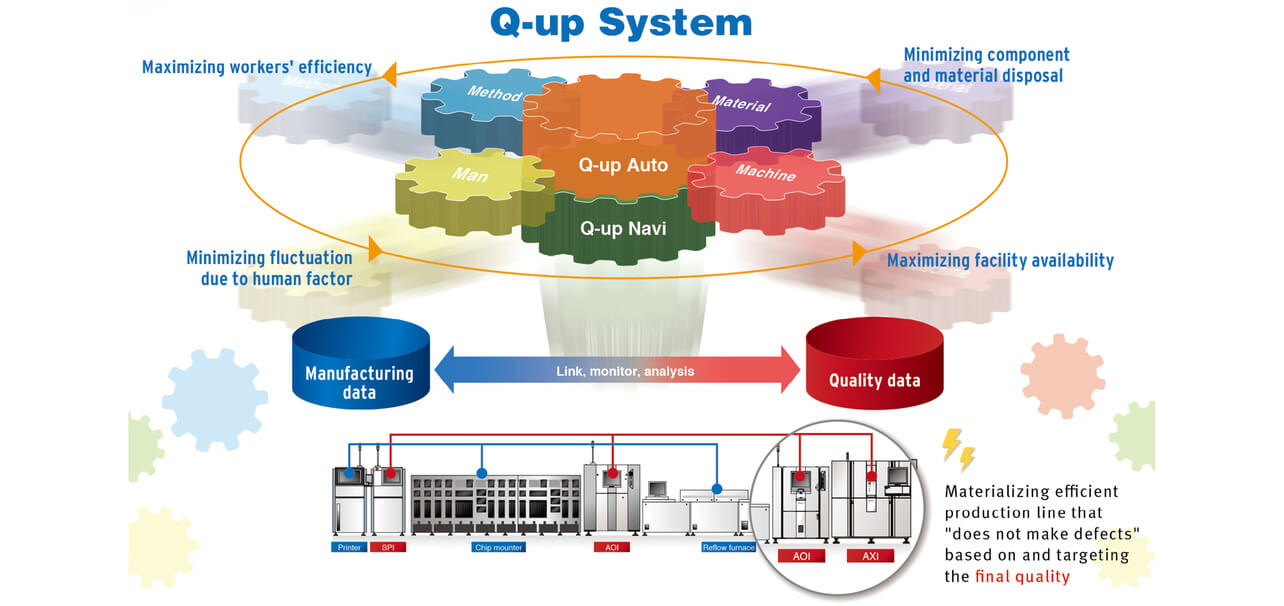
The Inspection System Division has traditionally performed 3D measurement of printed mounting boards and inspected them according to quantified quality standards. AOI (Automated Optical Inspection) and AXI (3D-CT method) inspect the shape of solder. The automated x-ray inspection, Q-upNavi, analyzes quality data and production information from each process inspection device, and Q-upAuto cooperates with a mounter to contribute to production that does not create defects, and many at the production site contribute to the prevention of defective outflow and the maintenance and improvement of quality.
The Q-upSystem, which consists of Q-upAuto and Q-upNavi, is being developed while adding data and processing, and in order to apply step-by-step function expansion to the production site, uses a high-speed server. You need a foundation to realize the function.
In this paper, we developed a Q-upSystem data collection/analysis platform that adds knowledge of linking/accumulating/analyzing manufacturing data and quality data based on the method of constructing a data analysis platform, such as big data. Based on the quality data of the final process, we evaluated the performance of data search/acquisition for the function that optimizes the inspection criteria of the previous process and obtained sufficient high speed without introducing a high-speed server.
1. Introduction
In recent years, automotive safety equipment and hybrid vehicles have rapidly become commonplace, causing a rapid increase in electronic component boards intended for installation on automotive vehicles. Further sophistication is expected with a view to future autonomous driving. High quality is required of parts and components for installation on vehicles. Therefore, it has become necessary to avoid producing defectives in the first place because PCB mounting lines are required to prevent the outflow of defectives and even prohibited from reworking defectives into non-defectives.
On the other hand, skilled mounting line personnel and manufacturing technicians with extensive experience and knowledge have increasingly aged. The human resources to achieve and maintain high quality have been shrinking over the last decade. Even the frontlines staffed with such human resources are under pressure for cost competitiveness and cannot afford to spend many person-hours on improvement. With the increasingly globalized industry, it is required that high quality be achieved even in the locations without human resources to achieve and maintain high quality.
The Inspection System Division has been committed to developing the Q-upSystem (Fig. 1) that uses inspection machine-supplied quality data as the starting point and automatically performs the sequence of machine data linking, data collection, monitoring, and improvement. The aim of the Q-upSystem is to address the so-called Four Ms in variable production operations—Manpower (operators), Machine (machinery equipment), Materials (raw materials), and Method (work method)—and keep making non-defectives to help customers with quality improvement and maintenance and cost competitiveness. The Q-upSystem consists of two subsystems: one named Q-upAuto1), which links inspection machine-supplied quality data with manufacturing data from production equipment (such as printing machine or mounter) to warn of anomalies in real time; and the other named Q-upNavi, which analyzes quality data and production information from the process inspection machines.
The Q-upSystem comprises an application that provides quality improvement functions and a data collection/analysis platform that collects and provides inspection machine-supplied quality data and production equipment’s manufacturing data to the application. The application needs to perform automatic analysis based on large amounts of data to detect quality fluctuations in real-time for quality improvement. Meanwhile, the data collection/analysis platform needs to perform high-speed data linking and rapidly collect linked data of specified conditions from the application.
A PCB mounting process consists of up to approximately 100 production lines and generates manufacturing data and quality data for each cycle time (approximately 10 seconds to 1 minute). The current version of Q-upAuto collects mounter’s manufacturing data and inspection machine-supplied manufacturing data on a board-by-board basis to save the data in individual board-specific files and perform data linking board by board. Quality data contain large amounts of measured values. Hence, the mounter’s manufacturing data and quality data per line amount to approximately 1 GB per day, more than 90% of which is numerical data of measured values. Currently, the Q-upAuto can manage to collect and link three lines’ worth of data per server. However, the Q-upAuto has difficulties simultaneously coping with four or more lines because of frequent file inputs and outputs and cannot serve customers with four or more lines. Accordingly, the data storage method needs improvement. Besides, the current version of Q-upNavi also has a problem. Although able to retrieve inspection results and measured values from more than one inspection process, the Q-upNavi saves measured values in files on a board-by-board basis and takes longer to retrieve multiple boards’ measured values. Thus, the Q-upNavi cannot be used to develop automatic real-time analysis functions.
Typically, a data analysis platform, such as Big Data in recent years, consists of three data layers, including a data warehouse2) as shown in Table 1 and features business intelligence (BI) that supports decision-making. These layers use relational databases or NoSQL databases and are usually built on expensive on-premise servers or the cloud. These technologies are applied to various fields. However, no cases exist of their application to PCB mounting processes because of the following reasons: knowledge is required about linking, accumulation, and analysis of manufacturing data and quality data as explained above, and it is not easy to connect a network to the cloud or to use expensive servers.
| Data depository | Description |
|---|---|
| Data lake | A data lake stores data in native formats as collected from systems or databases that serve as data sources. Separate from the data sources, this data repository can prevent any required data re-collection from affecting the data sources. |
| Data warehouse | An aggregate of data not to be deleted or updated on time series that are organized and consolidated on a purpose-by-purpose basis to analyze data collected from data sources or data lakes. |
| Data mart | A database that stores data extracted from a data warehouse according to specific purposes and processed to suit active use. |
This paper presents how to build a data collection/analysis platform supporting the Q-upSystem that rapidly searches and retrieves quality data for high-volume data collection, linking, automatic detection, and analysis. It describes the characteristics of PCB mounting process data, a data design suitable for automatic analysis, and the basic performance of the data collection/analysis platform we built.
2. Challenges in the Data Collection/Analysis Platform
2.1 PCB Mounting Process Data
A PCB mounting process is configured as follows: a solder printing machine, an SPI, a mounter, a post-mounting AOI, a reflow furnace, a post-reflow AOI, and an AXI are arranged in order from the head of the process. As shown in the upper half of Fig. 2, these machines are arranged straight in a line to flow printed wiring boards (hereinafter called “boards”) from upstream to downstream (left to right in Fig. 2) and perform the mounting on boards. The solder printing machine prints solder on boards via a stencil-like metal sheet. The SPI inspects the printed solder for print quality. The mounter mounts electronic parts on the solder. The post-mounting AOI inspects the parts for the as-mounted condition. The reflow furnace heats fully populated boards to melt the solder and cools the boards to let the solder harden to attach electronic parts onto the boards. The post-reflow AOI and AXI inspect fully populated boards thus finished.
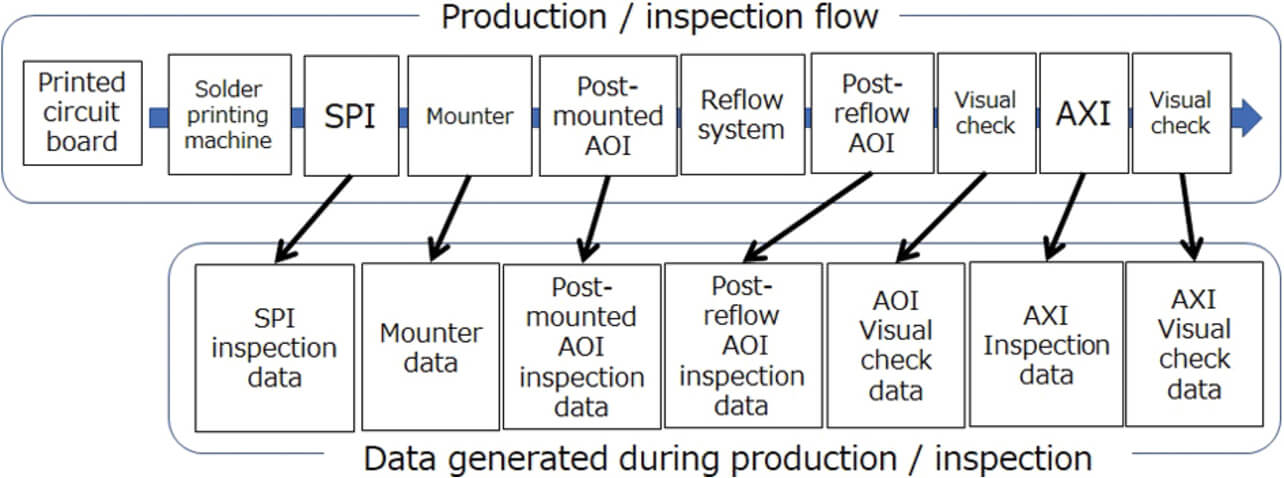
Each board bears a board ID marking for traceability as shown in Fig. 3 and contains one or more substrate pieces. Each substrate piece contains sites bearing circuit numbers and mounted with electronic parts with the pins thereof solder-attached to the substrate. As shown in Fig. 2, individual data are generated after production and inspection. A board undergoes visual inspection only when determined unacceptable by the inspection machine. Then, visual inspection results data are generated for the part and pins in the circuit determined as unacceptable.
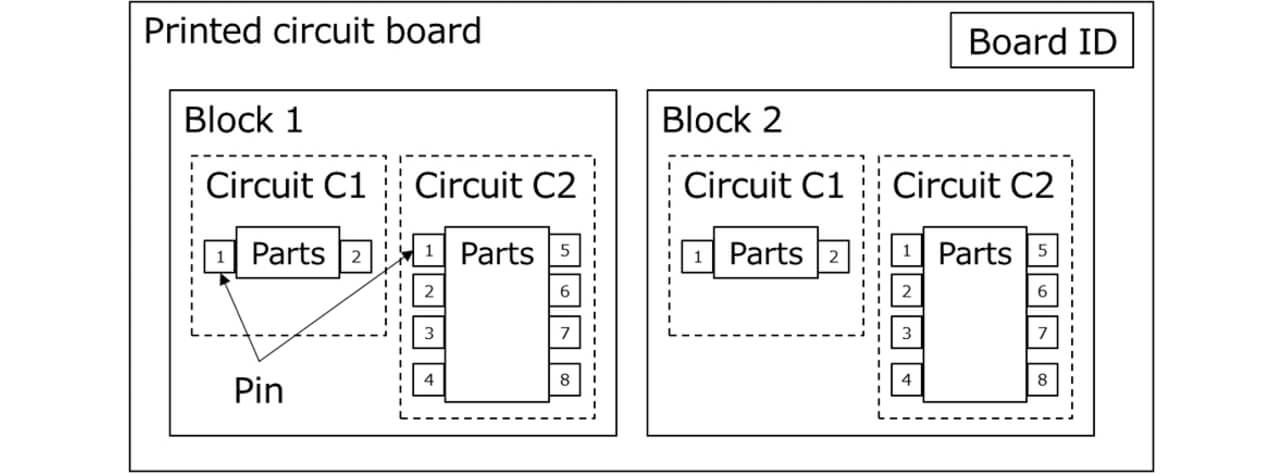
Table 2 shows the quantitative breakdown of quality data per 236 mm × 154 mm board with a total of 938 parts and a total of 2,692 pins on it. The numbers of inspection results for parts and pins were equal to their respective total numbers. The numbers of measured values from the SPI, the post-mounting AOI, and the post-reflow AOI amounted to 29,612, 132,122, and 157,464, respectively.
| Item | SPI | Post-mounting AOI | Post-reflow AOI |
|---|---|---|---|
| Number of inspection results (parts) | ― | 938 | |
| Number of inspection results (pins) | 2,692 | ||
| Number of measured values | 29,612 | 132,122 | 157,464 |
2.2 Challenges in the Data Collection/Analysis Platform
The Q-upSystem’s application performs data collection/analysis/monitoring on a function-by-function basis in real time or at intervals, such as once to 24 times per day or upon a user-defined trigger, and, if conditions are met, performs additional data collection/analysis or improvement processing. The Q-upSystem characterizes itself by using quality data as the starting point for performing the processing. The challenges posed to its data collection/analysis platform are as follows:
- Challenge 1:
Completing the linking of manufacturing data and quality data within the cycle time of the PCB mounting lines (approximately 10 seconds to 1 minute).
- Challenge 2:
Data storage for rapid search and retrieval of quality data and conversion into a format easy for the application to access.
- Challenge 3:
Providing scalability to accommodate a required number of production lines (up to approximately 100 lines) and enabling the development of an in-factory/on-premise system that does not use an expensive server.
Challenge 1 relates to data linking performance per board between manufacturing and quality data. Table 3 shows, as an example, the Q-upAuto’s defect alarm function. To produce the board in Table 2 at a 30-second cycle time, the data collection/analysis platform function in Table 3 must complete linking the manufacturing data covering the populated 938 parts with the inspection results from the three inspection processes within 30 seconds.
| Item | Detail |
|---|---|
| App function | Shows on the UI the IDs of mounter devices that mounted real defective parts encountered. |
| Data collection/analysis platform function | Tabulates in real-time the IDs of mounter devices that mounted real defective parts encountered. |
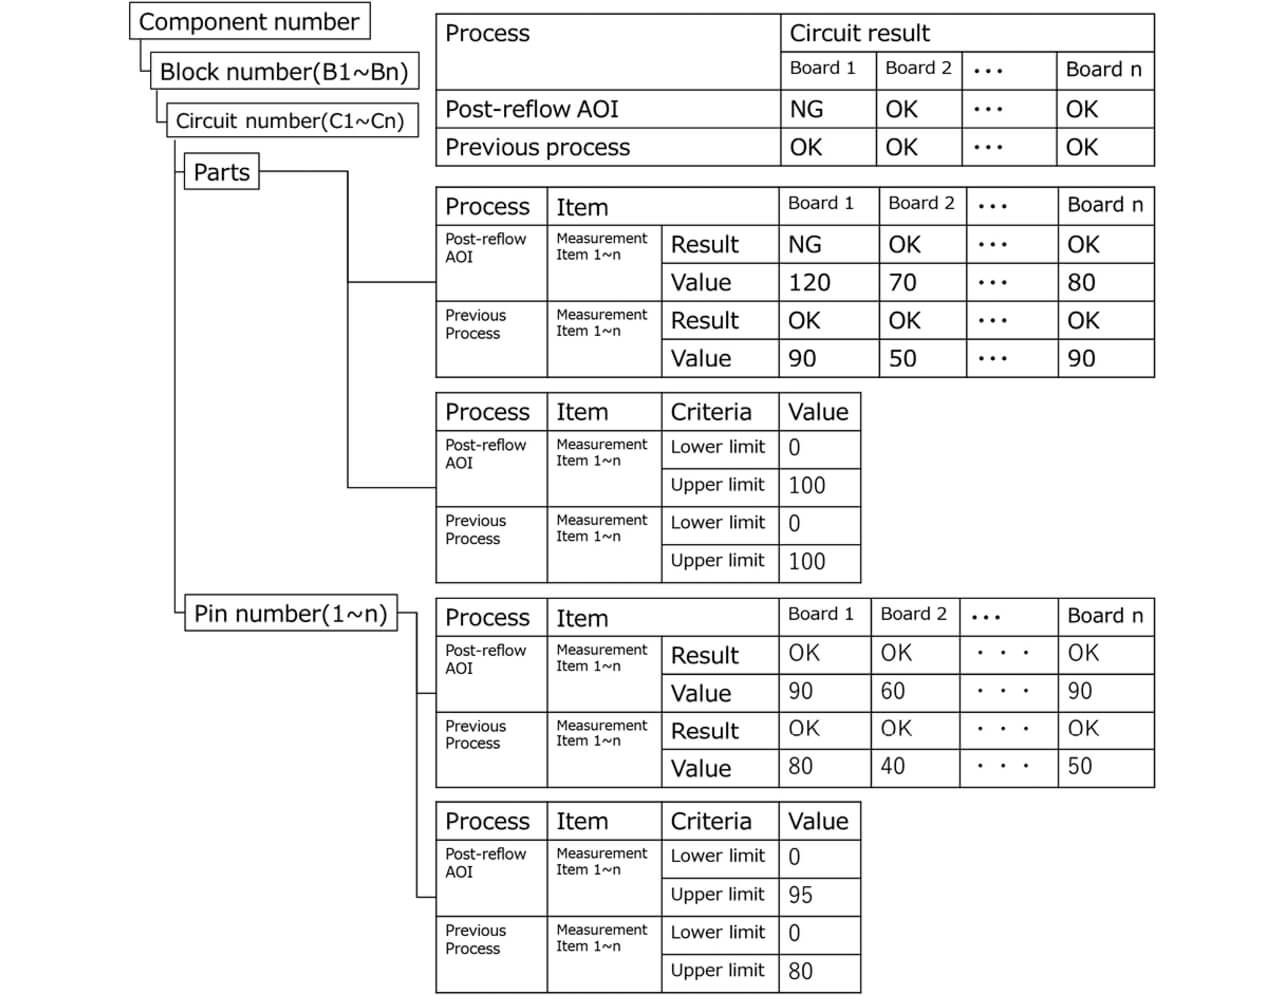
Challenge 2 relates to quality data search performance. The requirement here is efficient search and retrieval from vast amounts of stored quality data. Table 4 shows, as an example, the inspection criteria optimization function of the Q-upOpti (released in 2021). Challenge 2 must be solved to ensure the responses in Table 4. The inspection criteria optimization calculation for the preceding process in Table 4 requires approximately 10 to 200 boards (a sample size required for the calculation), the inspection results and measured values of the parts, and inspection criteria. The inspection criteria optimization calculation considers the inspection results/measured values and the current inspection criteria for multiple processes for the same boards/parts. Therefore, the input data structure shown in Fig. 4 is required, which means, for example, to extract quality data (approximately 10 MB) related to the inspection results for post-reflow parts from one line’s ten days’ worth of manufacturing and quality data (approximately 10 GB) and convert them into a linked form as the same parts data within 10 seconds.
| Item | Detail |
|---|---|
| App function | Suppose that any real defect detected in the post-reflow inspection should have been detected in either preceding process inspection (SPI or post-mounting AOI). In that case, this function will calculate the optimum values for the preceding process’s inspection criteria based on the measured value and change the inspection criteria. |
| Data collection/analysis platform function | This function returns the measured values and inspection criteria for the required numbers of non-defectives and defectives for the same post-reflow inspection criteria calculation as the app-specified part number for a real defect and the part’s measured value and inspection criteria for the preceding process for the same board. |
Challenge 3 is a problem to be solved to introduce the Q-upSystem at an appropriate cost. The number of production lines or the network configuration differs from customer to customer. Hence, the Q-upSystem is required to support various configurations.
The next section presents solutions to these challenges.
3. Design of the Data Collection/Analysis Platform
Challenge 1 in Subsection 2.2 requires a solution that prevents reduced response performance during a lock wait to avoid inconsistencies between data simultaneously written to the same table. Accordingly, for the data inputs from more than one machine in the mounting line, the data table should be divided for each machine with the locked data ranges specified on a machine-by-machine basis. Data linking should be performed using machine-specific saved data as inputs for each mounting line to secure the response performance.
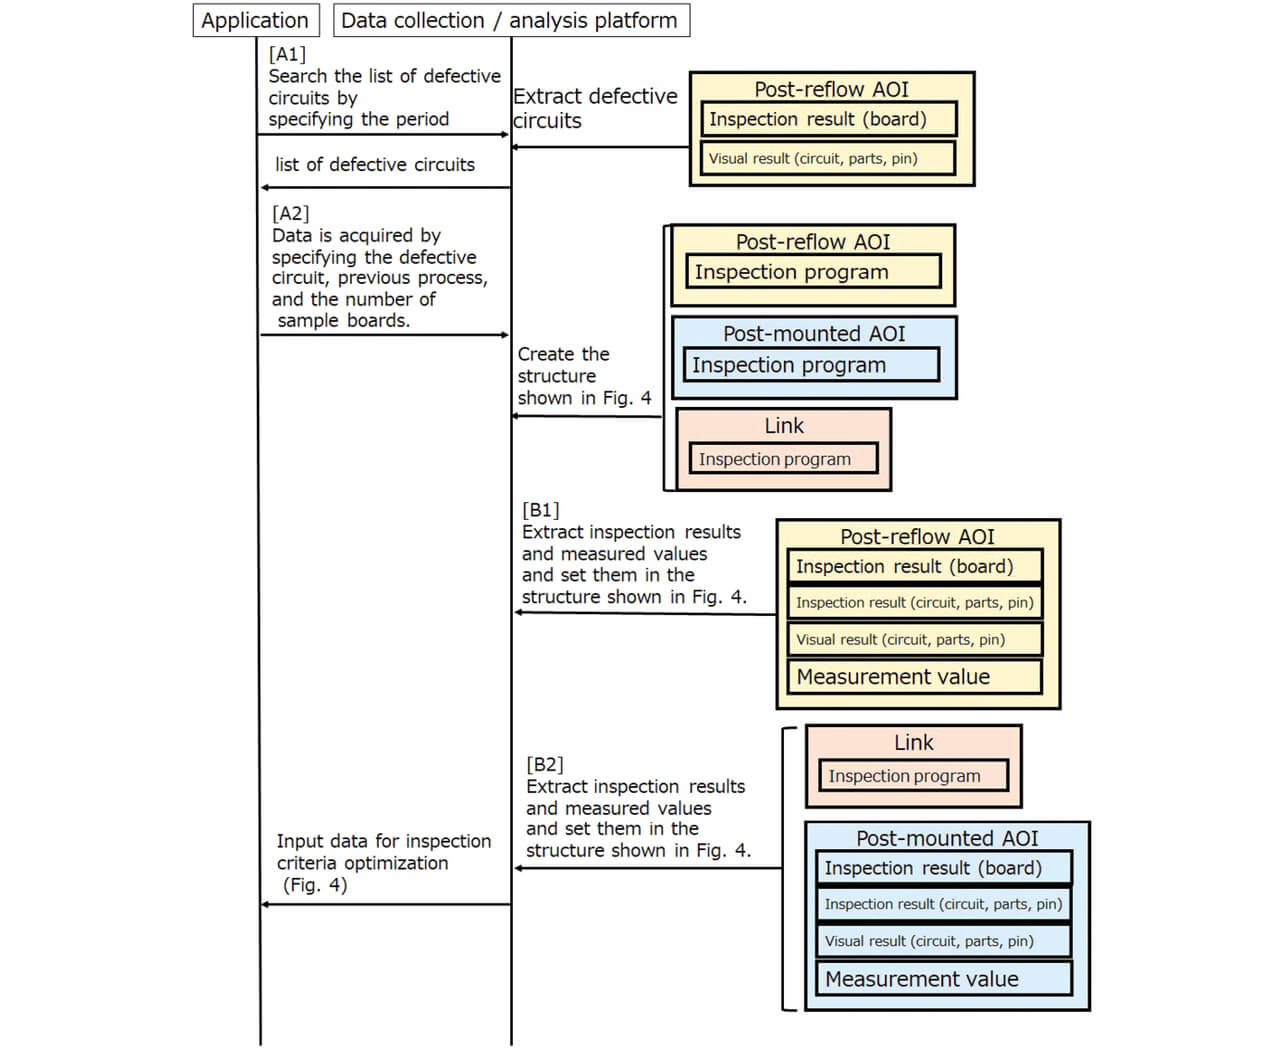
Challenge 2 in Subsection 2.2 requires a solution that localizes the accessible data range to reduce disk inputs and outputs on the server during data searches and retrieval. Therefore, we must appropriately design data-table types and period divisions to suit the data access pattern and volume. The basic pattern of quality data retrieval is to specify the period and the quality condition to run a search and retrieve relevant and detailed data based on the search results. Fig. 5 shows, as an example of the basic pattern, the input data retrieval sequence for inspection criteria optimization calculation for the inspection criteria optimization function in Table 4. Fig. 5 shows a case of the preceding process being the post-mounting AOI. The application proceeds from Step [A1], “Search the list of defective circuits by specifying the period,” to Step [A2], “Retrieve data by specifying the defective circuit, the preceding process, and the sample size of boards.” Ninety percent or more of the data volume the application obtains here is accounted for by measured values. Hence, the most time-consuming part is the extraction and setting of measured values in Steps [B1] and [B2] “Extract inspection results and measured values and set them in the structure shown in Fig. 4. Based on this basic pattern, inspection results tables will be created for inspection results (board), inspection results (circuits/parts/pins), and measured values. With the access frequency and the data volume considered, the periods applicable to single tables will be one day, one hour, and 10 minutes, respectively. Besides, the measured values will be divided for part number-specific retrieval and analysis for each part number. The above division is expected to localize the range of data accessible during search and retrieval and achieve high response performance.
As regards Challenge 3 in Subsection 2.2, data division by inspection machine and period will allow distributed data deployment and make scaling-out (allover system performance enhancement by additional computers) easier. This approach will allow incremental installation of additional inexpensive servers or selection of appropriate servers for the scale of the system at the time of phased production line replacement or expansion.
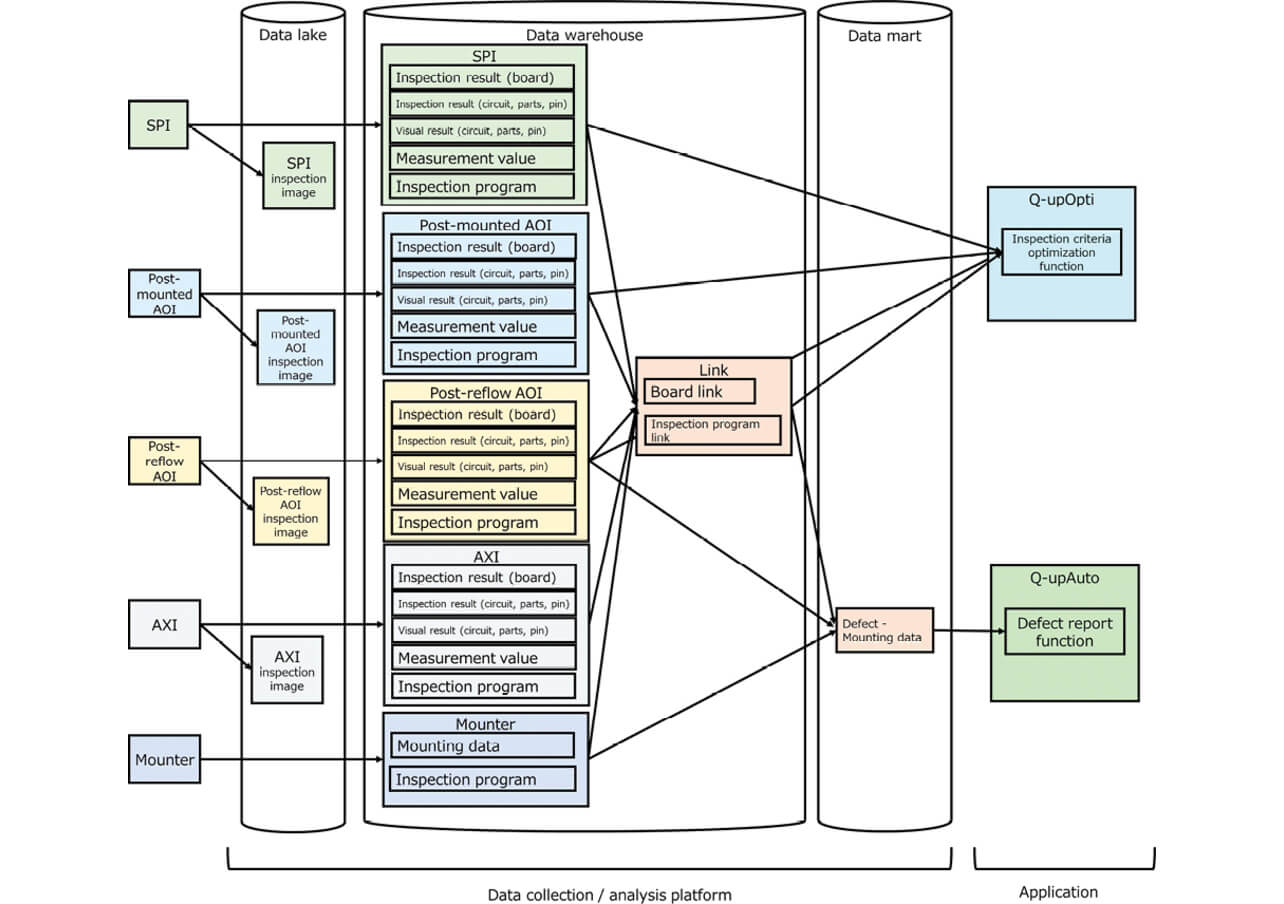
Considering the above, Fig. 6 shows the data collection/analysis platform as configured on the basis of the data layers in Table 1. The arrows in the figure indicate data flows. In the data lake, inspection images are first fetched from the inspection machine as the application needs them and only then arranged in place, thereby avoiding multiple times of retrieval from the inspection machine. In the data warehouse, quality data (inspection results and inspection programs) from the inspection machines (SPI, post-mounting AOI, post-reflow AOI, and AXI), mounting data from the production equipment (mounter), and linking data from each process are arranged in place. In the data mart, real defective mounting data, which is a list of the IDs of mounter devices that mounted real defective parts, are arranged in place for as-is use by the application through the defect alarm functions in Table 3.
4. Performance Evaluations
4.1 Performance Evaluation 1
This subsection presents the results of performing the linking speed performance evaluation for Challenge 1 (hereinafter “Performance Evaluation 1”) on a file-based system implemented by C# in an inexpensive server to verify the challenge of processing speed enhancement, which was difficult, as explained in Subsection 2.2, because of a high data volume. In Performance Evaluation 1, the inspected defectives data linking time for the data from the mounter and two inspection machines were evaluated from among our factory’s five hours’ worth of production data.
Table 5 shows the results of Performance Evaluation 1. From Table 5, the linking time per board was 13.3 ms and sufficiently shorter than the cycle time of the mounting line (approximately 10 seconds to 1 minute). The major factor behind this was the input and output localization during data linking, which was achieved through the hourly-based tables of inspection results (circuits/parts/pins).
| Case | Number of linked parts (inspected defective parts) |
Number of inspected boards |
Linking time [ms] |
|---|---|---|---|
| 1 | 116 | 148 | 1559 |
| 2 | 188 | 163 | 1873 |
| 3 | 206 | 191 | 1927 |
| 4 | 191 | 96 | 2274 |
| 5 | 72 | 41 | 839 |
| Total | 773 | 639 | 8,472 |
| Linking time per part [ms] | 11.0 | ||
| Linking time per board [ms] | 13.3 | ||
4.2 Performance Evaluations 2 and 3
This subsection presents the results of performing the data-retrieval speed performance evaluation of the inspection criteria optimization function in Table 4 (hereinafter Performance Evaluation 2). For comparison with Performance Evaluation 2, we also evaluated the measured value retrieval speed achieved by the conventional Q-upNavi (hereinafter Performance Evaluation 3). Performance Evaluation 2 required retrieval of measured values from two processes. However, the Q-upNavi does not have a function to add links to the measured values during their retrieval from multiple processes. Accordingly, for the measured-value retrieval time from the two processes, the measured-value retrieval time per process was doubled for performance comparison.
Performance Evaluations 2 and 3 used the data of boards populated with 938 parts. In Performance Evaluation 2, post-reflow AOI and post-mounting AOI data were obtained for the data conditions in Table 6 from 10, 20, 50, 100, and 200 boards to calculate the times required for conversion into the structure in Fig. 4. In Performance Evaluation 3, measured-value data were obtained for the data conditions in Table 6 from 10, 20, 50, 100, and 200 boards subject to post-reflow AOI, and the time twice each measured value was deemed a data retrieval time from two processes. The notebook PC used for Performance Evaluations 1 and 2 has the following spec: Windows 10 OS, Intel® Core i7-6600U CPU @ 2.60 GHz, 16 GB memory, and SSD storage. The server used for Performance Evaluation 3 is of product standard spec (Windows Server 2016 OS, Intel® Xeon® E5-2630 v4 CPU @ 2.40 GHz, 16 GB memory, 10,000 rpm SAS storage).
| Name | Part type | Number of pins | Number of parts on the board |
|---|---|---|---|
| Part Number A | Chip resistor | 2 | 40 |
| Part Number B | SOP | 8 | 4 |
| Part Number C | QFP | 208 | 2 |
Fig. 7 and Table 7 show the results of Performance Evaluation 2, while Fig. 8 and Table 8 show the results of Performance Evaluation 3. Table 9 compares the speeds achieved in Performance Evaluation 2 and Performance Evaluation 3. Table 9 reveals that the time per 10 boards in Performance Evaluation 2 was 19.7 or more times shorter than in Performance Evaluation 3 and that the effect of enhanced speed intensified with an increasing number of boards. Thus, more significant speed enhancement was achieved than before. The major factor behind this was the input and output localization during data retrieval, which was achieved through measured-value table division by part number and period. Our conventional system stored data other than measured values in relational database tables without dividing the data for each inspection machine and stored measured-value data in individual board-specific files. Hence, more frequent inputs and outputs occurred during measured-value retrieval from multiple boards, resulting in a slow system.
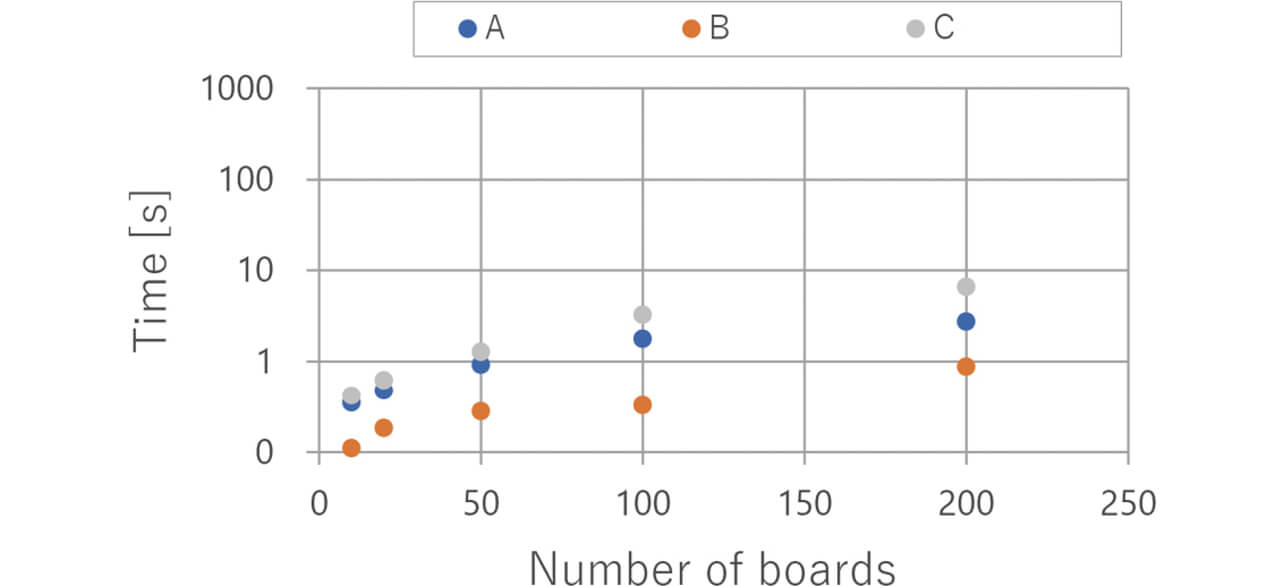
| Number of boards | Retrieval time [s] | ||
|---|---|---|---|
| Part Number A | Part Number B | Part Number C | |
| 10 | 0.35 | 0.11 | 0.42 |
| 20 | 0.48 | 0.18 | 0.63 |
| 50 | 0.92 | 0.28 | 1.28 |
| 100 | 1.79 | 0.33 | 3.26 |
| 200 | 2.75 | 0.88 | 6.59 |
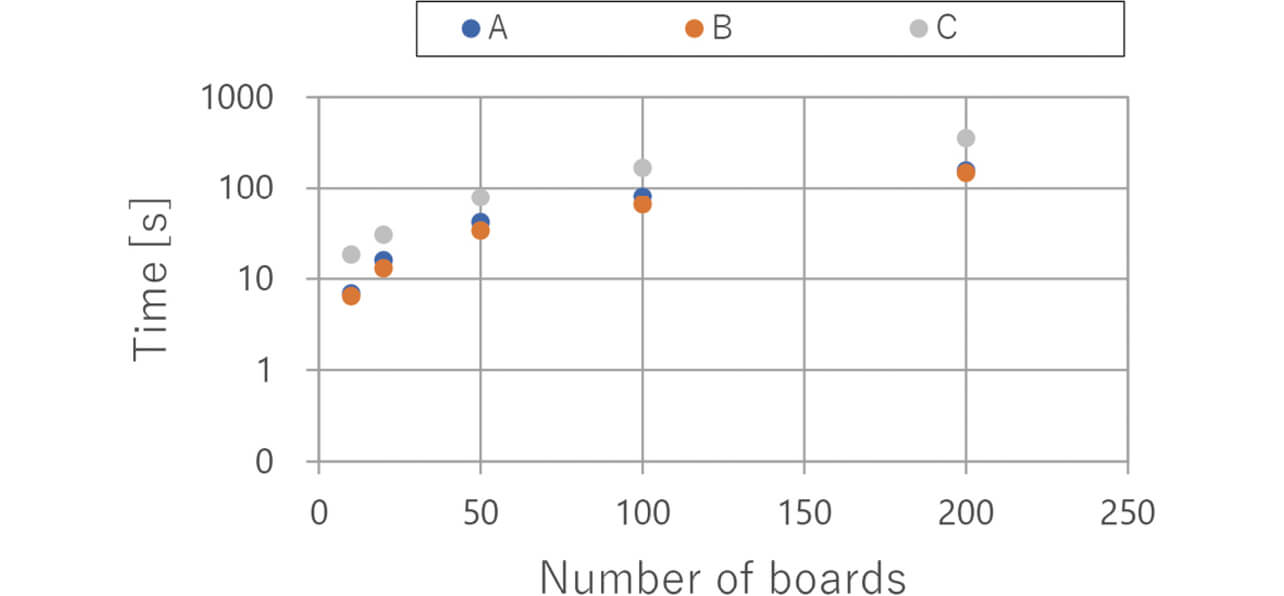
| Number of boards | Retrieval time [s] | ||
|---|---|---|---|
| Part Number A | Part Number B | Part Number C | |
| 10 | 6.94 | 6.49 | 18.5 |
| 20 | 15.93 | 13.1 | 30.3 |
| 50 | 41.72 | 33.69 | 78.89 |
| 100 | 81.12 | 65.66 | 168.97 |
| 200 | 156.96 | 148.93 | 356.79 |
| Number of boards | Retrieval time ratio (Performance Evaluation 2 time/ Performance Evaluation 3 time) |
||
|---|---|---|---|
| Part Number A | Part Number B | Part Number C | |
| 10 | 19.7 | 58.7 | 44.0 |
| 20 | 33.3 | 71.2 | 48.4 |
| 50 | 45.1 | 119.7 | 61.4 |
| 100 | 45.4 | 200.2 | 51.9 |
| 200 | 57.2 | 169.3 | 54.2 |
5. Conclusions
To take on the challenge of enabling real-time linking and rapid search and retrieval of manufacturing data and quality data without using any expensive server, we developed a data collection/analysis platform with data-table type and period divisions appropriately designed to suit the data access pattern and the data volume. We conducted performance evaluations with a view to a function to optimize the inspection criteria for the preceding process using the quality data from the final process as the starting point. As a result, we achieved sufficient speed enhancement without introducing any high-speed server. This platform serves as a basis for supporting the Q-upOpti released in 2021.
Going forward, we will do the following to accelerate the system evolution: apply methods of solving Challenge 1 in Subsection 2.2 to increase the number of lines manageable by the current Q-upAuto; provide the Q-upSystem with upgradability to a system able to achieve higher quality; add additional types of data and processing to the data collection/analysis platform supporting AOI/AXI.
Finally, we would like to express our deep gratitude to the Inspection System Division staff for their valuable cooperation in the development project presented hereinabove.
References
- 1)
- H. Mori and M. Kishimoto, “Q-upAuto, Failure prediction system with AOI-mounter collaboration,” OMRON TECHNICS, vol. 51, no. 1, pp. 105-111, 2019.
- 2)
- W. H. Inmon, Building the Data Warehouse, Hoboken, NJ, USA; Wiley,1992, 272 p.
Windows is the registered trademark of Microsoft Corporation (USA) in the United States and other countries.
Intel® Core and Intel® Xeon® are registered trademarks of Intel Corporation in the United States and other countries.
The names of products in the text may be trademarks of each company.