


Thermal Deformation Prediction Technology of Resin Parts Using Anisotropic Materials
- Thermal deformation
- Resin parts
- Anisotropic material
- CAE
- Molding material
There is a growing need for miniaturization and high capacity of electronic components along with the trend of miniaturization and energy saving of the equipment, but these requirements have increased the influence of heat on electronic components. Because resin materials, which are often used in electronic components, have a higher coefficient of thermal expansion than metal materials, it is important to accurately understand the deformation of resin materials from the heat and to clarify the effect on the characteristics in order to realize products with high robustness. In this study, we developed a method of analysis that reflects the orientation property of glass fillers in order to predict the thermal deformation of resin parts with anisotropic materials. Using a specific model, it was confirmed that the dimensional change by thermal deformation had the same tendency about the analysis results and actual measurement, and the effectiveness of the method of analysis was confirmed. As a result, it is possible to study a shape that is resistant to thermal deformation by analysis at the design stage, which is expected to lead to an improvement in design completeness and a shortening of the design period.
1. Introduction
Following the trend toward smaller and more energy-saving devices, the needs are mounting for smaller-sized and higher-capacity electronic components. Because of these needs, however, electronic components are more significantly affected than before from the thermal loads, including the increasing heat generation in the bodies. Products must show high robustness to operating temperatures or heat generation to keep up with these social needs.
In electronic components, the protective structure or insulation contains resin materials. Among the different kinds, relays, connectors, and other small electromechanical components, in particular, need to be reliably electrically insulated and strong enough to withstand the fatigue arising from such causes as a thin-walled build, retention of metal parts, or sliding or plugging/unplugging of retained parts. For this purpose, glass-filler reinforced resin or resins with several tens of a percent needle-shaped glass fiber content (hereafter “glass filler”) are in widespread use. When blended with resin for injection molding, the glass filler is oriented by the resin flow direction. The resulting material shows differences in, for example, its mechanical properties, such as strength, or thermal properties, such as expansion rate, depending on the orientation direction. Materials of this kind are called anisotropic materials.
Resin materials undergo thermal change and show more significant expansion and shrinkage than metal materials. Hence, deformed resin parts significantly affect the characteristics of electromechanical components. Accordingly, when designing an electromechanical component, it is vital to predict the dimensional changes in the resin parts due to thermal deformation and to understand the effect on performance.
So far, flow analysis has served to predict and understand the deformations of anisotropic materials, such as warpage during injection molding. We, however, have not given sufficient consideration to methods of analysis for thermal deformations of the molded parts. This time, we combined general-purpose computer-aided engineering (CAE) tools into a technical solution for accurately predicting dimensional changes experienced by thermal deformation after molding of resin material containing glass filler. This paper presents the technology thus developed.
2. Method of analysis
2.1 Principle of thermal deformation
This chapter explains the principle of thermal deformation of resin. Note, however, that this paper uses the term “thermal deformation” only to refer to the deformations of resin due to thermal expansion during heating, excluding deformations due to thermally induced chemical reactions or deterioration.
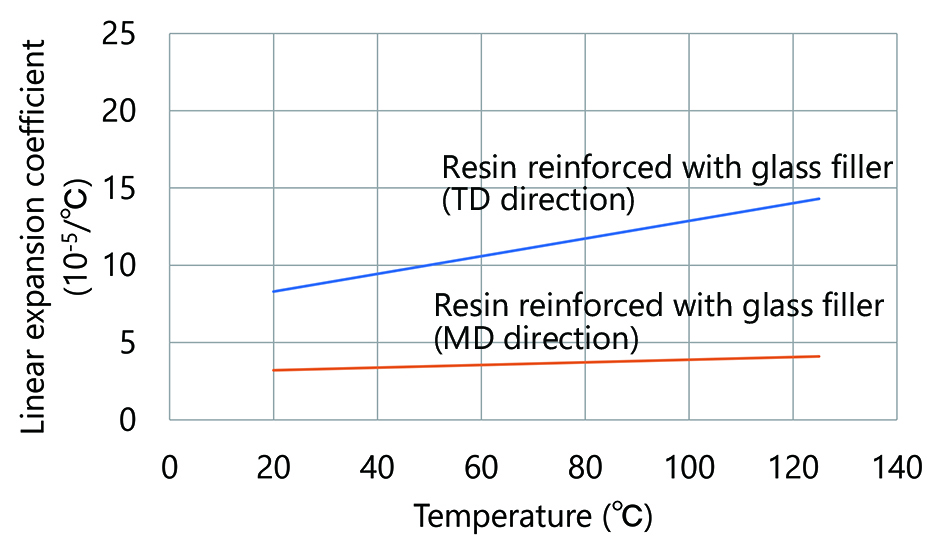
Fig. 1 shows the temperature-expansion characteristics of a glass-filler reinforced anisotropic resin material. The temperature-expansion characteristics of a glass-filler reinforced resin significantly vary depending on the orientation of the glass filler. The figure shows that as the temperature rose, the resin linearly expanded but less easily in the MD direction (along the resin flow direction) than in the TD direction (perpendicular to the resin flow direction). The cause was that under the influence of the expansion rate of the glass filler, which was easily oriented to the resin flow direction and relatively lower in expansion rate than the resin, the resin showed a low expansion rate in the lengthwise direction of the needle-shaped fiber. Where the orientation direction is intermediate, the resulting characteristics usually fall between those observed in the MD and TD directions.
Using an injection-molding machine, we molded the principle geometric model shown in Fig. 2 to examine the glass filler orientations in real resin.
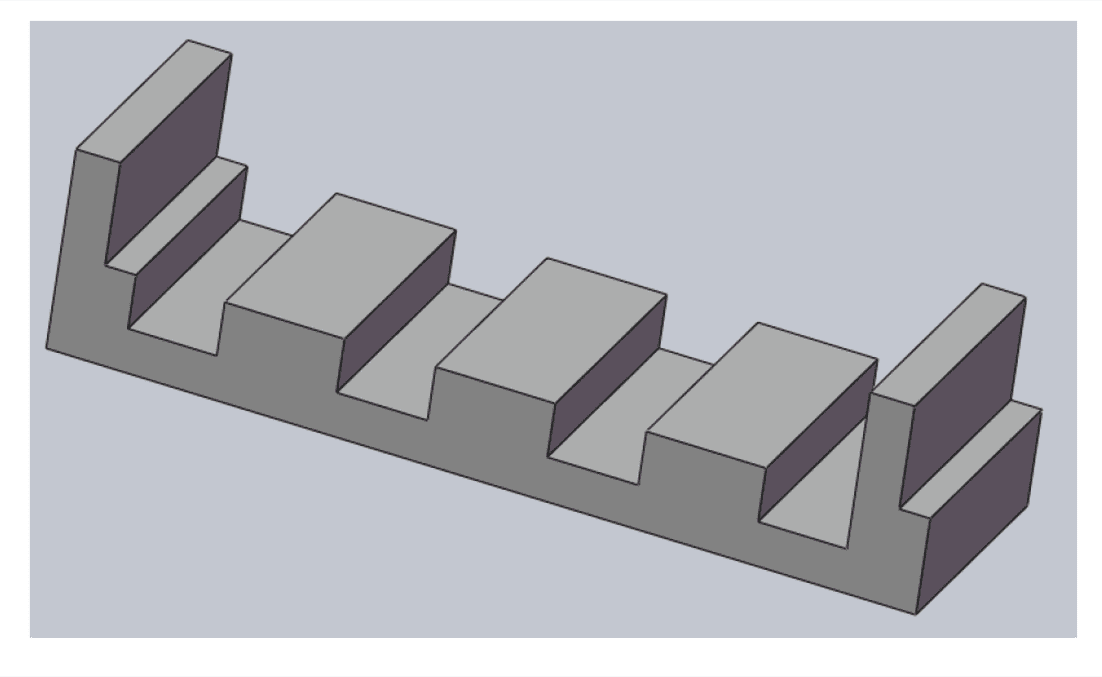
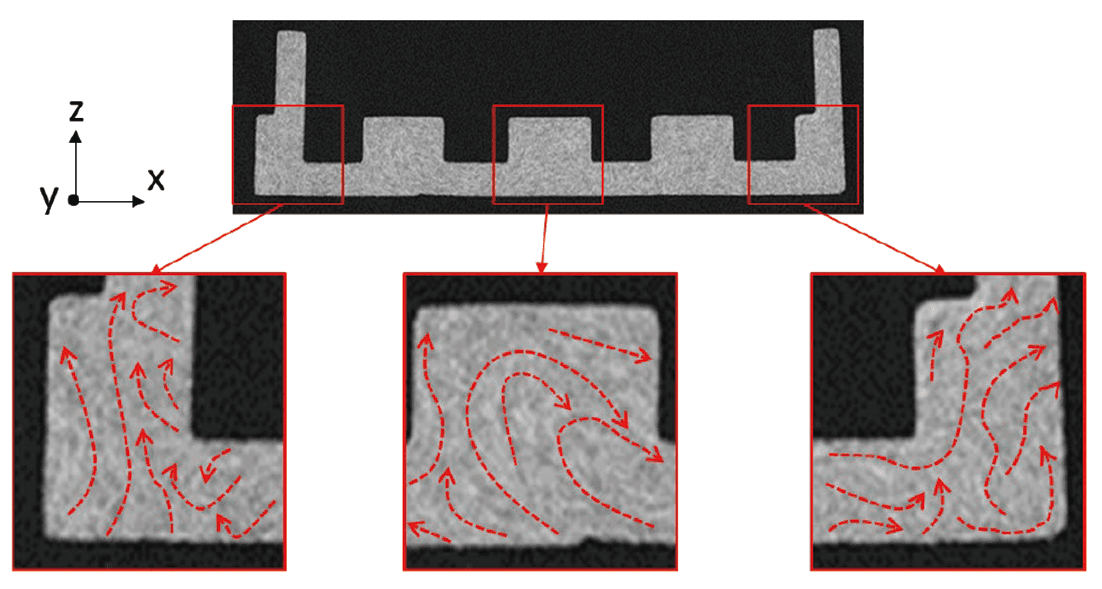
Fig. 3 shows the glass filler orientation state on the XZ plane of the molded principle model with each arrow indicating the typical orientation of the glass filler. These glass filler directions of orientation were obtained from X-ray CT-measured images. As indicated by the arrows in Fig. 3, each region differed in glass filler orientation from the others with the MD and TD directions oriented randomly. Assume that the glass filler shows regionally continuous but random orientations, as in this case. Then, at an elevated temperature, the resin would show a low expansion rate in regions with a glass filler orientation close to the resin flow direction (MD direction) but a high expansion rate in regions with a glass filler orientation close to the direction perpendicular to the resin flow direction (TD direction), resulting in inter-regional differences in the amount and direction of the deformation.
Therefore, to predict the thermal deformation of a glass-filler reinforced resin part, it is necessary to determine the orientation distributions of the glass filler.
2.2 Computational theory of thermal deformation analysis
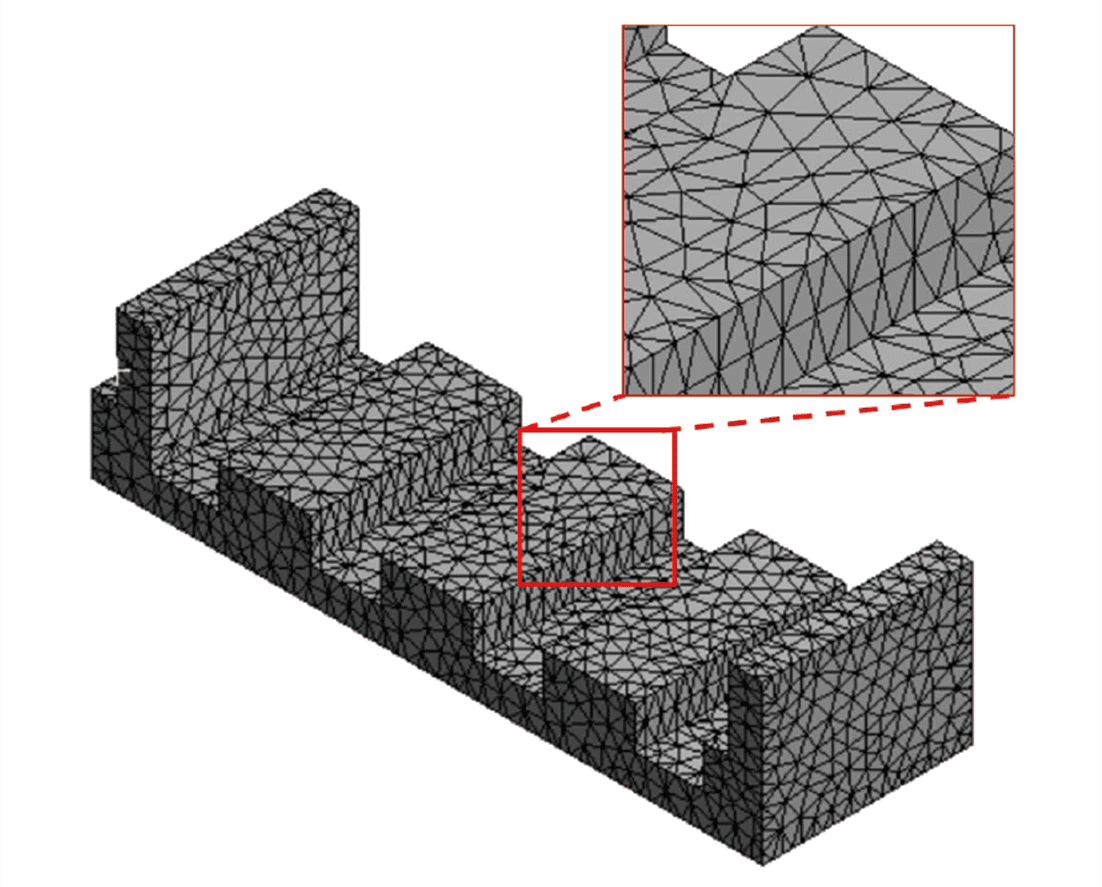
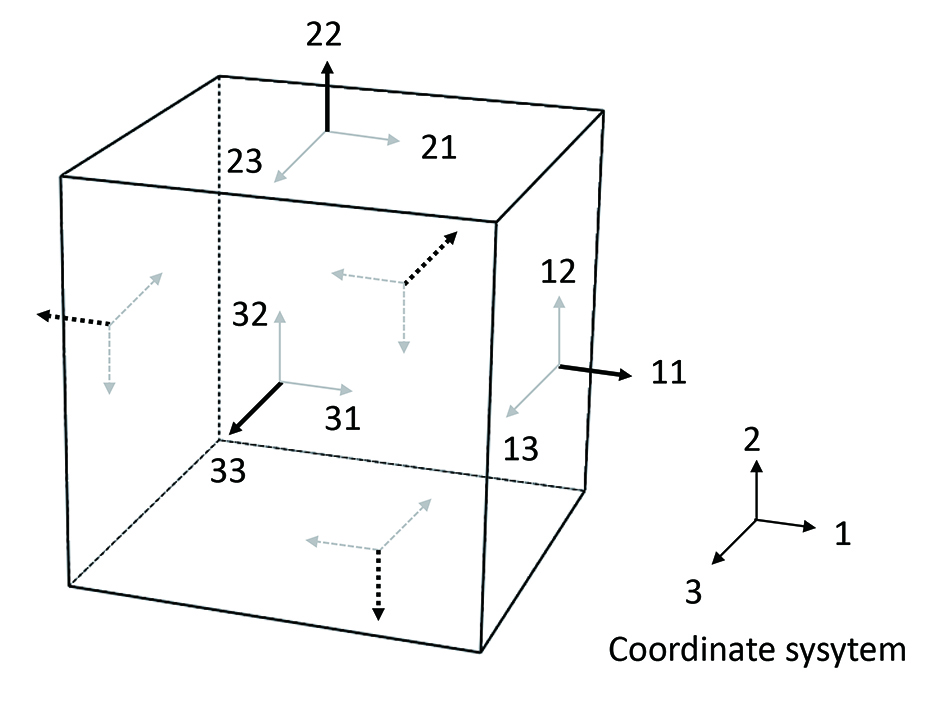
This section explains the computational theory of structural analysis used for thermal deformation analysis. In the structural analysis, the object of analysis is segmented, as shown in Fig. 4, into grid-patterned elements to each of which the material rigidity matrix expressed by Eq. (1) below is applied for the computation1).

 = strain;
  = stress
 = Youngʼs modulus (Pa);
  = Poissonʼs ratio
 = lateral elastic constant (Pa)
where  and
and  stand for the normal direction of the working face and the acting direction of the stress, respectively.
Fig. 5 shows the directions of and .
Where the glass filler orientation is uniform, individual elements are expressed similarly by the rigidity matrix assigned by Eq. (1) to each of them. Therefore, at an elevated temperature, each element has the same expansion rate as that of the others. Hence, the expansion of the whole is calculated as a simple expansion.
Meanwhile, where the glass filler orientation is not uniform, rigidity matrices of the different coefficients along the orientations of the resin part are assigned to individual elements. As a result, at an elevated temperature, each element differs in the expansion rate from the others. Hence, deformations, such as warpage, are calculated instead of simple expansion.
2.3 Analysis method reflecting glass filler orientations
For an analysis reflecting the glass filler orientations, it is necessary to prepare data on the material properties in line with the orientations and perform a thermal analysis based on the prepared data. Fig. 6 shows the analysis procedure.
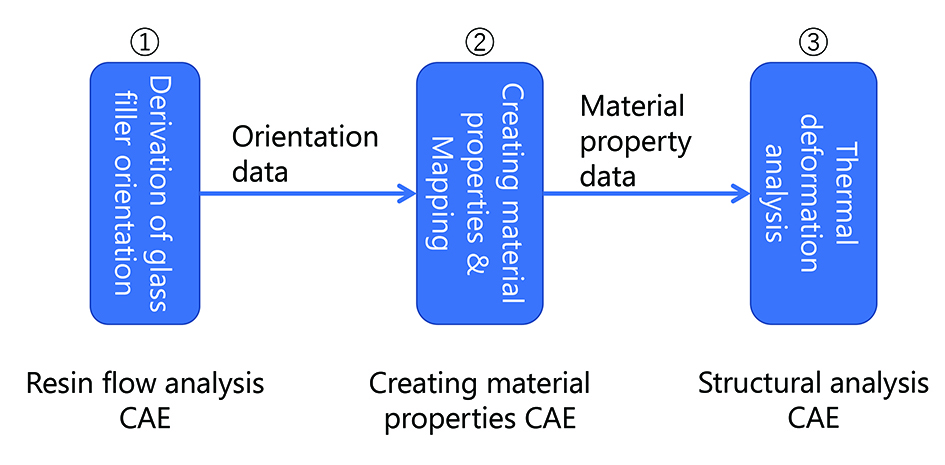
(1) Derivation of glass filler orientations
Perform the resin flow analysis2) to determine the as-molded orientation distributions of the glass filler.
(2) Preparation of material properties data
From the glass filler orientation data obtained by resin flow analysis, prepare data on the material properties in line with the orientation of each element using the CAE tools and assign the data to each element.
(3) Thermal deformation analysis
Based on the received material properties data containing element-by-element orientations, perform the thermal deformation analysis using the structural analysis CAE.
3. Verification of the method of analysis
To verify our method of analysis, we used the analysis flow shown in Fig. 6 to determine the amount of deformation before and after heating. The analysis was performed for a uniform and a non-uniform glass filler orientation. Orientations are not a consideration for uniformly oriented regions. For these regions, the analysis was performed jumping directly to Step (3) of the analysis flow in Fig. 6 and using the structural analysis CAE only.
3.1 Analysis model and conditions
Table 1 shows the analysis conditions for performing analysis reflecting glass filler orientations.
| Item | Condition |
|---|---|
| Analysis model | Principle geometric model in Fig. 2 |
| Material properties | Anisotropic materials in Fig. 1 |
| Temperature conditions | 25°C before heating 120°C after heating |
| Measuring points | 9 points indicated in Fig. 7 |
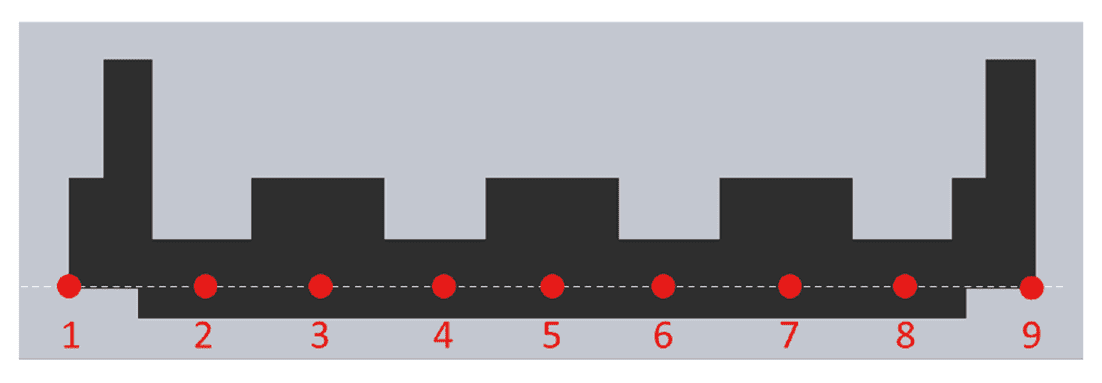
At each measuring point, the displacement after heating relative to that before heating was determined as the deformation amount.
3.2 Analysis results
1) Glass filler orientations analysis
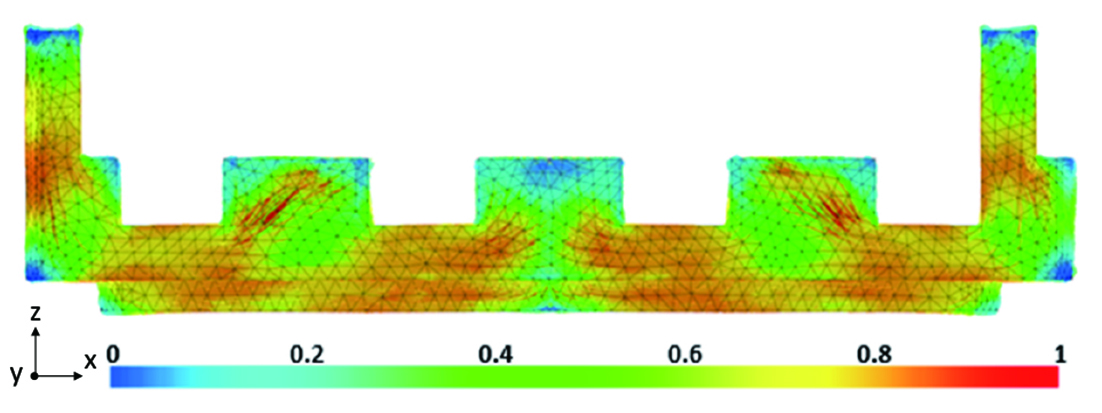
Fig. 8 shows an XZ plane cross-sectional view of the glass filler orientations obtained as a result of the resin flow analysis (Fig. 6(1)). The degree of redness is proportional to that of the orientation along the XZ cross-section (hereafter “strong orientation”), the degree of greenness indicates that of the orientational randomness, and the degree of blueness is inversely proportional to that of the orientation along the XZ cross-section (hereafter “weak orientation”). Depending on the region, the glass filler orientation was non-uniform as can be seen from Fig. 8.
2) Thermal deformation analysis
Based on the results of the glass filler orientations analysis, data on the material properties were prepared (Fig. 6(2)), so that the structural analysis CAE (Fig. 6(3)) resulted in the thermal deformation analysis with the material properties assigned to each element in line with the glass filler orientation.
Fig. 9 shows the analysis results for non-uniform glass filler orientations (a case based on the orientation data in Fig. 8), while Fig. 10 shows those for the uniform glass filler orientations. Figs. 9(a) and 10(a) show the analysis results for the change in shape before and after heating (with the degree of deformation magnified five times for easier visual comprehension), while Figs. 9(b) and 10(b) show a plot graph for the amount of deformation at each Z-direction measuring point after heating. With the non-uniform glass filler orientations, the amount of outward deformation was increasingly greater toward the upper right and left ends, while the midsection showed upward warpage. Meanwhile, with the uniform orientations, the whole simply expanded without showing any warpage.
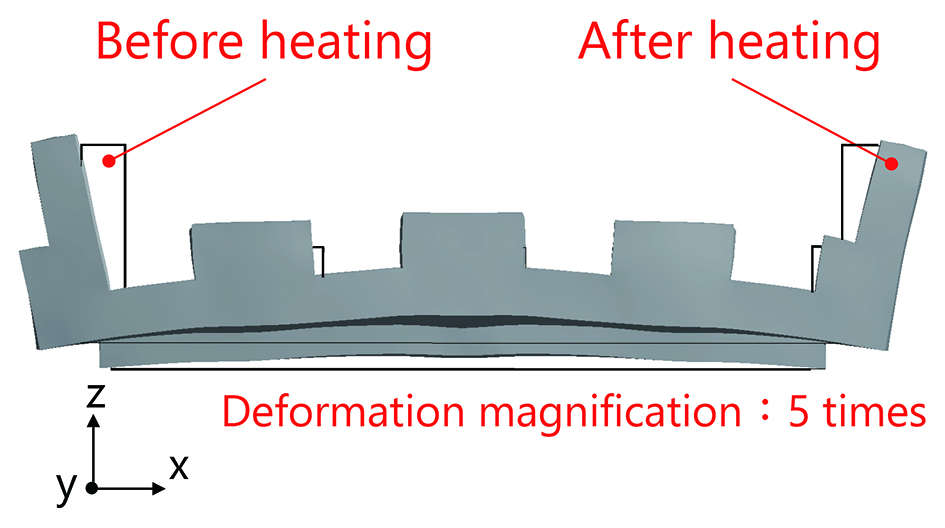
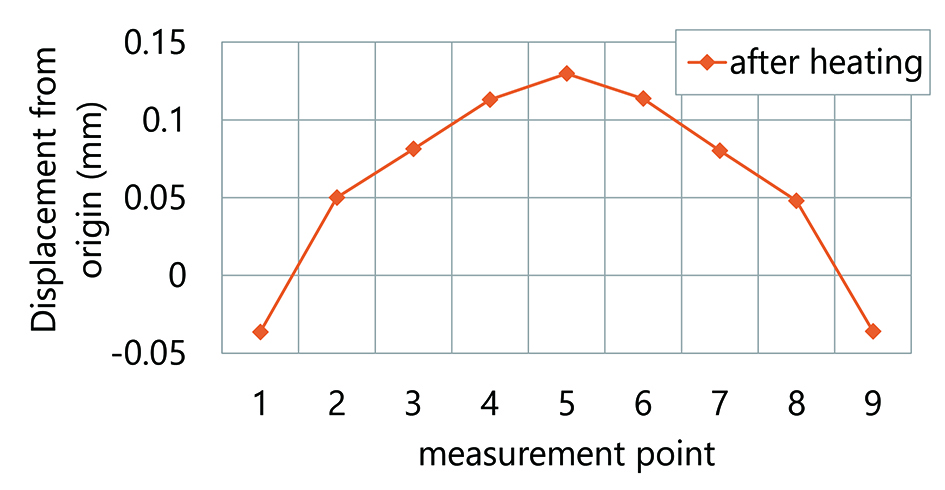
Fig. 9 Analysis results for non-uniform glass filler orientations
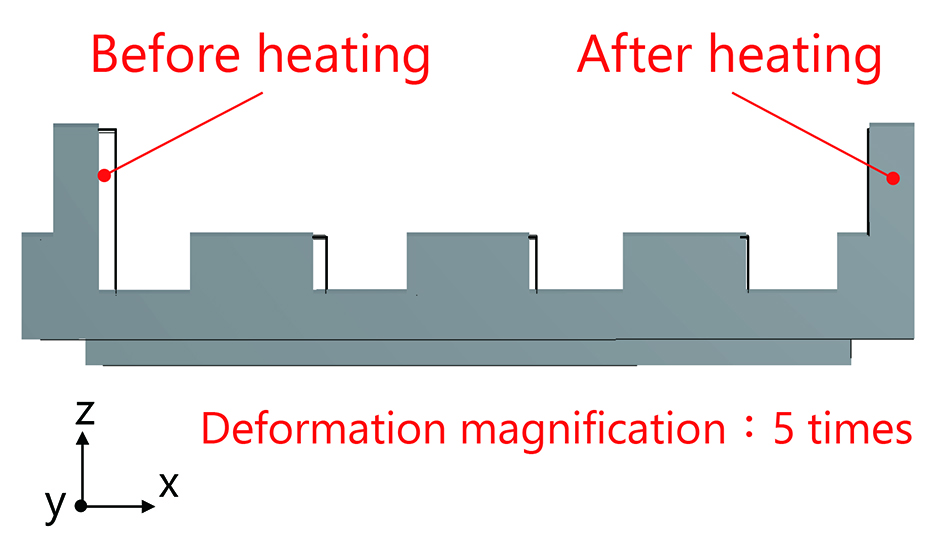
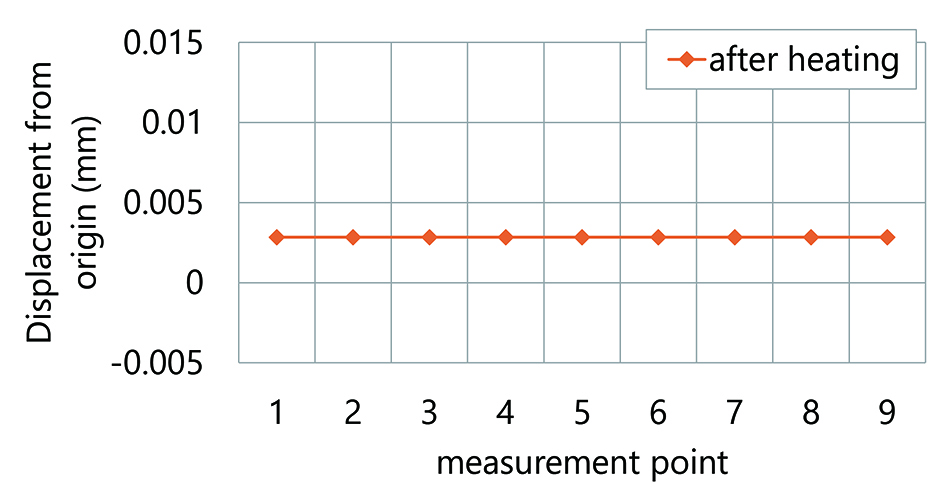
Fig. 10 Analysis results for uniform glass filler orientations
3.3 Comparison with measured results
To validate the analysis results, we measured the amount of thermal deformation in a specimen prototyped on the basis of the principle geometric model in Fig. 2. More specifically, of the measuring method, the specimen was installed in a box adjustable to a constant temperature and photographed by an optical camera to measure the amount of deformation before and after heating. Fig. 11 is a plot graph showing the analyzed and measured amounts of deformation at each measuring point after heating.
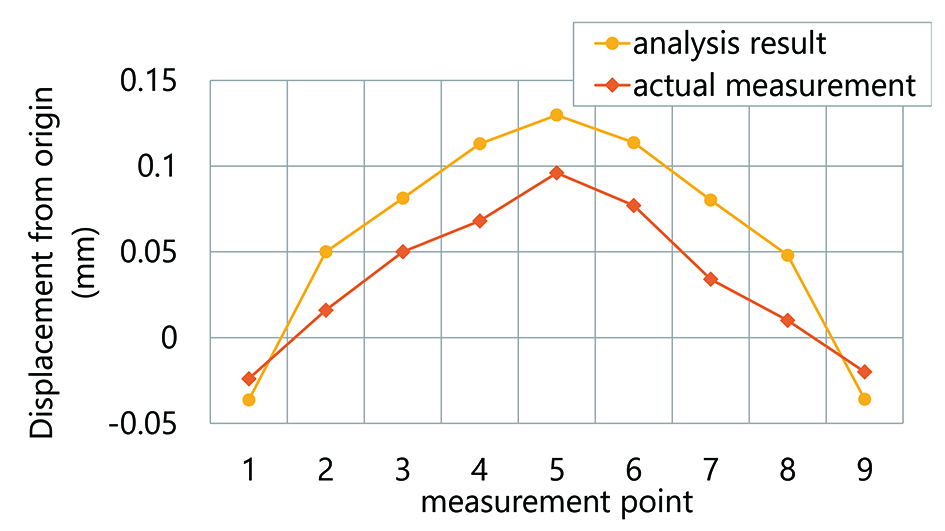
While the absolute value of the deformation amount differed between the analysis and measured results, both showed a negative-direction deformation toward either end and a plus-direction deformation toward the midsection. Thus, both results showed similar tendencies in shape deformation.
Our method of analysis determines the glass filler orientations and assigns material properties to individual elements in line with the orientations for the thermal deformation analysis. The above results validate that our method of analysis can relatively reproduce deformed states such as warpage.
4. Effectiveness verification by measurements in real relays
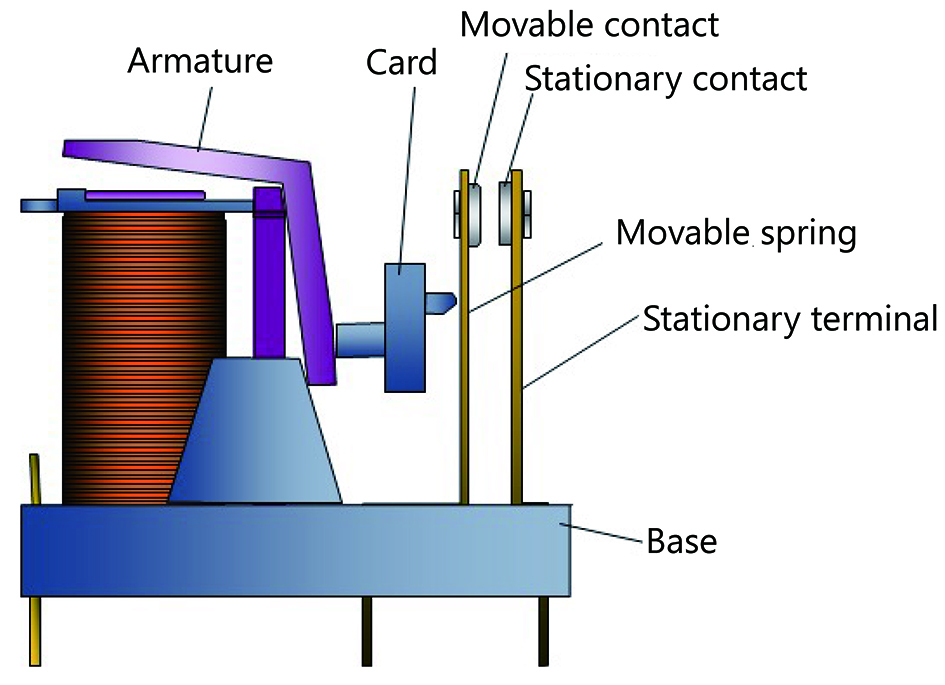
The analysis technique developed this time was deployed to relays, typical electromechanical components, to verify its effectiveness. Fig. 12 shows the typical structure of a relay3). The present study adopted a relay base part, generally made of glass-filler reinforced resin, for verification use, and performed verification of the effectiveness of our method of analysis and the predictability of deformation amounts based on glass filler orientations.
This verification compared by analysis and measurement the thermal deformation states of two relay-based models with modified glass filler orientations.
4.1 Analysis conditions
We evaluated the thermal deformations in the relay base part under the conditions shown in Table 2.
| Item | Analysis conditions |
|---|---|
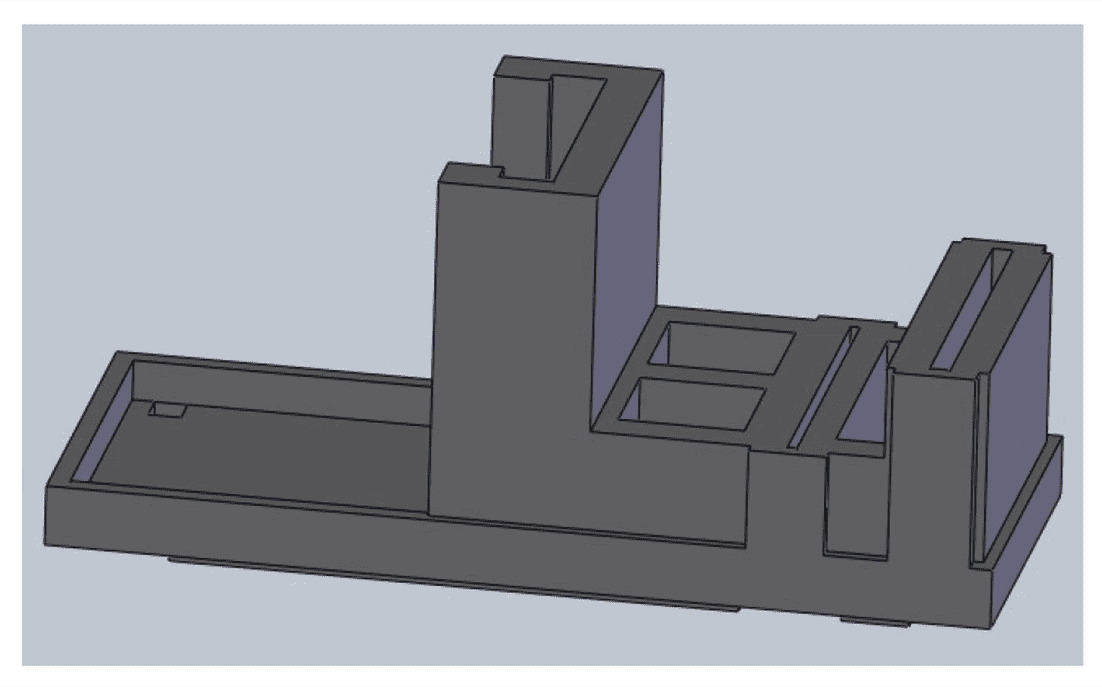
| Analysis model | Relay base model shown in Fig. 13 |
| Material properties | Anisotropic materials in Fig. 1 |
| Temperature conditions | 25°C before heating 120°C after heating |
| Measuring points | 4 points shown in Fig. 14 |
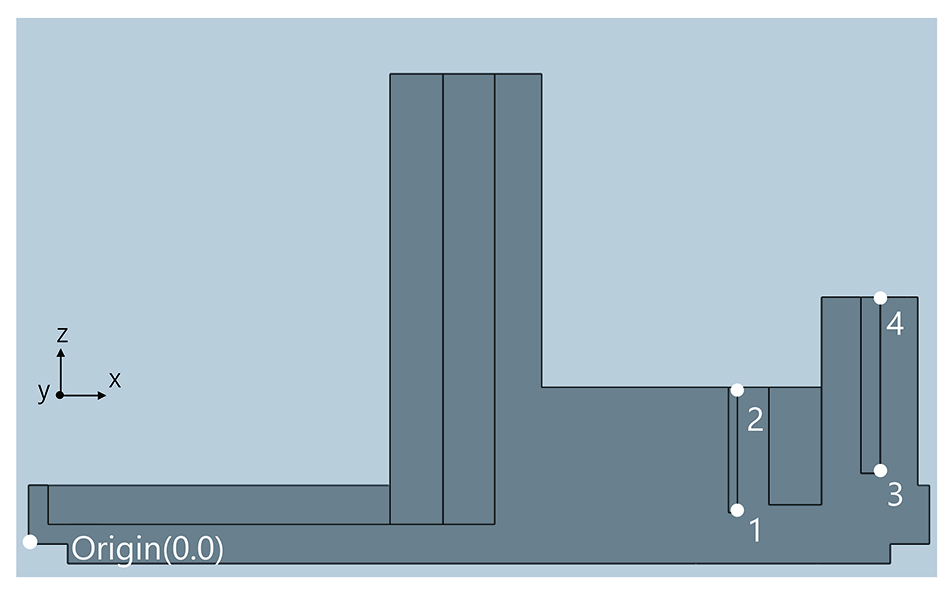
-
Measuring Points (1):
- Distances from the origin to Points 1 and 2
- (points for insertion of the movable spring)
-
Measuring Points (2):
- Distances from the origin to Points 3 and 4
- (points for insertion of the fixed terminal)
4.2 Analysis results
Fig. 15 shows the XZ cross-section glass filler orientation data obtained by resin flow analysis of the two versions of the model. Similarly as in Fig. 8, the degrees of redness, greenness, and blueness indicate the proportional degrees of strong orientation, orientational randomness, and weak orientation relative to the XZ plane, respectively. As shown in Fig. 15, Models A and B were confirmed to consist of regions that each differed in their glass filler orientations from the others.
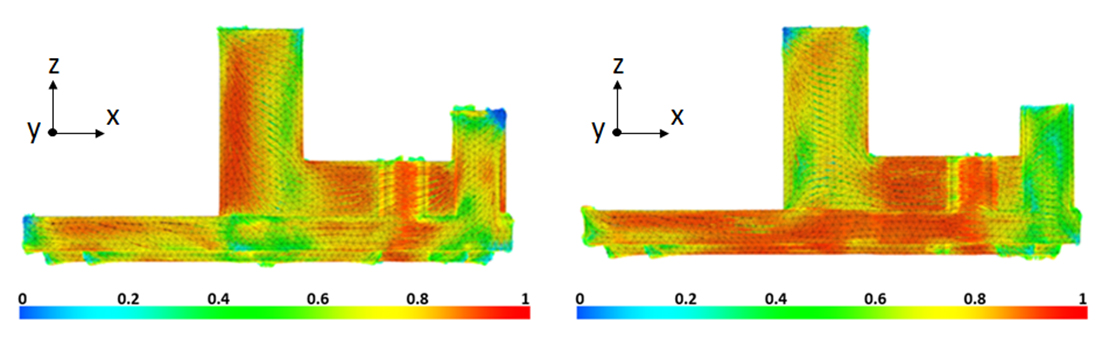
Fig. 15 Orientation data
We then performed thermal deformation analyses of these two versions of the geometric model with different orientations. Fig. 16 shows the graphs for the analysis results for the dimensional changes in Geometric Models A and B due to thermal deformation.
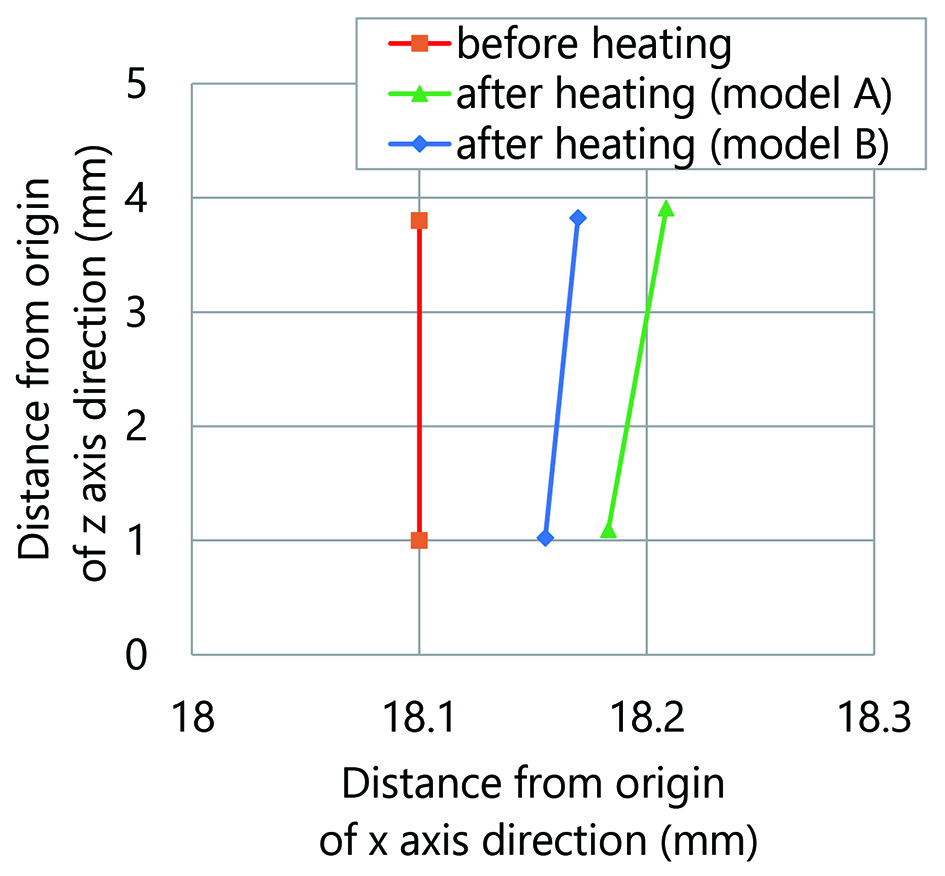
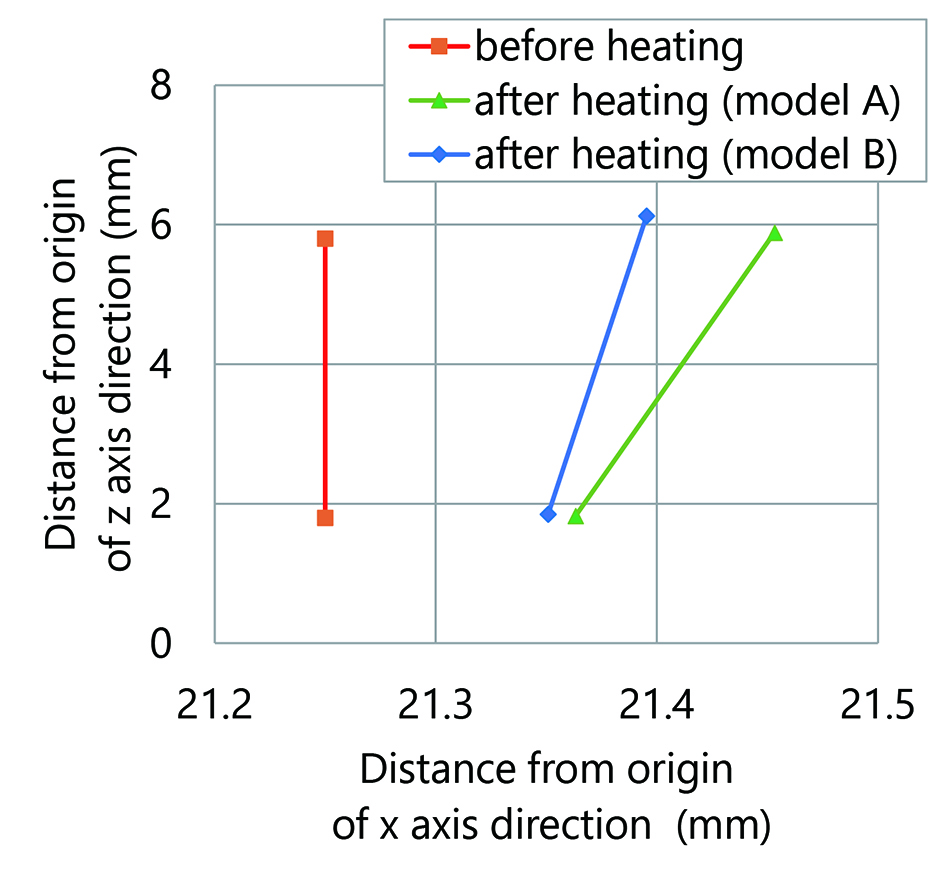
Fig. 16 Results of the analytical geometric study
A comparison of Models A and B confirms that both Measuring Points (1) and (2) showed significant dimensional changes due to thermal deformation. The amount of displacement in the x-axis direction between Measuring Point (1) was smaller in Model B. Moreover, the amount of inclination in the z-axis direction between Measuring Point (2) was also smaller in Model B.
4.3 Verification of deformation tendency by measurements in real relays
We prototyped two versions of geometric specimens based on the models with the orientations shown in Fig. 15 and measured the amounts of deformation along the lines between the same Measuring Points as in Fig. 14 to compare the measured and analysis results for deformation tendencies. Fig. 17 shows the measured results for the two versions of geometric specimens. We confirmed that in the two versions of prototype specimens, both the amount of displacement in the x-axis direction between Measuring Point (1) and the amount of inclination in the z-axis direction between Measuring Point (2) showed similar tendencies as in the analysis results.
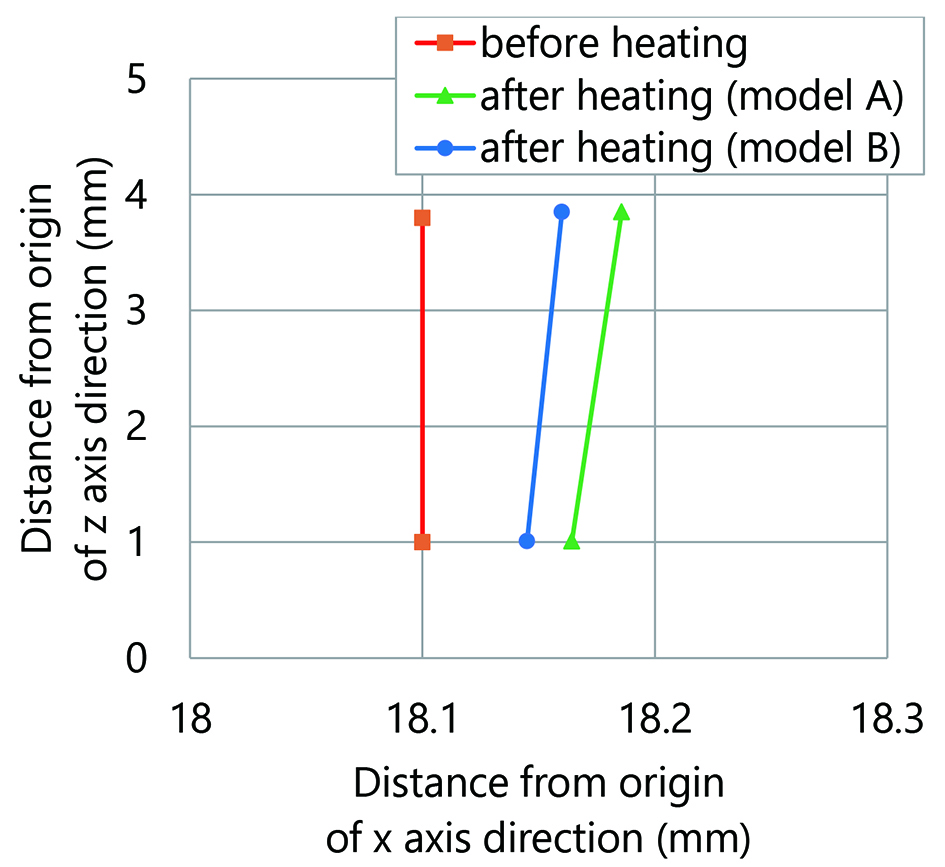
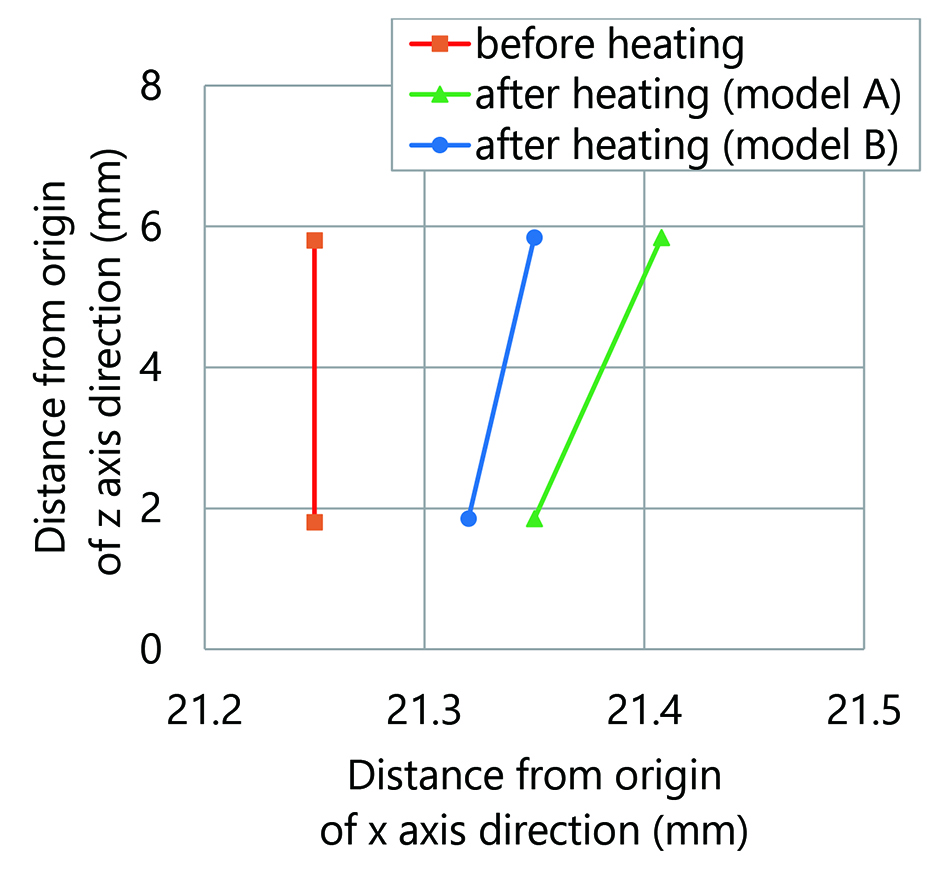
Fig. 17 Results of the measurement-based verification
These results show that our analysis method was effective for the two versions of geometric specimens (of the relay base part) and that the amounts of thermal deformation were successfully predicted by analysis reflecting glass filler orientations.
4.4 Discussions
This section examines the results that for both Measuring Points (1) and (2), the amount of displacement in the x-axis direction and that of inclination in the z-axis direction were smaller in Model B. For Measuring Point (1), the difference in the amount of displacement in the perpendicular direction was small and seemed to have resulted from a simple expansion. For Measuring Point (2), the amount of displacement in the upper region was large and seemed to reflect the magnitude of warpage. Table 3 shows a relative comparison of the orientation state data obtained from Models A and B in Fig. 15.
| Region compared | Model A | Model B |
|---|---|---|
| Bottom face | Random to strong orientation | Strong orientation |
| Measuring Point (1) | Strong orientation | Strong orientation |
| Measuring Point (2) | Weak to strong orientation | Random orientation |
For Measuring Point (1), the difference was a simple expansion rate but affected by the orientation on the bottom face and of that near Measuring Point (1). Among these factors, the orientation near Measuring Point (1) was a strong orientation in both Models A and B alike and hence is considered to have had only a minor influence. Meanwhile, the orientation on the bottom face differed between Models A and B with Model B showing a high proportion of strong orientation distributions. From these observations, we consider that in Model B, the strong orientation in the x-axis direction on the bottom face led to a low linear expansion rate and hence to the small amount of displacement in the x-axis direction.
The inclination in the z-axis direction between Measuring Point (2) was affected by the orientation near Measuring Point (2) with Model B showing a random orientation. With the random orientation, linear expansion occurred in all directions, resulting in a simple expansion and hence resistance to the occurrence of warpage. We consider that as a result, Model B became more resistant to warpage.
5. Conclusions
This time, we developed and examined a method of analysis reflecting glass filler orientations. As a result, we confirmed the effectiveness of our analysis technique for parts of complicated shapes, such as mechanical relay base parts. We expect that this achievement will help predict dimensional changes in components from thermally deformed resin parts more closely to actual operating conditions and hence will allow optimization at the design stage and lead to shorter development periods. In the future ,we intend to perform thermal deformation analyses of other molded parts to elucidate the thermal effect on each molded part and improve our thermal deformation prediction technology for relays as a whole.
References
- 1)
- G. Hashimoto, “The Eleventh FrontISTR Workshop - Elasticity Analysis by FrontISTR (Orthotropic Elastic Bodies),” (in Japanese), FrontISTR Workshop, https://www.frontistr.com/seminar/140730/orthotropic_elastic_material.pdf (accessed Jan. 6, 2020).
- 2)
- J. H. Phelps and C. L. Tucker, “A model for fiber length attrition in injection-modeled long-fiber composites,” Compos., Part A Appl. Sci. Manuf., vol. 51, pp. 11 – 21, 2013.
- 3)
- Nippon Electric Control Equipment Industries Association, “Basic Knowledge of Control Devices (Usage and Selection), Volume for Relays, General Introduction,” (in Japanese), 2018. https://www.neca.or.jp/wp-content/uploads/CU_Ry_2%20Sou_1803.pdf (accessed Jan. 6, 2020).
The names of products in the text may be trademarks of each company.