


Improvement of Defect Classification of Web Inspection System by AI Technology
- AI Technology
- Deep Learning
- Auto Web Inspection System
- Defect Classification
In recent years, labor force issues have become more serious, such as the declining labor force or the reduction in the number of skilled workers at manufacturing sites. And the factory automation necessity continues to increase as the countermeasure. In this paper, I propose a technique for defect classification using AI technology based on confirmation of the performance improvement compared with the conventional method. The conventional method in the sheet inspection system is measuring the feature values (width / length / area of defect pixels, total value, maximum value, and average value of defective pixels) from the defect image, and classifying the defect by using the range of each feature value. However high accuracy and stable classification by feature value is difficult for defects in a variety of patterns, and only visual classification by humans was effective. I expect my proposed method to reduce visual classification by humans, and I hope the method will help to solve the labor force problem.
1. Introduction
In recent years, social issues of a reduction in the labor population and the lack of skilled workers have become more serious at manufacturing sites, and the automation necessity continues to increase. Also, in the highly functional film industry and paper industry that manufactures sheet products, there are processes in which inspectors perform visual work, and the efforts to reduce the man-hours needed by work and the process itself are continued.
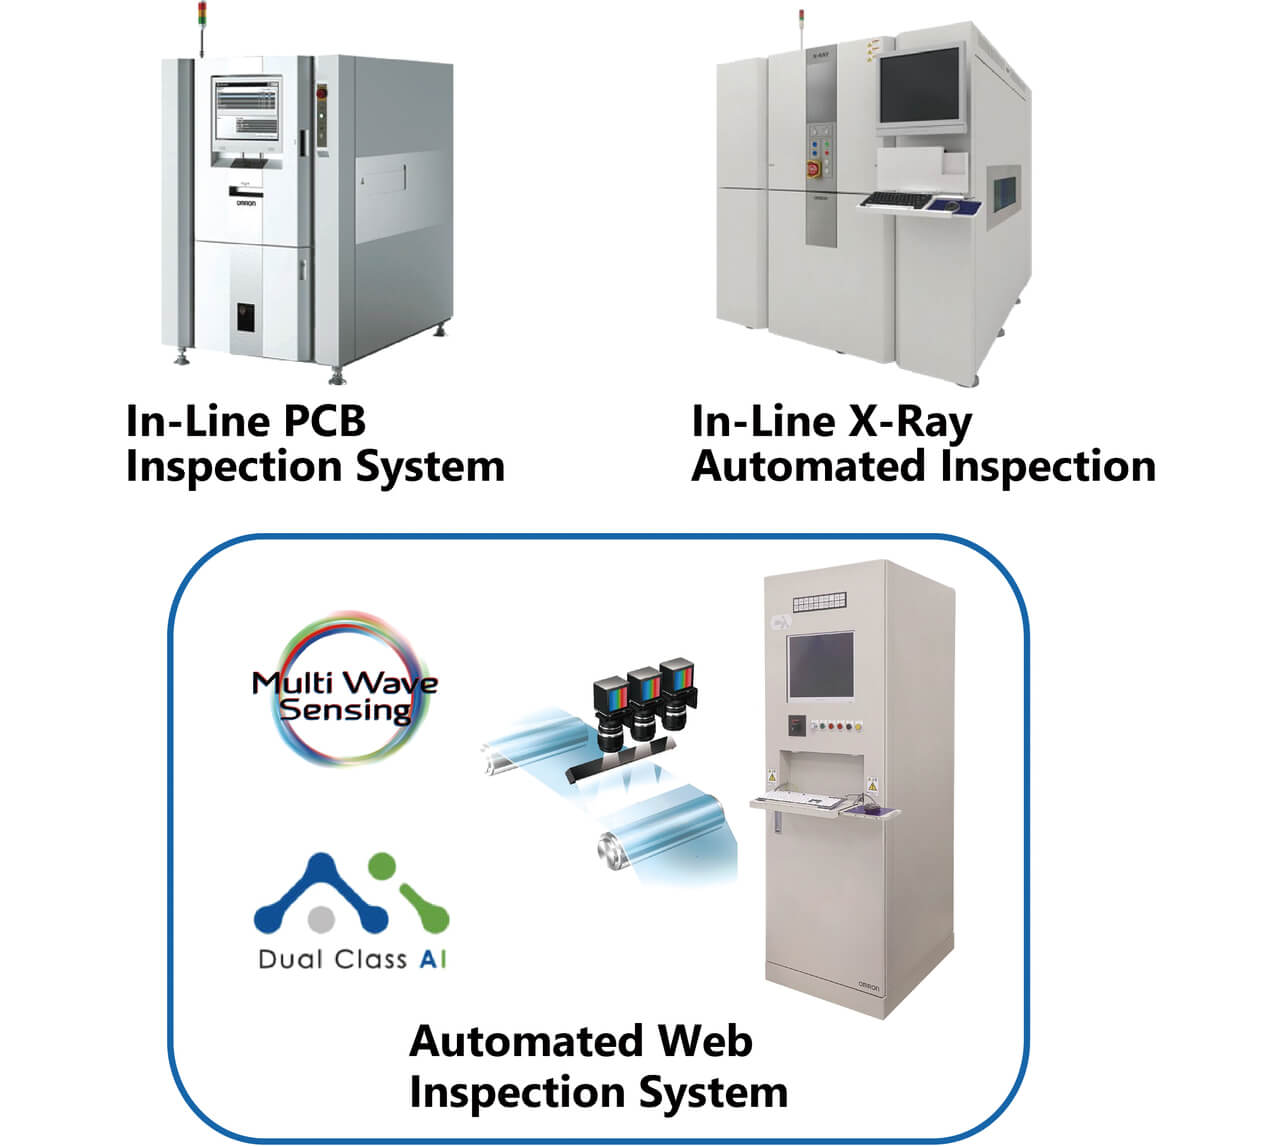
We, the Inspection System Division of OMRON Corporation, sell inspection equipment utilizing cameras, and handle the In-Line PCB Inspection System (AOI)1) for inspecting the solder joints after mounting the substrate and the parts, the high speed In-Line X-ray Automated Inspection System utilizing X-rays1), and Automated Web Inspection System to inspect the surface defects of unfigured sheets, such as the highly-functional film used for secondary batteries and display, and the cardboard at high speed and with high accuracy2). The lineup of inspection systems manufactured by OMRON Corporation is shown in Fig. 1.
This paper proposes a classification technique using AI technology (deep learning) that produces results in the field of the various image analyses for the purpose of solving the afore-mentioned social issues at the sites manufacturing sheet products.
2. Conventional technique and issues
2.1 Conventional technique
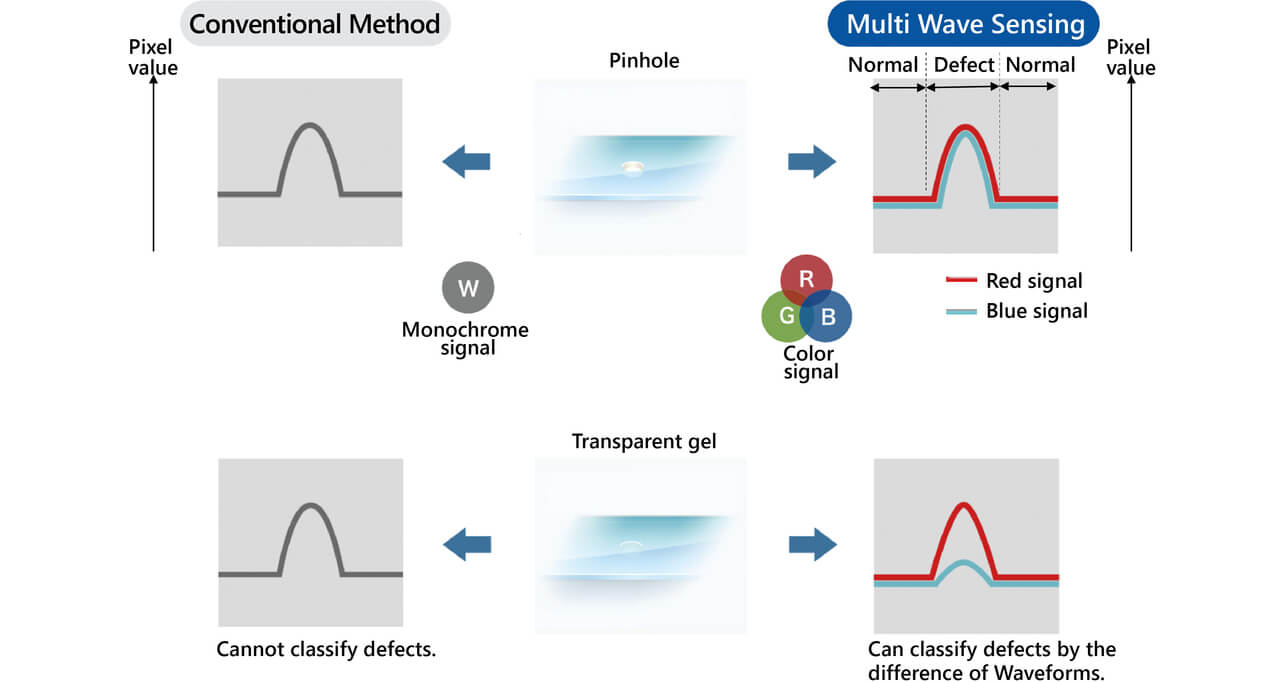
In our Automated Web Inspection System, the optimum wavelength is selected from multiple light sources, such as visible light and near infrared rays, corresponding to the defect desired to be detected and is mounted on the system. And the multi-wave sensing technology that realizes high detection capability and high discriminating performance by capturing images using a line camera and a unique algorithm effectively is our advantage. The outline of multi-wave sensing technology is shown in Fig. 2.
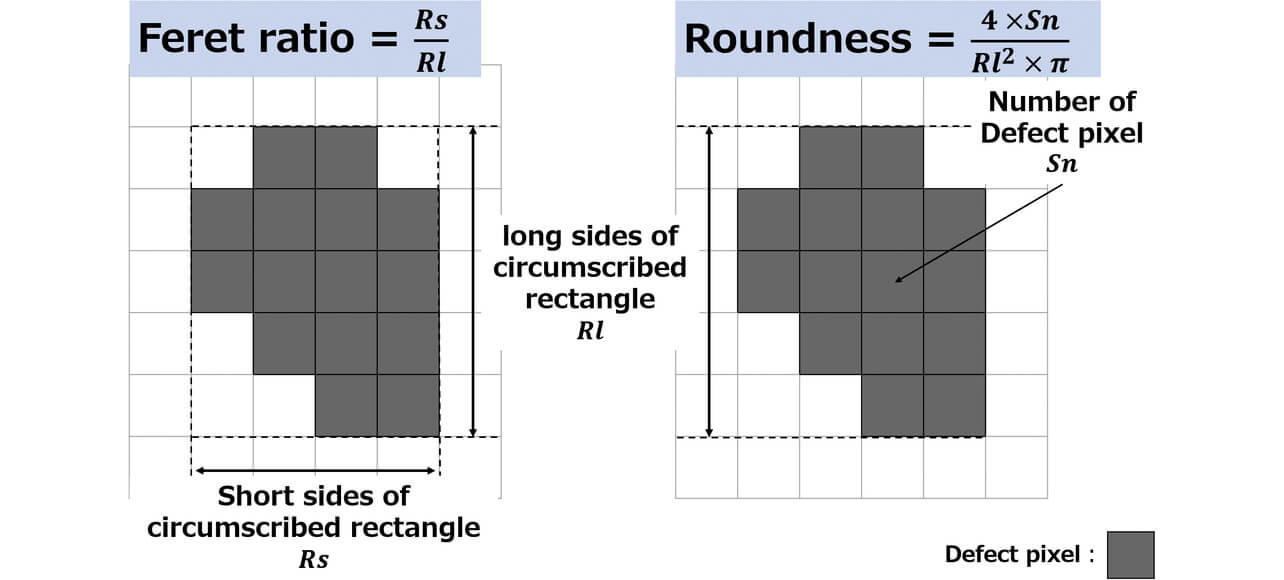
This technology detects the normal (texture) and abnormal (defect) regions of the sheet to be inspected and further performs the inspection of sheet products by calculating and classifying the feature value of the detected defect. The feature value means the digitized information that represents the feature of the defect and is extracted from an image. A representative example of the feature value utilized by our inspection system is shown in Fig. 3.
Detected defects are classified by the feature value to add up the number of generations for each defect. Since the number of generations is used for the shipping propriety decision for products and the rating of products to be shipped, the classification of defects with high accuracy is extremely important. If the classification of defects is incorrect, products where the shipping is not approved are erroneously shipped to the market, products where the shipping is approved are erroneously disposed of on the contrary, or A-class products to be shipped at high prices are shipped as B-class products at low prices, making the manufacturer suffer heavy losses.
2.2 Issues in conventional technique
The classification using the feature value as a conventional technique is logical classification logic based on digitized data, and clear evidence of classification can be taken as an advantage.
An example of a defect for which the classification based on the feature value is effective is the hole defect. The hole defect means a defect in the state where the sheet literally has a hole and is detected using a transmission light source. Since the pixel value of the hole is approximately 255 (in the case of an eight-bit camera) under a transmission light source, stable classification can be performed.
On the other hand, examples of a classification difficulty are the insect defect and water droplet defect. The insect defect means the state that an insect adheres to the surface of a sheet product. An image taken by the Automated Web Inspection System is shown in Fig. 4.
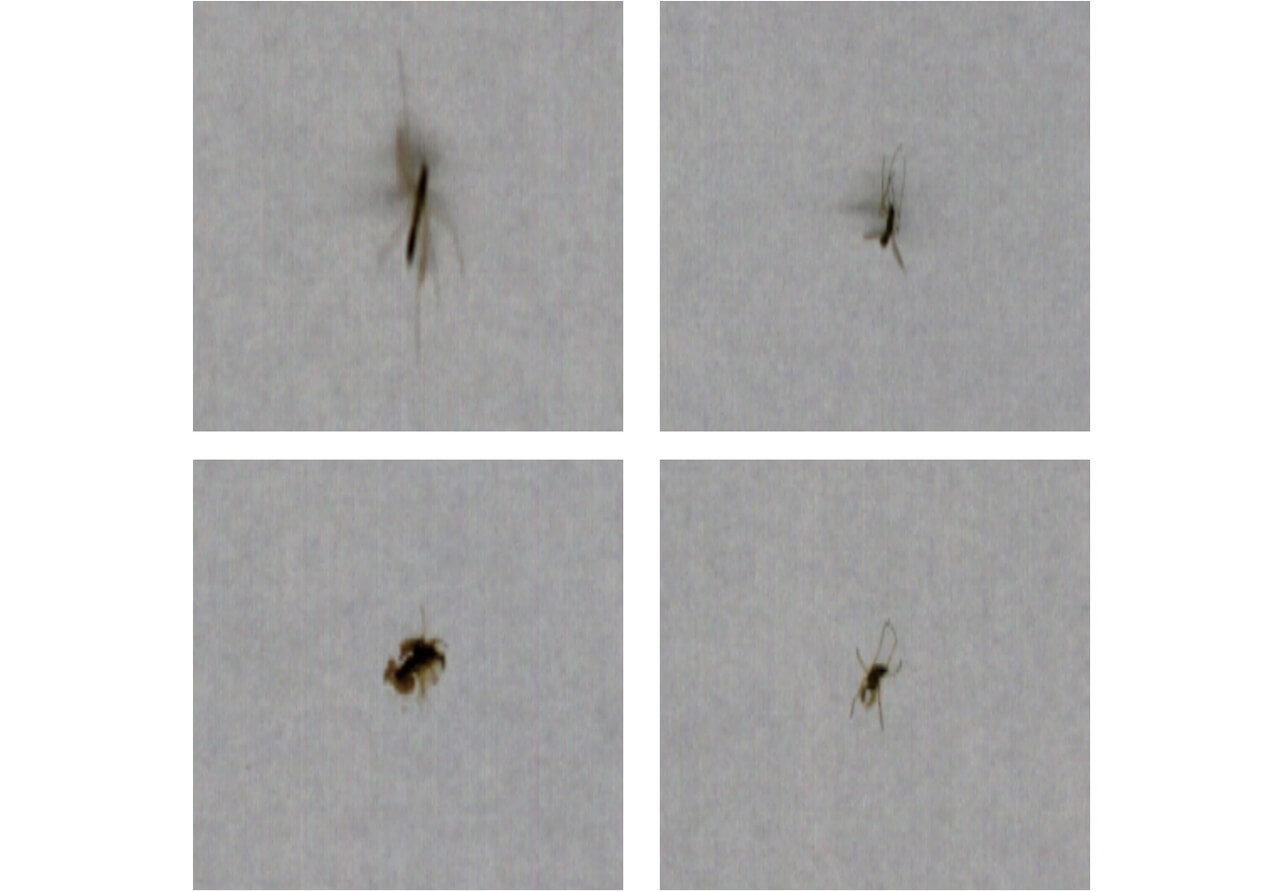
The feature of an insect defect is that the shape and size of the defect pixel varies depending on the species of insect, that the shade of the defect pixel changes depending on the collapse condition of an insect at the time of adhesion to the sheet, and that the generation pattern has diversity. Then, the water droplet defect means a defect that is generated when a droplet condensed in the drying process in the middle of sheet manufacturing drops, and it becomes a factor in poor appearance and a printing failure. An image of the water droplet defect taken by the Automated Web Inspection System is shown in Fig. 5.
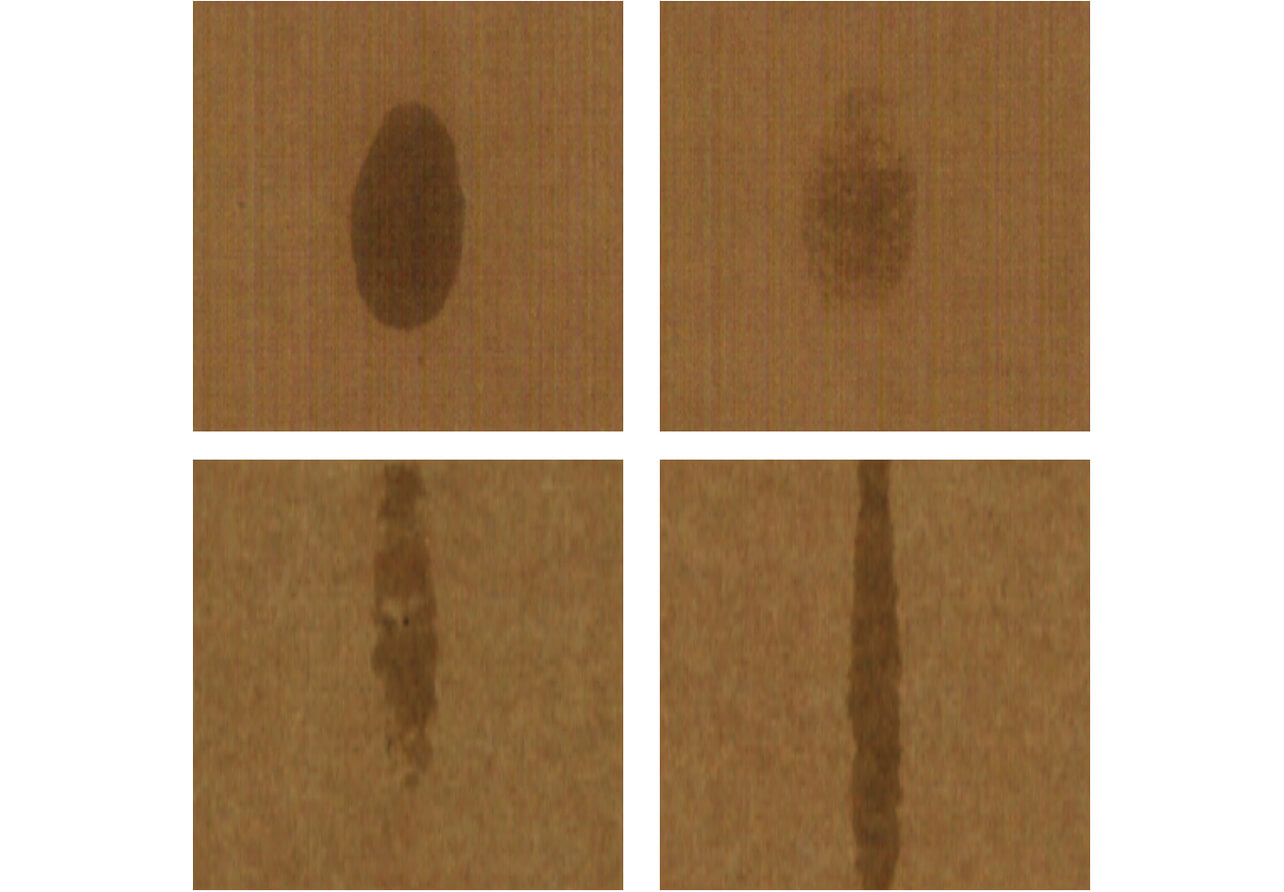
The feature is that the generation pattern has diversity the same as the insect defect such that the shape of the defective pixel changes depending on the manufacturing line speed at the time of the water droplet drop, and the shade of the defective pixel changes depending on the amount of the dropped water droplets.
The number of the feature values often increases when classifying the defects with various generation patterns, and the classification logic (logical formula) tends to be complicated. In addition, even if the classification logic is set spending much time, the set complicated classification logic must be carefully modified when the new generation pattern is found.
Also, in the manufacturing site of our customer, there were many cases wherein the classification of defects where the generation patters had diversity was performed visually by inspectors but not by the inspection system. In addition, at the site where there was no time to spare for performing visual inspection during manufacturing, a visual inspection was implemented the next day of manufacturing completion, and there was a case that shipping approval or the rating of products was changed later depending on the results of the visual inspection. There was also a case that, if the shipping approval or the rating of products was changed later, the work of a total four to five hours per day would be generated by moving the storage place for products and modifying the number of products registered in the inventory system.
3. Solution to be proposed
Classification by CNN (convolutional neural network) is applied to the defect that is difficult to classify based on the feature value described in the previous chapter. Studies of CNN prospered when the model called AlexNet won the Ima geNet Large Scale Visual Recognition Challenge (ILSVRC) in 2012 by an overwhelmingly large margin against the second best, and CNN came to be paid attention to as the solution for image classification3). In addition, since there was a case that CNN was a technology suitable for the detection of defects on the manufacturing line where the appearance inspection was performed4), we considered that a solution by CNN is also expected in the defect classification.
The processing flow of the inspection system proposed by this paper is shown in Fig. 6. Since CNN is both teacher and student, the preparation of the teacher image becomes a burden for the manufacturing site. Therefore, the minimization of the burden was an essential condition for the introduction to the site. We decided that we must first perform classification by feature value and then narrow down the target defects for classification by CNN as a measure. Specifically, we assumed the images of defects that can be stably classified by the feature value and those of the minimum defects where the width/length/area of the defective pixel not handled as a defect on the manufacturing line are less than the certain values as outside the CNN scope. Thus, we built a hypothesis that even teacher images as small as several thousand can achieve high classification performance required by the customer.
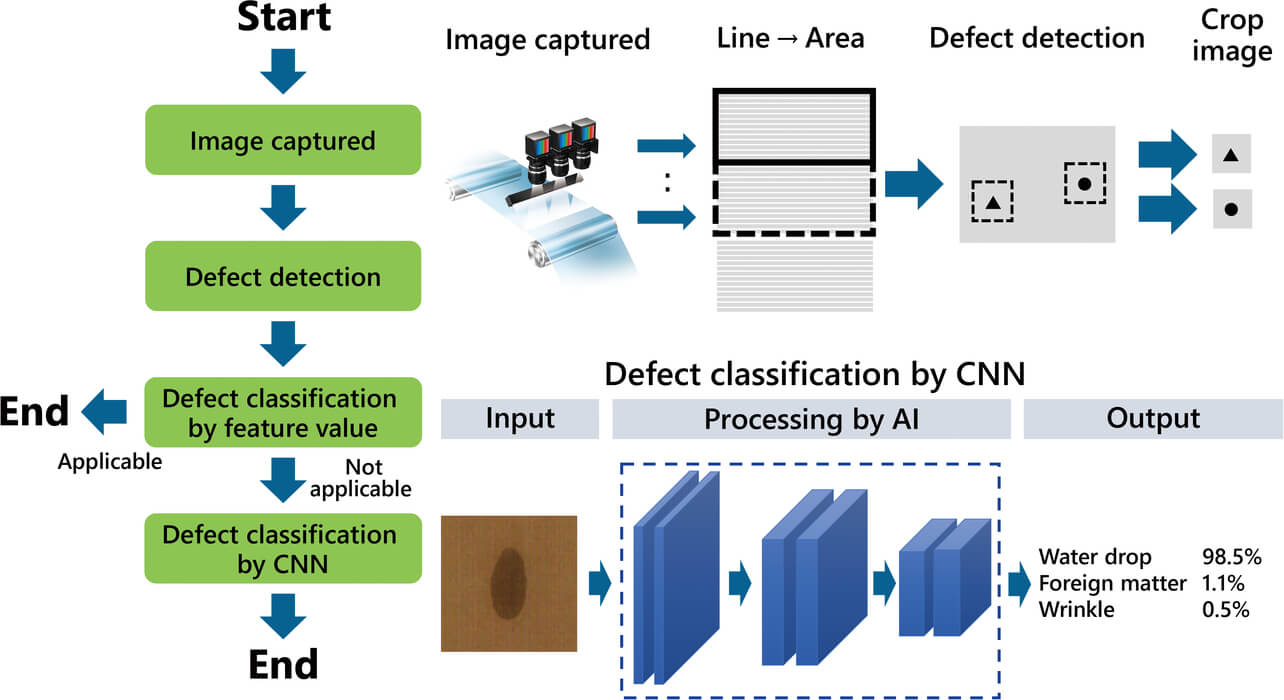
In addition, since narrowing down the target defects by CNN also has an effect capable of minimizing the black box constitution of the defect classification criteria, we considered that the processing flow shown in Fig. 6 as one of the optimum solutions to overcoming the variety of different barriers to the introduction to the site.
4. Verification of performance
4.1 Verification method
In order to clarify the performance of proposed technique, we extracted the image data of an insect defect and a water droplet defect where the feature value classification was difficult from the site of the customer for verification. In order to verify the classification performance, we prepared each of the defect images to be verified and defect images other than those. The number of extracted teacher images and those of evaluation images that have been used for performance verifications are shown in Table 1.
| Verification target | Number of teacher images | Number of evaluation images | |
|---|---|---|---|
| Insect | Insect | 282 | 32 |
| Other than insect | 2111 | 7357 | |
| Water droplet | Water droplet | 1357 | 118 |
| Other than water droplet | 6306 | 2100 | |
Furthermore in this verification, images were cut out at a size of 256 pix × 256 pix mainly from detected defect candidates and the learning of CNN was performed using the model called ResNet. In addition, since sheet products and the manufacturing factory where insect defects are generated and those where water droplet defects are generated are different, the learning of CNN was performed for each of the insect defects and water droplet defects to prepare the two types of CNN.
4.2 Verification results
The results of the verification performed for evaluation images are shown in Table 2. We explain the calculation formula for the undetected rate and the over-detected rate in the table taking the insect defect as an example. The undetected rate is the percentage of evaluation images that were erroneously classified as other than insect defects to evaluation images for insect defects. It was calculated by taking 32 evaluation images for insect defects as the denominator and the number of images that were erroneously classified as other than insect defects as the numerator. The over-detected rate is the percentage of evaluation images that were erroneously classified as insect defects to images for other than insect defects. It was calculated by taking 7357 evaluation images for other than insect defects as the denominator and the number of images that were erroneously classified as insect defects as the numerator. In addition, the values until the second place after the decimal point by rounding off at the third place after the decimal point are shown in the table.
| Verification target | Undetected rate | Over-detected rate |
|---|---|---|
| Insect | 0.00 (0/32) | 0.10 (7/7357) |
| Water droplet | 0.00 (0/118) | 0.24 (5/2100) |
Although the undetected rate and the over-detected rate obtained by the conventional technique to be compared as the performance slightly varied for each customer, the undetected rate and the over-detected rate were set at 0% and 1%, respectively, by anticipating the case that inspectors visually classify defects that are difficult to classify based on the feature value. In order to prevent the defects from flowing out into the market, it is generally allowed to accept a certain percentage of over-detected defects by instructing inspectors to judge as a defect if the possibility of a defect exists. From the verification results in Table 2, we verified that the undetected rate and the over-detected rate obtained using the proposed technique were at the same level as those obtained using the conventional technique in the prepared evaluation images. In addition, we performed validation of the AI processing that is the black box by producing heat map images5) from the intermediate layer. Heat map images produced from water droplet defects are shown in Fig. 7.
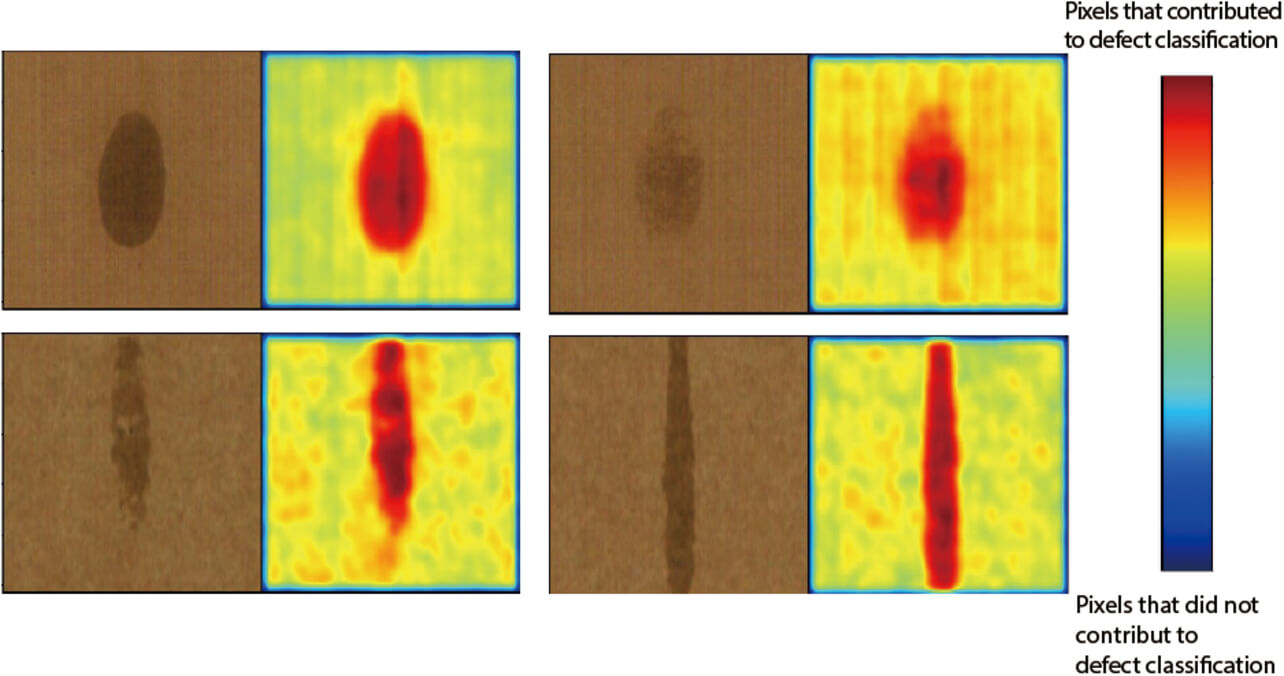
When verifying the multiple patterns with different shapes and shades of water droplets, it was found that the defective pixels significantly contributed to the classification results. In addition, in the texture part, although slight variations were recognized depending on the sheet condition, it was simultaneously found that the pixel did not contribute so much in comparison to the defective pixel. We performed similar verifications by producing heat map images from 118 water droplet evaluation images and obtained similar results from all images, which allowed us to expect stable classification.
If stable classification can be performed for defects with diverse generation patterns, any change in the shipping approvals and ratings of products in the visual inspection after manufacturing is eliminated. Therefore, it is expected that work for the four to five hours per day generated in the conventional technique can be eliminated.
5. Conclusions
This paper proposed a classification technique using AI technology for defects that were difficult to classify using the conventional technique of employing the feature value and successfully recognized that the performance of the classification of insect defects and water droplet defects is at a similar level to that of a visual inspection.
It is expected that the improvement in the defect classification performance of the sheet inspection system will eliminate the social issues of a reduction in the working population and the lack of skilled workers at the manufacturing site and will secure the quality of shipping products. In addition, since the inspection system is positioned at the final process of manufacturing, the spreading effect that the exact information of defect generation can be utilized for improvements, and preventive maintenance can be expected.
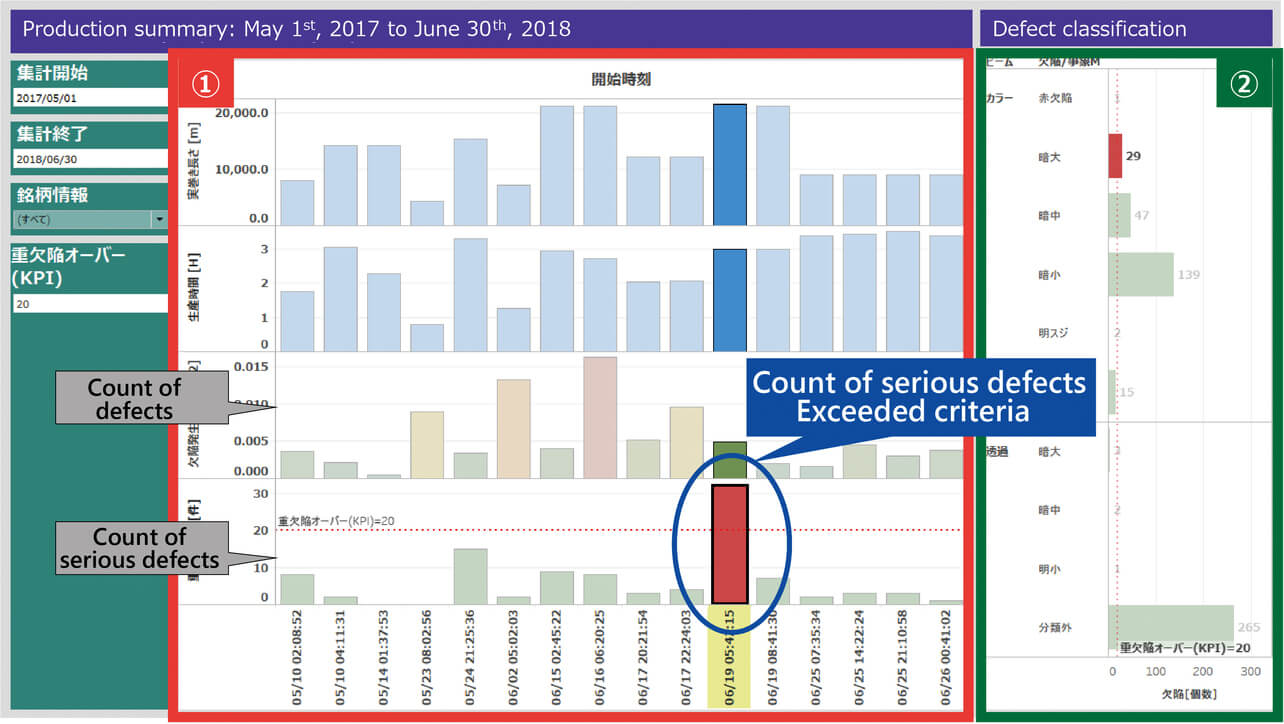
As a prospect for the future, we strengthen the cooperation with MONOSASHi, which is the service providing quality information by the visualization of inspection data, and we are not satisfied simply by the improvement in classification performance, unitarily manage all information that includes the defect generation information obtained from inspection systems using DB time-serially, and perform processing to obtain the visualized information needed by the site to promote improvements ate the manufacturing site. The image of realization is shown in Fig. 8.
In addition, since we deal with defects that cannot be classified by visible light images from the aspect of performance, we perform the expansion to the input of images with wavelengths other than visible light, such as near infrared, and are considering the further evolution of multi-wave sensing technology that is one of our strong points.
Finally, we express our gratitude to the staff of the Technical Division who cooperated significantly in our studies of the proposed technique and the persons who cooperated with us to provide the image data for the performance verification and to verify them.
References
- 1)
- OMRON Corporation, “PCB inspection system,” (in Japanese), https://www.fa.omron.co.jp/product/special/pcb-inspection-system/ (accessed Mar. 10, 2022).
- 2)
- OMRON Corporation. “Sheet inspection system,” (in Japanese), https://www.fa.omron.co.jp/product/inspection-system/web-inspection-system/ (accessed Mar. 10, 2022).
- 3)
- A. Krizhevsky, I. Sutskever, and G. E. Hinton, “ImageNet Classification with Deep Convolutional Neural Networks,” Adv. Neural Inf. Process. Syst., vol. 25, pp. 1097-1105, 2012.
- 4)
- Y. Hanzawa, Y. Ikeda, M. Kurita, and Y. Hasegawa, “Automation of appearance inspection by AI technology,” (in Japanese), OMRON TECHNICS, vol. 51, pp. 21-25, 2019.
- 5)
- L. Chen, J. Chen, H. Hajimirsadeghi, and G. Mori, “Adapting Grad-CAM for Embedding Networks,” in IEEE Winter Conf. on Applications of Computer Vision (WACV), 2020, pp. 2783-2792.
The names of products in the text may be trademarks of each company.