


Stable reading for UHF RFID
- RFID
- Stable communication
- Post-installation adjustment
- Traceability
- RF tag
In the automotive industry, the increase in the number of recalls is a problem. In order to respond quickly when a recall occurs, there is likewise an increasing importance of individual part identification to identify when and where all the components are produced. Among individual part identification techniques, RFID, having the advantage of being more resistant to dirt, oil and dust, is classified into HF band RFID for short-range communication and UHF band RFID for long-distance communication. However, UHF band RFID has a problem whereby erroneous detection occurs due to reflection of radio waves from surrounding structures. This is the problem to be solved.
Therefore, focusing on the movement of the RF tag at the production site, we developed an algorithm to distinguish between the non-target RF tag and the target RF tag by detecting the transition of the unintended power reception from the RF tag. With this technique, a highly reliable long distance individual part identification system can be achieved.
1. Introduction
The whole automotive industry is faced with an embarrassing increase in recalls1). A product recall involves identification of the extent of the recall, retrieval of products, and improvement of the production process. What then matters is to clarify “when” and “where” the problematic part was “manufactured and assembled.” The ability to quickly trace back the history of a “processed/assembled” product in that way is called “traceability.”
On production site, individual identification systems are used to ensure traceability. Such systems include code readers (CRs) and high-frequency band radio frequency identifiers (HF-band RFIDs). With their advantage of being “soil-resistant,” RFID systems in particular have been highly valued as an identification method for individual parts prone to oily smudges and stains. RFIDs are classified either the magnetic field coupling type or the radio-wave type. From among these, UHFband RFIDs capable of long-range communication have to be used to identify large parts.
Unlike magnetic field coupling-based HF-band RFIDs, however, UHF-band RFIDs use radio waves; hence, false readings of non-targeted RF tags may occur owing to radiowave reflections from surrounding structures.
The following methods are known to reduce the negative effects of radio-wave reflections:
- (1) Installation of radio-wave absorbers2)
- (2) Use of antennas devised to reduce the spread of the radio waves3)
- (3) Adjustment of antenna angle or transmission power
On a real production line, however, method (1) is impractical owing to the limited space available for installing radio-wave absorbers. Method (2) would result in an antenna too large to fit in a limited space. In addition, both methods (1) and (2) have the drawback of being very costly. While free from the problems of large installation space and increased cost, method (3) has its own drawback: difficult post-installation adjustments. This is because radio-wave reflections are constantly changing owing to continuous operation of the surrounding structures (e.g., nearby transfer systems or assembly robots). As a result, the received power from a non-targeted RF tag changes every time a measurement is taken. This makes optimum adjustment impossible. Conventionally, a long-term operational test has been performed for verification. This is, however, a timeconsuming process because it requires readjustment every time a problem occurs. Its operational practicality is particularly low in environments where readjustment is required to accommodate changes that occur to the surrounding structures every time a change is made to the manufacturing line.
We thus decided to take an alternative approach to the conventional one that adjusts the communication range to prevent radio waves from reaching non-targeted RF tags. Therefore, assuming that the radio waves reach both targeted and non-RF tags, we explored an algorithm capable of distinguishing between the two versions of RF tags. An algorithm with such a capability would provide a solution to the problems with the conventional methods, such as installation space, increased cost, and post-installation adjustment.
2. Test environments
Included among the intended use environments for UHF-band RFIDs are vehicle body assembly lines. As shown in Fig. 1, the reader/writer is installed at a height of 3 to 5 meters; RF tags are fitted on vehicle roofs; the distance between the RF tags is between 4 and 5 m; and the vehicle height is between 1 and 3 m.
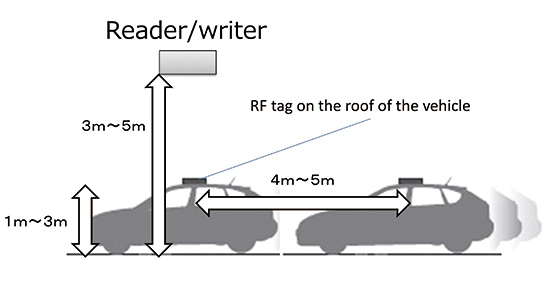
The system in the test environment in Fig. 1 uses a conveyor control device or a photoelectric sensor to detect the movement of the vehicle body right under the reader/writer. When the movement is detected, the host system sends the read command to the reader/writer.
3. Problem set
When the read command is sent to a targeted RF tag right under the reader/writer, it must be ensured that false readings of the non-targeted RF tags fitted on the vehicles in front and behind.
If the reader/writer-to-non-targeted RF tag distance (red line in Fig. 2) does not differ much from the reader/writer-totargeted RF tag distance (blue line in Fig. 2), the difference in received power between the targeted and non-targeted RF tags will be so small as to make it easy for a false reading to occur.
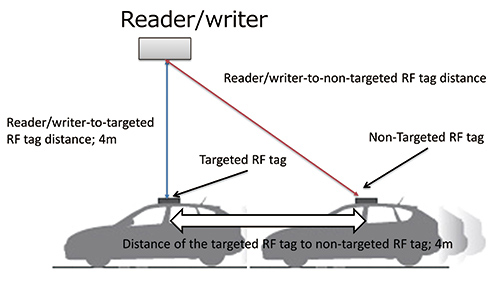
In the test environment, the ceiling height of the factory building is between approx. 3 and 5 m; the vehicle height is between approx. 1 and 3 m; the distance of the reader/writer to the targeted RF tag is between 2 to 4 m; and the non-targeted RF and targeted RF tags are 4 to 5 m apart from each other.
In this environment, when the reader/writer is 4 m above the targeted RF tag, with the non-targeted RF and targeted RF tags 4 meters apart from each other, the difference in distance becomes shortest, thereby providing a false reading-prone condition.
In an ideal environment free from radio wave reflections, the received power from the targeted and non-targeted RF tags follow the profiles (loci) shown in Fig. 3. At vehicle position 0 m (with the targeted RF tag right under the reader/writer), the targeted RF tag (blue dotted profile) has a sufficient power difference from the non-targeted RF tag (red dotted profile), a difference large enough to prevent a false reading of the nontargeted RF tag.
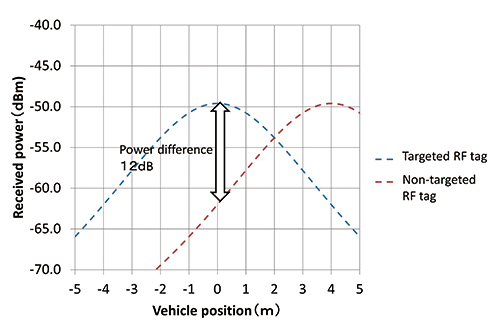
In a real environment, however, the radio waves are affected by reflections from the surrounding structures and do not behave as in Fig. 3.
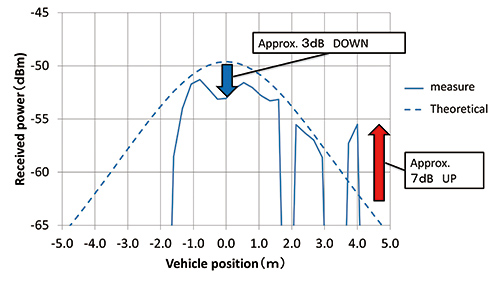
Therefore, a reader/writer was held at a 4 m equivalent height (*1) from an RF tag fitted on a vehicle roof, as shown in Fig. 4, and two buildings 4 m from the right and left of the vehicle were used as surrounding structures, to conduct an outdoor test (*2). Note that the graphs in Fig. 5 and onward assume that the point with the RF tag positioned right under the reader/writer as shown by the dotted line in Fig. 4 is referenced as vehicle position 0 m.
※1:In practice, the test was conducted with a ladder-mounted reader/writer held at a point 1.5 m above the roof. The distance from the roof was converted to 4 m according to the law of similarity.
※2:The test was conducted outdoors because the vehicle could not be brought inside our factory.
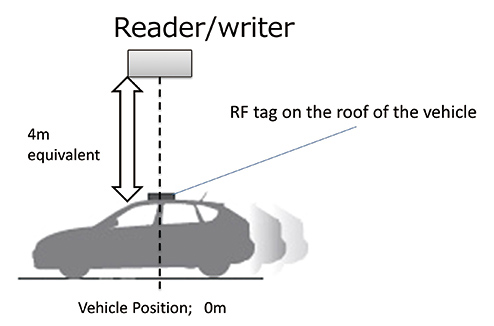
Fig. 5 shows the test results. The value of power at the center position was 3 dB down from the theoretical value obtained with no reflectors around (blue arrow in Fig. 5), whereas that at a point approx. 4 m from the center increased by 7 dBm (red arrow in Fig. 5).
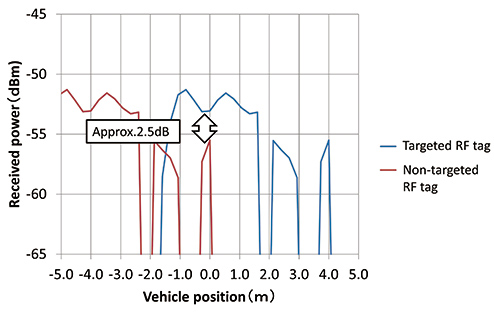
The above test was conducted using only one RF tag. With two non-targeted RF tags used, one each fitted on either of two vehicles in line, the changes in received power would appear as shown by the blue and red lines in Fig. 6. Accordingly, the power difference would drop to approximately 2.5 dB (white arrow in Fig. 6) from the theoretical power difference value of 12 dB in Fig. 3.
A false reading event that occurs when the power received by a distant RF tag exceeds the theoretical value as observed above is called a “ghost read.”
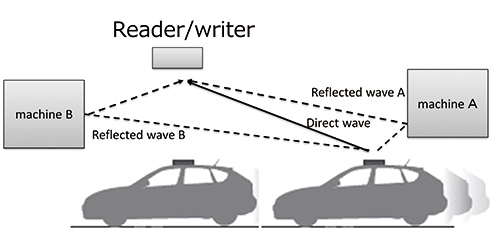
Our test revealed that this problem occurs under the condition of 4 m distance between the targeted and non-targeted RF tags. “Ghost reads” will occur even with a distance exceeding 4 m. In factories with more surrounding structures than in our test, multiple reflected waves will occur, as is the case with reflected wave A (wave reflected from Machine A) and reflected wave B (wave reflected from Machine B) in Fig. 7, and their composite wave will cause a ghost read.
Section 4.1 describes the mechanism of received power fluctuations induced by surrounding structures.
4. Technical details
4.1 Mechanism of received power fluctuations
Section 3 described a situation where a ceiling-mounted reader/writer emits radio waves downward. This chapter explains the behavior of radio waves emitted sideways. In the case of sideways emissions, the primary reflective surface is a floor. Meanwhile, in the case of downward emissions, walls, machines, and other obstacles provide reflective surfaces and cause events similar to the one that occurs with a sideways emission.
With the presence of surrounding structures, the radio waves are either direct or reflected waves that reach the reader/writer or the RF tag, each taking a propagation path different from that of the other (Fig. 8).
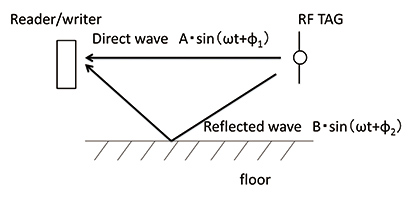
The composite wave of the direct and reflected waves is expressed by equation (1) below:
-
 (1)
(1)
-
 : Time
-
 : Direct wave amplitude
-
 : Reflected wave amplitude
-
 : Direct wave phase
 : Reflected wave phase
-
 : Angular frequency
When
 , the radio waves intensify each other, resulting in increases in received power. Meanwhile, when
 , the radio waves weaken each other, resulting in decreases in received power. When
 , in particular, reading is completely impossible.
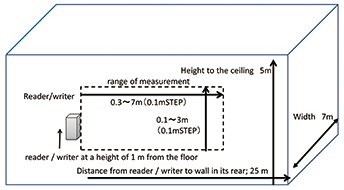
To help visually understand the received power in the interrogation zone, a received power map was measured in our laboratory as illustrated in Fig. 9 (ceiling height=5 m; right and left wall widths=7 m; distance from reader/writer to wall in its rear=25 m; and reader/writer installation height=1 m).
In Fig. 10, the points indicated by the red arrows represent spots where a ghost read occurred owing to increases in received power, while those indicated by the orange arrows show spots where the radio waves weakened each other so much as to cause a missed read to occur.
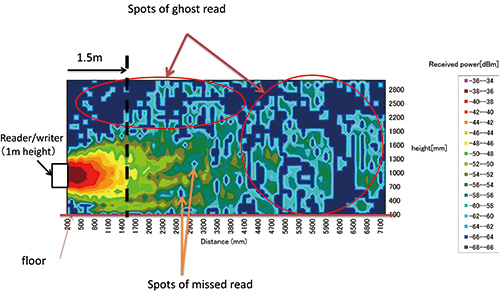
The received power measured at 1.5 m above the reader/writer (dotted line in Fig. 10) is plotted in the graph below in Fig. 11.
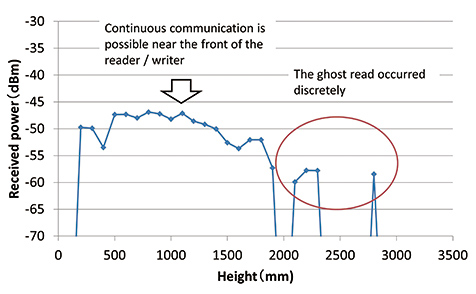
As shown in Fig. 11, continuous communication remained intact near the front of the reader/writer, whereas the ghost reads occurred discretely. The reason for this is as follows: the received power did not fluctuate very much near the front of the reader/writer, where the direct wave remained stronger than the reflected wave and strong enough to resist its influence; meanwhile, the received power fluctuated significantly at the ghost read occurrence points, where the direct wave was so weak as to be significantly affected by the reflected wave.
In a factory environment, reflected waves are constantly changing owing to continuous operation of surrounding structures such as transfer systems and assembly robots. Hence, ghost reads do not occur constantly, but rather in an on-and-off fashion.
4.2 False reading prevention technique
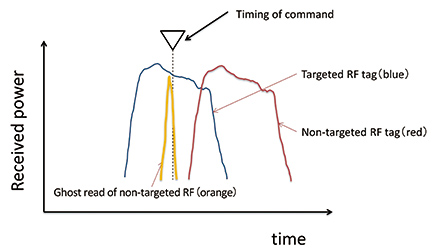
Fig. 12 shows the changes in received power measured with RF tags moving over a certain distance from the reader/writer as shown by Fig. 11 in Section 4.1. A false reading of a nontargeted RF tag may occur (red profile in Fig. 12) if a command is issued to a targeted RF tag (blue profile in Fig. 12) at the ▽ -marked timing after a ghost non-targeted RF tag read (orange profile in Fig. 12).
Thus, the integrated value of received power during the period from the start of communication to the timing of command issuance should be determined for each RF tag ID in order to avoid false reading.
The principle is that the areas of the blue and orange highlighted regions in Fig. 13 are determined by integration. Because ghost reads occur only discretely, the orange highlighted region has a smaller area than the blue highlighted region. Accordingly, the targeted RF tag will be read correctly even if the received power from the non-targeted RF tag is greater than that from the targeted RF tag at the timing of command issuance.
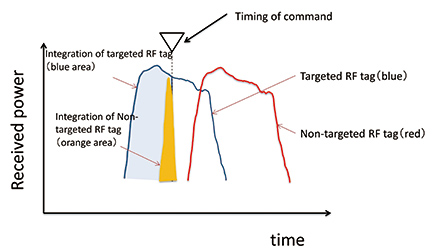
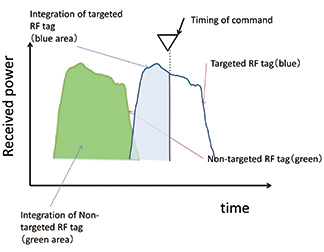
Fig. 13 illustrates a typical case of simple integration processing. Simple integration, however, does not allow the correct identification of a targeted RF tag if the targeted RF tag is preceded by a non-targeted RF tag. More specifically, in Fig. 14, the integration area for the preceding non-targeted RF tag (green highlighted region) is larger than that for the targeted RF tag (blue highlighted region). Consequently, the preceding non-targeted RF tag is selected.
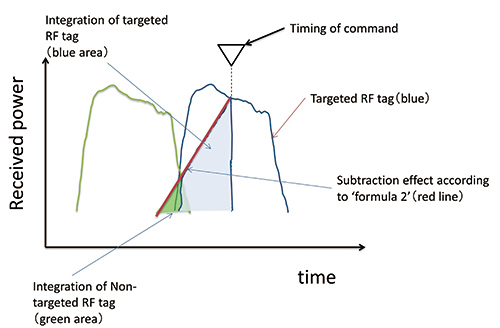
In our technique, the integral of the preceding receivedpower values is multiplied by a weighting factor to solve the above problem:
-
 (2)
(2)
-
 : Integrated value of calculation result
-
 : Received-power value at command issuance
-
 : Power received for nth time before command issuance
-
 : Weighting factor (value smaller than 1)
-
 : No. of times of communication before command issuance
From equation (2), the result for the first previously received power is calculated smaller than it would be without multiplication by the factor  and that for the nth previously received power is calculated smaller than it would be without multiplication by the fact or
  . It hence follows that the value thus obtained is the area below the red profile in Fig. 15 (subtraction effect derived from Equation (2)). Accordingly, the integrated value for the targeted RF tag (blue highlighted region in Fig. 15) is greater than that for the non-targeted RF tag (green highlighted region in Fig. 15), thereby allowing the identification of the targeted RF tag.
4.3 Effectiveness verification
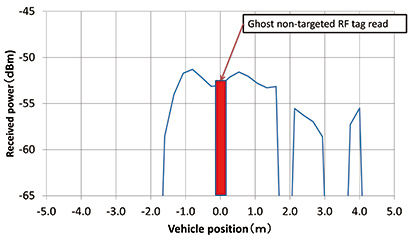
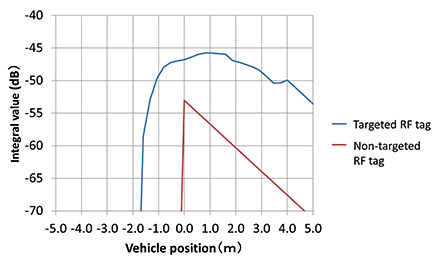
A simulation based on the measured data from Fig. 5 was performed to verify the effectiveness of our technique. Assume that a ghost non-targeted RF tag read occurs at the timing of command issuance as in Fig. 16.
Fig. 17 shows the post-integration processing values. The integrated value for the targeted RF tag (blue profile in Fig. 17) starts to rise from around vehicle position – 1.8 m where communication starts. Meanwhile, the integrated value for the non-targeted RF tag suddenly shoots up, as shown by the red profile in Fig. 17, because it is entered at vehicle position 0 m.
By calculating the difference between the integrated value for the targeted RF tag (blue profile) and that for the non-targeted RF tag (red profile) in Fig. 17, the red locus or profile in Fig. 18 is obtained. In the green region above 0 dBm, the targeted RF tag can be read correctly.
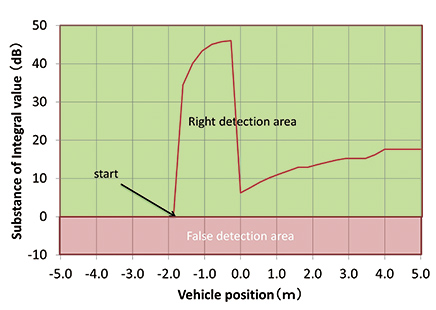
Fig. 18 shows that the difference value between the targeted and non-targeted RF tags remains above 0 dB after the start of communication at vehicle position – 1.8 m. This means that the tags will be distinguished from each other even if a high received power from the non-targeted RF tag is detected at the time of command issuance.
Our technique has been implemented as a “Focus Function” in our UHF-band RFID (Model V780-HMD68). Fig. 19 shows the appearance of Model V780-HMD68.
5. Conclusion
We successfully developed a technique that can prevent falsepositive RFID tag reads in UHF-band RFID systems through the integration of changes in received power from RF tags. The distinction of this technique is that it can prevent false reads without the need for post-installation adjustment when implemented in a reader/writer system with a hardware configuration similar to conventional ones. This technique provides a space-saving, inexpensive, and reliable method of long-range individual identification.
The remaining challenges include resolving the problem of interference among reader/writer units. In the technique presented above, radio waves are constantly emitted to monitor the received power from RF tags. Therefore, with reader/writer units installed at short intervals, their radio waves may interfere with each other and reduce the number of points available for communication, resulting in the false identification of targeted RF tags.
We will continue improving our algorithm to address such challenges and to provide reliable long-range individual identification systems flexibly compatible with customersʼ line designs.
References
- 1)
- Ministry of Land. “Recall notification number of each fiscal year”.http://www.mlit.go.jp/jidosha/carinf/rcl/data_sub/data004.html,(accessed 2018-10-31).
- 2)
- Tokyo institute of Technology. “Suppression of the reflected intensity from buildings”.https://www.jstage.jst.go.jp/article/itej1954/31/1/31_1_17/_pdf, (accessed 2018-10-31).
- 3)
- Antenna Engineering Handbook, ohmsha, 2001/1/25, p. 153-154.
The names of products in the text may be trademarks of each company.