


Measuring “insulation resistance” for three-phase motor while operating
- Three-phase motor
- Maintenance
- Insulation resistance
- Minute leakage current
- Leakage current of inverter-driven motor
In production lines, stable operation of machines is one of the most important factors so that it is required to have scheduled maintenance at the right timing.
In most maintenance scenes, maintenance personnel will visit factories for regular maintenance and inspection. However such action has become more and more difficult these days due to shortage of workers and engineers. Additionally, risks of losing business chances due to the sudden stop of machines often force maintenance personnel to focus more on the corrective maintenance. As a result, the shortage of workers and engineers will accelerate. This fact urged us to change our style of maintenance to a preventive maintenance by monitoring machines’ condition.
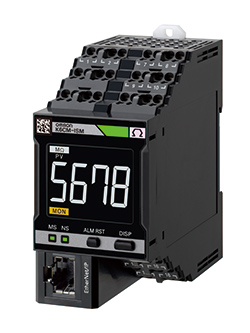
We focus on the three-phase induction motor which is used in various machines as power source and normally treated as an inspection target. To deal with its problems, we developed the “Motor Condition Monitoring equipment (K6CM series)”. The K6CM series makes it possible to identify common motor failure by using the parameters (vibration, temperature, current and insulation resistance) it’s able to monitor.
This article describes the method of measuring insulation resistance of an operating three-phase induction motor with inverter. In conventional method, it is very difficult to realize. The method did not only make the measurement possible, but also succeeded in achieving sufficient accuracy.
1. Introduction
1.1 Present situation and problems for maintenance and inspection of three-phase motor
To ensure the stable operation of production equipment, the low-voltage induction motor (hereinafter referred to as the “motor”) which is the power source of such equipment is subjected to important maintenance and inspection at maintenance sites. The maintenance and inspection includes the daily inspections to be implemented every day, regular inspections to be implemented once every one or two months, and disassembly and inspection to be implemented once every one or two years, and diverse inspection items are included therein1).
However, under the circumstances that continuous operation for 24 hours a day is demanded for many motors, scheduled execution of the inspection implemented every one or two months is becoming much more difficult owing to the aggravated shortage of labor and engineers at maintenance sites.
In particular, regarding the measurement of insulation resistance across the stator winding and the ground (hereinafter referred to as the “insulation resistance”), which is one of the regular inspection items, the general measuring method is to stop the motor and measure the insulation resistance1), which constitutes a factor that makes the scheduled inspection more difficult.
Therefore, technology for measuring the insulation resistance while operating the motor is in demand and products that constantly monitor the insulation resistance or the leakage current as an alternative therefore have been proposed by various manufacturers including Omron Corporation2).
In addition, for the measurement of the insulation resistance of a motor that is inverter-driven to achieve an energy-saving effect3), there are conditions that cannot be handled by the conventional technologies/products2), and thus there has been demand for new measurement technologies.
1.2 Measurement method of conventional technology
Before describing the problems that are inherent in conventional technologies and products, as well as the resolutions thereof, we will describe the method for measuring the general insulation resistance with the motor in operation in this section.
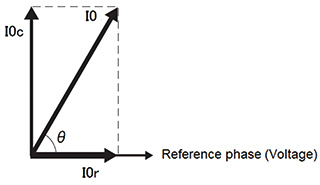
The insulation resistance with the motor in operation can be calculated by applying Ohmʼs law based on the leakage current (hereinafter referred to as “I0”) and the voltage to ground. Note that, however, I0 includes, but is not limited to, motors. In general, there is current with ground resistance components (hereinafter referred to as “I0r”) and current with ground capacitance components (hereinafter referred to as “I0c”), and I0c must be removed because it does not contribute to the insulation resistance.
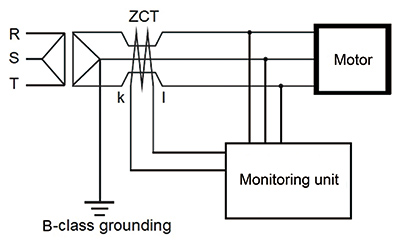
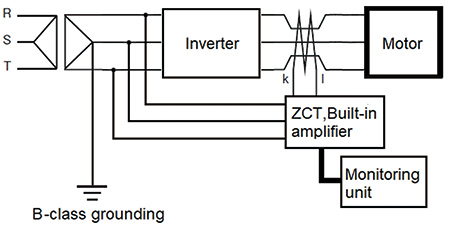
The measurement of I0r includes the passive method and the active method. With the passive method, I0r is separated and extracted from I0 which is taken out from the zero-phase current transformer4) (hereinafter referred to as “ZCT”) by using the principles “I0r is in the same phase as the power source voltage” and “I0c is advanced by a phase of 90°”). Figure 1 shows the relationship between phases, and Figure 2 shows the system configuration diagram.
On the other hand for the active method, a signal of a frequency different from the power supply system is superimposed on the grounding conductor by using a superimposing transformer, the superimposed signal is taken out from the ZCT, and I0r and I0c are calculated, thereby removing the effects5).
In this paper, we implemented examinations by adopting the passive method, which is easy to install and does not require the superimposing transformer.
1.3 Problems inherent in conventional technology
For the case where the motor is inverter-driven, the transmission noise discharged from the inverter must be removed because the I0 of the inverter operation frequency is superimposed on the I0 of the commercial power source frequency. Although this method is proposed in a reference6), “beat” will be generated across the voltage to ground and I0r in particular when the frequency of the commercial power source is close to the frequency of inverter operation, resulting in a significant error in the calculation of the insulation resistance. This problem leads to a major issue, in that the number of applications in which the method that can be utilized is limited.
In Chapter 2, to solve the problems, we will describe the method for measuring the insulation resistance with high precision, while avoiding the “beat” resulting from the inverter operation frequency.
1.4 Problems for enabling practical application
As shown in Fig. 2, the output terminal of a general ZCT and the monitoring unit are connected with cables. It is recommended that the insulation resistance of the motor should at least be 1 MΩ1), and for the voltage to ground of 200 V, I0r should be 200 μA or below. At this time, when the general ratio of current transformation of the ZCT is set to 1,000:1, the output current of the ZCT will be a minute level of 200 nA. To enable the measurement of such a minute signal, we set the suppression of noise received from surrounding power wiring, etc., under a general industrial environment as the problem to be solved.
In Chapter 3, the problems and the measures for allowing the practical application as permanent equipment will be described, and in Chapter 4, the validation results using the product developed this time will be presented.
2. Proposed Measurement Method under Operation
2.1 Effects of “beat” of inverter
When a motor is inverter-driven, the leakage current derived from the commercial power source frequency (hereinafter referred to as “I0SYS”), the leakage current derived from the high frequency noise of the inverter (hereinafter referred to as “I0NOISE”), and the leakage current derived from the operation frequency of the inverter (hereinafter referred to as “I0INV”), respectively, flow into ground, as shown in Fig. 3, and such currents flow back to the grounded phases of the power supply system under the superimposed state7),8). The insulation resistance Ro can be calculated by the formula Ro=V/I according to Ohmʼs law. When the reference voltage is assumed to be the commercial power source for the calculation, it is difficult to calculate the insulation resistance from the I0 detected with the ZCT owing to the influence of the inverter operation frequency. Therefore, the insulation resistance Ro must be calculated after acquiring the technique to extract I0SYS based on the commercial power source frequency.
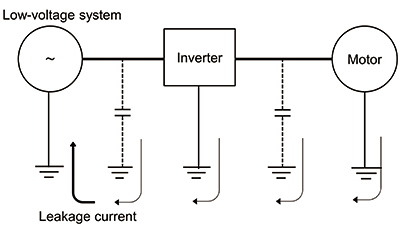
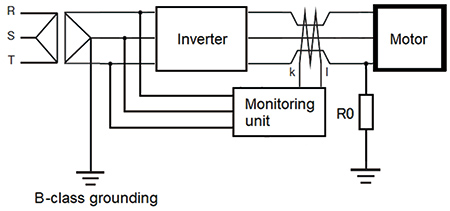
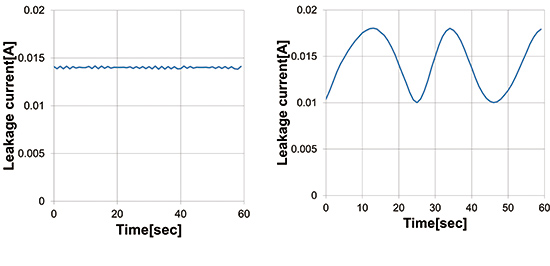
Fig. 4 shows the system configuration in cases where the commercial power source frequency and the inverter operation frequency are close and cases where they are different are comparatively verified. The commercial power source frequency was set at 60 Hz, and in cases where the inverter operation frequency is different, the frequency was set at 50 Hz(a), and at around 60 Hz(b) where the “beat” is likely to occur. To remove the influence of the I0NOISE components that are not derived from deteriorated insulation of the motor, the ZCT was inserted at the output side of the inverter. The measurement was implemented by arranging a phase sensitive detector wherein the commercial power source is used as the reference signal in the monitoring unit. Fig. 5 shows the measurement results of I0 by installing a known resistor R0 to generate I0.
For the case of 50 Hz(a), I0NOISE and I0INV are removed through phase-sensitive detection and the measurement could be carried out following the formula I0=I0SYS. Referring to 60 Hz(b), because the frequency is close to that of the commercial power source frequency, the “beat” occurs with I0SYS and I0INV superimposed on I0 even if synchronous detection is applied. The “beat” constitutes an obstructive factor for measuring I0 under an operating state.
2.2 Proposed method for separating leakage current
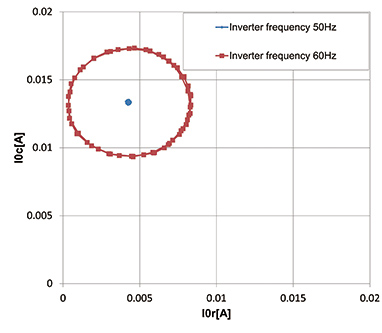
In this section, the method for measuring I0SYS based on the commercial power source frequency even under the condition where “beat” exists will be described. Fig. 6 shows the results of the 2-dimensional expression of I0 shown in Fig. 5 by using the phase information to separate I0r and I0c.
At 50 Hz, the formula I0=I0SYS is obtained by phasesensitive detection and I0 concentrated on the same point. At 60 Hz, I0 describes a circle with the I0SYS and I0INV superimposed on it. The I0 at that time can be expressed by the formula (1). It should be noted that the frequency Δf of the formula (1) implies the difference between the reference commercial power source frequency and the inverter operation frequency.
-
 (1)
(1)
From Fig. 6 and the formula (1), it can be known that, when the inverter operation frequency comes closer to the commercial power source frequency, I0SYS can be calculated from the center point of the circle, irrespective of the inverter operation frequency.
2.3 Speeding up of measurement method
The application software for the motor includes an alternative operation system which executes operation by switching two or more motors at regular intervals, and the intervals are in units of several tens of seconds to several minutes.
To shorten the measurement time so that the time can be applicable to such application software wherein the driving time of the motor is short, the center of the trajectory shown in Fig. 6 was calculated by using the least-squares method before the circumference of the circle closes.
Fig. 7 shows the calculation results of I0 by using the leastsquares method from the trajectory of measurement values within several seconds. The figure reveals that I0SYS can be calculated based on the commercial power source frequency in several seconds. Because I0r is equivalent to the X value of the central coordinate of the circle, it can be calculated using the conventional technology stated in Section 1.2.
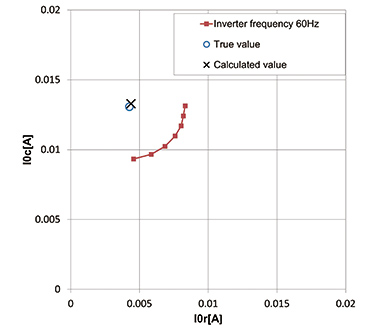
By applying the method stated in the above, the calculation of I0r and the insulation resistance based on the commercial power source frequency becomes possible within a short period of time after removing the influence of the inverter operation frequency.
3. Practical application as permanent equipment
3.1 Problems for enabling practical application
To enable practical application, a reduction in the influence of the noise present in the measurement environment is also important. The reason for this is that, for using the equipment permanently as a state monitor, there is a concern that the required S/N ratio cannot be secured as a result of being influenced by noise attributed to the environment because the number of places where the equipment can be installed is limited.
Noise includes various types, and the noise that the equipment is affected by most severely is the induction noise of the commercial power source frequency generated by power lines, etc. This is because the frequency of induction noise is completely synchronized with I0r.
3.2 Countermeasures for noise synchronized with I0r
Because the influence of induction noise becomes smaller as the wiring length between the ZCT and the monitoring unit becomes shorter, we examined the placement of a restriction on the wiring length. However, our survey on the relationship between the induction noise and the wiring length on actual equipment revealed that the wiring length must be suppressed to several centimeters to maintain good measurement accuracy.
To realize the required wiring length, a measurement amplifier was incorporated in the ZCT. The arrangement to execute A/D conversion with the measurement amplifier and feed the signals as digital signals to the monitoring unit can dramatically expand the wiring length while maintaining the noise resistance.
3.3 Embodiment of countermeasures
Fig. 8 shows the schematic diagram of the ZCT with a built-in measurement amplifier we developed this time. The entire system was designed to be compact by adopting the configuration where the power to activate the measurement amplifier is supplied from the monitoring unit.
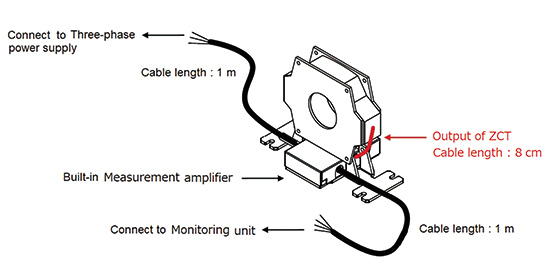
Fig. 9 shows the external view of the monitoring unit developed this time, and Figures 10 and 11 show the configuration diagrams of the insulation measurement system. Regardless of the inverter, the reference voltage is directly taken in from the commercial power source and the ZCT is installed near the motor.
![Fig. 10 System configuration for motor drive without inverter [G3]](/global/en/assets/img/technology/omrontechnics/vol51/005/img_10.jpg)
4. Performance Evaluation
We implemented the performance evaluation on actual equipment by using the ZCT with a built-in measurement amplifier and the monitoring unit developed this time.
The premise for the performance evaluation on the inverter drive should be that the countermeasures for induction noise are on a sufficient level as shown in Chapter 3. To verify the premise, we implemented the evaluation on the direct voltage supply of commercial power source with the system configuration shown in Fig. 10.
Although it is ideal to execute comparison and verification with the measurement results of the general insulationresistance meter by using an actual motor for which the insulation has deteriorated, it is difficult to procure such a motor. Instead, we installed a known resistance R0 as shown in Fig. 4 and implemented measurement with the condition that the deterioration of insulation resistance is simulated. The motor used at that time is in a sound condition, and the insulation resistance reading through the measurement with an insulationresistance meter was 100 MΩ or greater. It should be noted that the power source used was 3-phase, 200 V, 60 Hz.
Table 1 shows the verification results. For R0=1.0 MΩ, the error of the measurement results was 5.7%. In cases where the countermeasures described in Chapter 3 are not taken in the system configuration that is shown in Fig. 2, the error will exceed 50% under the same conditions, which reveals a significant improvement. Setting the R0 value to be smaller for the simulation of the deterioration of insulation results in measurement results that follow the change, and it is possible to judge that the performance can endure state monitoring at actual maintenance sites. It should be noted that this case simulates the deterioration of insulation of Phase T, and similar results could also be obtained by verification of other phases.
| R0 [MΩ] |
Measurement Result [MΩ] |
Error [%] |
Reference: Theoretical value of I0r [μA] |
|---|---|---|---|
| 1.0 | 0.943 | -5.7 | 200.0 |
| 0.9 | 0.853 | -5.2 | 222.2 |
| 0.5 | 0.499 | -0.2 | 400.0 |
| 0.2 | 0.199 | -0.5 | 1000.0 |
Next, we implemented the performance evaluation with the inverter activated under the system configuration shown in Fig. 11. The conditions are the same as those for the direct voltage supply, except that the operation frequency of the inverter is varied.
Table 2 shows the verification results of the case where the operation frequency is set at 60 Hz when the operation frequency is close to the commercial power source frequency. With the conventional system, the measurement results at R0=1.0 MΩ fluctuated within the range from 0.2 MΩ to 1.3 MΩ. However, with the present technology, high-precision measurement results could be stably obtained. Judging from the above, it appears that the present technology has the capability to resolve the conventional problems associated with inverter driving and realize state monitoring wherein the insulation resistance of 1 MΩ is set as the reference.
| R0 [MΩ] |
Measurement Result [MΩ] |
Error [%] |
Reference: Theoretical value of I0r [μA] |
|---|---|---|---|
| 1.0 | 0.976 | -2.4 | 200.0 |
| 0.9 | 0.879 | -2.3 | 222.2 |
| 0.5 | 0.492 | -1.6 | 400.0 |
| 0.2 | 0.207 | 3.5 | 1000.0 |
Table 3 shows the verification results of the case where the operation frequency is set at 50 Hz when the operation frequency is different from the commercial power source frequency. We confirmed that the measurement of insulation resistance is realized, irrespective of inverter operation frequencies.
| R0 [MΩ] |
Measurement Result [MΩ] |
Error [%] |
Reference: Theoretical value of [μA] |
|---|---|---|---|
| 1.0 | 0.944 | -5.6 | 200.0 |
| 0.9 | 0.844 | -6.2 | 222.2 |
| 0.5 | 0.508 | 1.6 | 400.0 |
| 0.2 | 0.210 | 5.0 | 1000.0 |
5. Conclusion
For an inverter motor drive, the measurement of insulation resistance becomes possible at a high speed with the proposed unique leakage current separation technique, even if the commercial power source frequency is close to the inverter operation frequency and the “beat” phenomenon occurs. Furthermore, thanks to the development of a ZCT with a built-in measurement amplifier, the commercialization of the product becomes possible with a noise resistance level that can withstand practical use. With the present technology, it is possible to implement state monitoring with the motor activated without restricting application software.
With the “Motor Operation State Monitoring Device (K6CM Series Models),” the measurement of vibration, temperature and electric current is possible, in addition to the measurement of insulation resistance, and the combined use of the respective equipment enables state monitoring in association with various types of failure factors of the motor. By installing the products permanently and grasping the operation condition of equipment in real time, we believe breakdown maintenance can be minimized at maintenance sites, thereby enabling the transitioning of breakdown maintenance to preventive maintenance.
References
- 1)
- The Japan Electrical Manufacturersʼ Association: “Handling and maintenance guideline for the low-voltage induction motor for public”, JEM-TR 160, 1987.
- 2)
- Furuya, K. A Technology to Detect the Leakage Current in LV Circuits. The Journal of the Institute of Electrical Installation Engineers of Japan. 2013, Vol.33, No.4, p.254-256.
- 3)
- The Japan Electrical Manufacturersʼ Association. Inverter a brochure of 2017-2018. 2017, 5200, p.1-8.
- 4)
- Ohama, S. Practical manual for Electric Facilities Engineer for Private Use. 2nd ed., Ohmsha, Ltd., 1988, 256p, ISBN4-274-03208-6.
- 5)
- The Japan Electric Association, Demanded Equipment Committee. Safety Regulation of Electric Facilities for Private Use. 2nd ed., Ohmsha, Ltd., 2013, p.209-216, JEAC8021-2013.
- 6)
- TANASHIN DENKI CO., LTD. Leakage current calculation device and method for calculating leakage current. WO/2014/192217. 2014-11-26.
- 7)
- Morimoto, M. Solution for the leakage current from PWM inverter at the Integrated Grounding System. The Journal of the Institute of Electrical Installation Engineers of Japan. 2011, Vol.31, No.6, p.436-442.
- 8)
- Iimori, K.; Shinohara, K.; Higuchi, T. Study about Common-Mode Equivalent Circuit of Induction Motor Driven by PWM Inverter. IEICE Technical Report Energy Engineering in Electronics and Communications. 2002. p.19-24.
The names of products in the text may be trademarks of each company.