High Resolution Coaxial Displacement Sensor Using Small Diameter Fiber for Thickness Measurement
- Displacement Sensor
- High accuracy
- High brightness
- Broad bandwidth
- Thickness measurement
In in-line thickness inspection of glass and film for displays, there is a need for a sensor that is easy to adjust during installation and can stably measure even when tilted because of fluttering or wrinkling during transport. A fiber coaxial displacement sensor based on the chromatic confocal method has been released that replaces the triangulation distance measurement method that has been the mainstay of displacement sensors. The fiber coaxial displacement sensor is resistant to inclination on glossy surfaces, which has been a problem in the past. However, in order to measure the thickness as thin as a film with a coaxial displacement sensor, it was necessary to reduce the core diameter of the fiber inside the sensor, but this was problematic because of a decrease in light intensity and high wavelength dependence at the fiber coupler. Therefore, we utilized a laser-pumped light source and optical filter coupler for visible range to realize measurement of a transparent film as thin as 15 μm. This coaxial displacement sensor with improved thickness resolution is expected to reduce the time and effort required for installation and adjustment in in-line thickness inspection and to ensure stable measurements during transport.
1. Introduction
Displacement sensors that can measure the shape, thickness, and height of parts and the position of a transport stage with high accuracy are used for the purpose of automation of the production line and maintenance of product quality. Although the laser displacement sensors of the triangulation system were the mainstay conventionally, there were problems of difficulty in installation and adjustment stemming from the system and measurement error due to the difference of materials of the object to be measured at the manufacturing sites. We released a fiber coaxial displacement sensor based on the chromatic confocal method as a product (Type ZW-CE Series) to deal with those problems first in 2012 and, thereafter, released a type with higher accuracy as another product (Type ZW-5000, 7000 Series) in 2016. The chromatic confocal method is based on the principle that the distance to the target object is obtained from the wavelength of light that is focused on the object utilizing the axial chromatic aberration possessed by the optical system. It is small, can be easily installed, not dependent on the difference of material of the object to be measured, and enabled highly accurate distance measurement even if a glossy surface is inclined at an angle of 25┬░1).
A thickness inspection is sometimes performed for thin transparent material, such as glass, for displays and functional film. For example, the thickness of a glass substrate for display is from approx. 1 mm to 100 μm, and a substrate as thin as 25 μm appeared in recent years2). A sensor of the spectroscopic reflectrometry method using an optical interference phenomenon different from the triangulation distance measurement method has been used for the measurement of the thickness of transparent film as thin as several hundred micrometers. However, there were also problems that accurate installation adjustments within several degrees are required, and tilting due to fluttering or wrinkling during transport makes the measurement unstable. The reason is that the numerical aperture of the objective lens of the sensor is designed to be small to obtain high measurement accuracy, and the inclination of the object to be measured makes light reception difficult.
On the other hand, since the fiber coaxial displacement sensor based on the chromatic confocal method is designed to have the large numerical aperture of objective lens, in principle, it can stably measure even if the object is inclined. However, products so far released could not measure the upper side and the lower side separately because both the upper side and the lower side of a transparent film as thin as 25 μm are in focus. Although it is effective to reduce the core diameter of the optical fiber inside the sensor to separate the upper side and the lower side, there arise two problems. The first problem is the decrease in received light intensity, and the second problem is that the reduction in the number of modes for propagating the optical fiber varies the transmittance of the fiber coupler inside the sensor depending on the wavelength. Such generation of a decrease in light intensity and wavelength dependence disturbs the acquisition of obtaining sufficient intensity of the signal and makes measured values unstable. Therefore, we tackled the improvement of the laser-pumped fiber light source with high luminance and wavelength dependence using an optical filter coupler for the visible range and realized the thickness measurement for a transparent film with a thickness of 15 μm thinner than 25 μm. This paper reports the details.
2. Chromatic confocal displacement sensor
2.1 Principle of chromatic confocal measurement
This principle is to measure a distance to the object to be measured by collecting light where the wavelength is different in the height direction of the object to be measured and by receiving only light with the wavelength collected to the object to be measured by complementary metal oxide semiconductor (CMOS) inside the spectroscope1).
The system is configured by a white light source, fiber couplers, optical fiber, sensor head, spectroscope, and CPU as shown in Fig. 1. The spectroscope is of the general spectral type with diffraction grating and consists of the diffraction grating and the light receiving element.
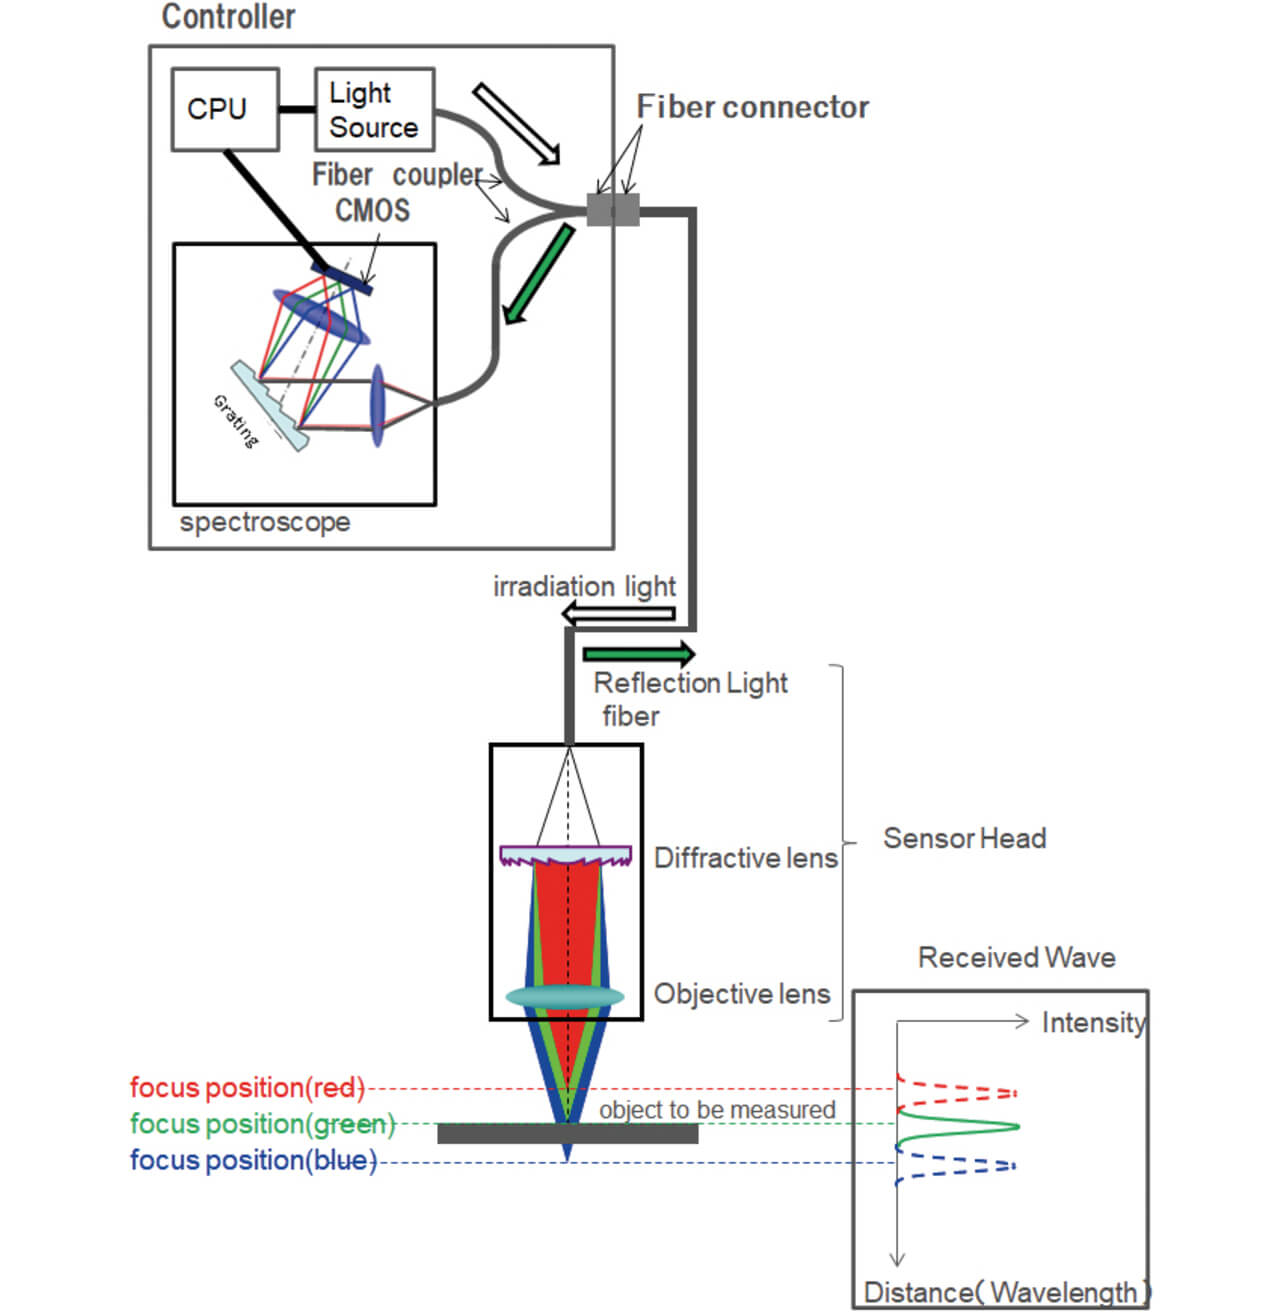
The light emitted from the white light source enters in the sensor head through the fiber coupler and optical fiber. The wavelength of incident light is spectrally dispersed in the height direction of the object to be measured by the sensor head optical system having a characteristic (axial chromatic aberration) in which the focal distance differs depending on the wavelength. Since the sensor head is of the confocal optical system in which reflection light from the object to be measured is focused on optical fiber, only light with a specific wavelength that is collected on the object to be measured is imaged in the optical fiber connected to the sensor head and enters the spectroscope. For example, since green light is collected in the object to be measured in the case of Fig. 1, only green light enters the spectroscope. On the other hand, since red and blue lights are not collected in the object to be measured, they are not imaged in the optical fiber and do not enter the spectroscope. The distance to the object to be measured can be calculated by spectrally dispersing the light that entered the spectroscope by diffraction grating, obtaining the position of pixel imaged in CMOS, and using the corrective data that make the position of pixel correspond to the distance.
The axial chromatic aberration of the sensor head is generated using a diffractive lens. The diffractive lens is one that collects and spectrally disperses light by concentric fine patterns utilizing the diffraction phenomenon of light. As diffraction phenomenon is utilized, there is a characteristic that focal distance is in inverse proportion to the wavelength of incident light. An optical system with an axial chromatic aberration where the focal distance differs depending on the wavelength is realized by incorporating a diffractive lens in the sensor head.
A white LED with a long life and not requiring exchange is often used as the white light source. The white LED means a light source that excites phosphor by a blue LED and disperses the blue color of fluorescent light and excitation light to make it appear white. Generally, the powder of YAG added with Ce is used as the phosphor material, and it generates yellow fluorescent light. The optical spectrum of the white LED is shown in Fig. 2.
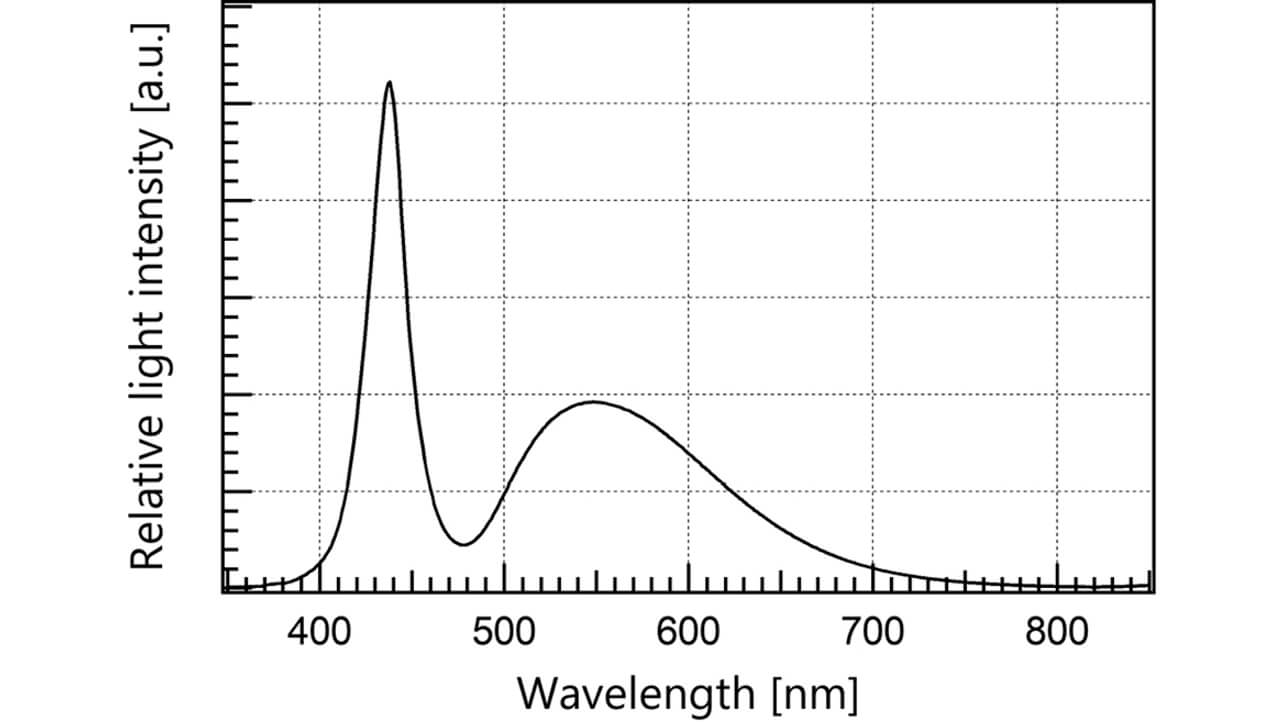
The wavelength zone is the visible range at approximately 400 to 750 nm. It consists of a spectrum with a blue steep peak at around 440 nm and with a single gently sloping peak at around 550 nm. Our company utilizes 500 to 650 nm for measurements to suppress the change in light intensity in the measurement range.
Multimode optical fiber with a core diameter of φ50 μm made of glass is used as the optical fiber. This fiber that is often used for optical communication in the short distance and for near infrared light also transmits light in the visible light range.
2.2 Technical problem toward improvement of thickness resolution
When a transparent material, such as glass, is measured by a chromatic confocal displacement sensor, light is received in the condition where the waveforms of light reflected from the upper side and the lower side, respectively, are overlapped as shown in Fig. 3. Furthermore, the horizontal axis is standardized assuming full width at half maximum (FWHM) of the received light waveform as 1.
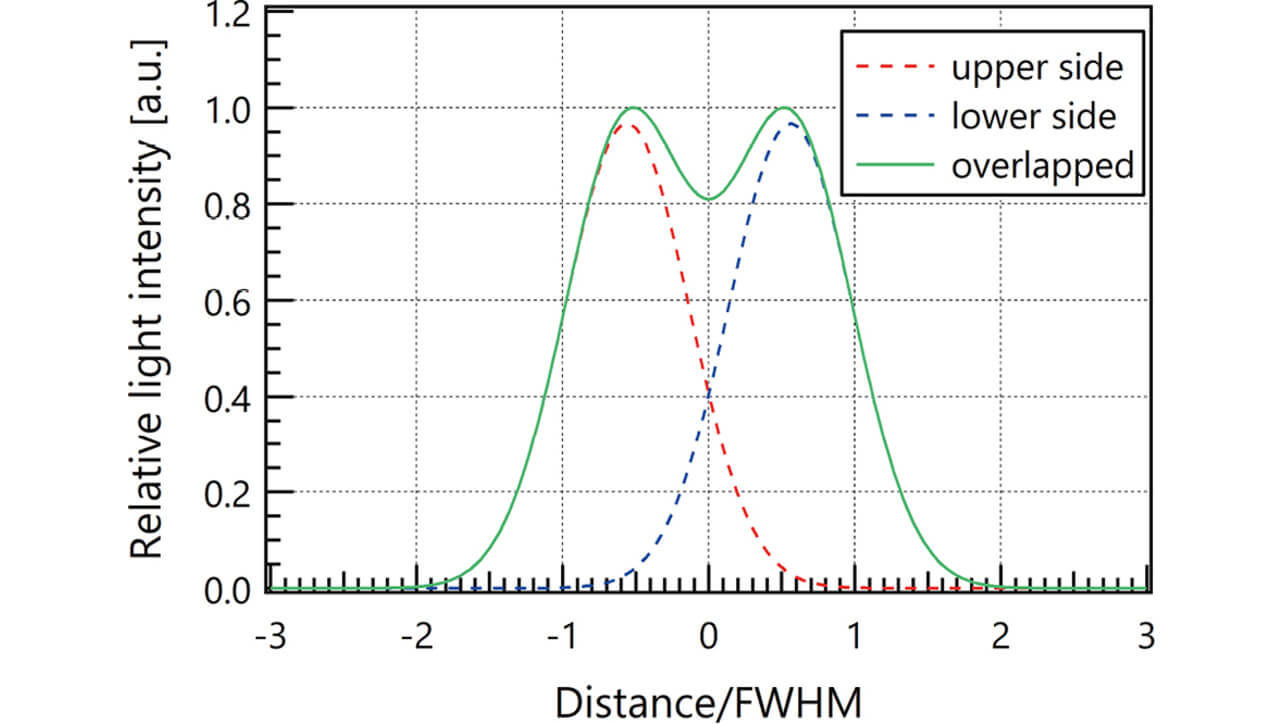
The minimum thickness that can separate two interfaces is called the thickness resolution. Although there are various definitions of separation3), we decided that it indicates the condition that the waveform is depressed by 19% or more at the peak of overlapped waveforms where two waveforms are piled up. When expressed by the Gaussian function, if it is separated by 1.12 times FWHM of the received light waveform, the depression by 19% is generated as shown in Fig. 3. In the measurement of the thickness of a transparent material, it becomes the value further multiplied by the refractive index n of the material. When the refractive index n is approximately 1.5, such as glass and polyethylene film, approximately 1.7 times FWHM of the received light waveform becomes the thickness resolution of the transparent material.
In the chromatic confocal displacement sensor, since only the light of the wavelength for which an image is in focus is received, in principle, FWHM of received light waveform corresponds to the depth of field of the sensor head, and the depth of field has the following relationships to the core diameter of optical fiber, the numerical aperture (NA) of a diffractive lens, and the numerical aperture (NA) of an objective lens1):

Fig. 4 shows design parameters related to the depth of field.
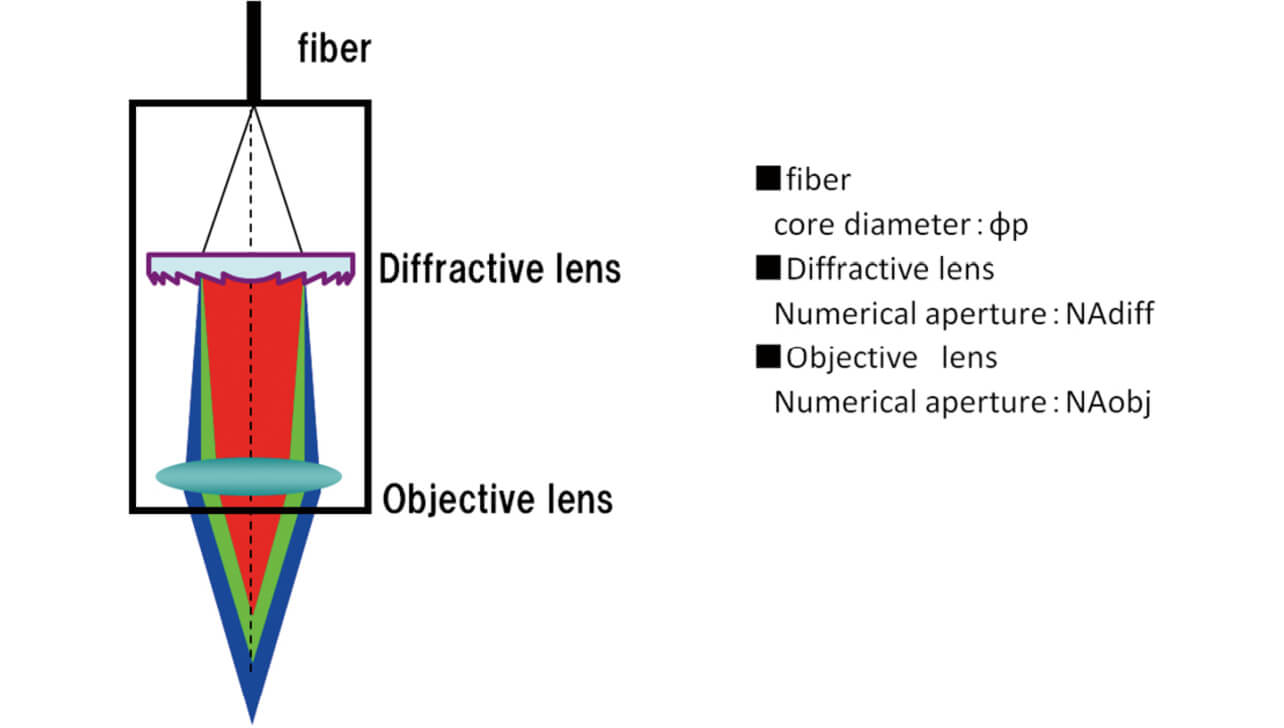
As shown by the relational expression, the improvement of thickness resolution requires the reduction of the fiber core diameter or a change in the numeric aperture of the diffractive and objective lenses. In the method of changing the numeric aperture, since the magnification of the optical system and the axial color aberration change, the measurable distance range becomes narrow, and the measurement easily becomes unstable due to the fluttering of the object generated during transport. In order to improve the thickness resolution without narrowing the measurable distance range, a reduction in the fiber core diameter is effective. When using optical fiber with a core diameter of φ10 μm instead of multimode optical fiber with a core diameter of φ50 μm, an improvement of five times is prospective.
However, there arise two problems due to the reduction in the fiber core diameter. The first is the reduction in the received light intensity. Fig. 5 shows the structure of the section where the light of the white LED is introduced to the optical fiber.
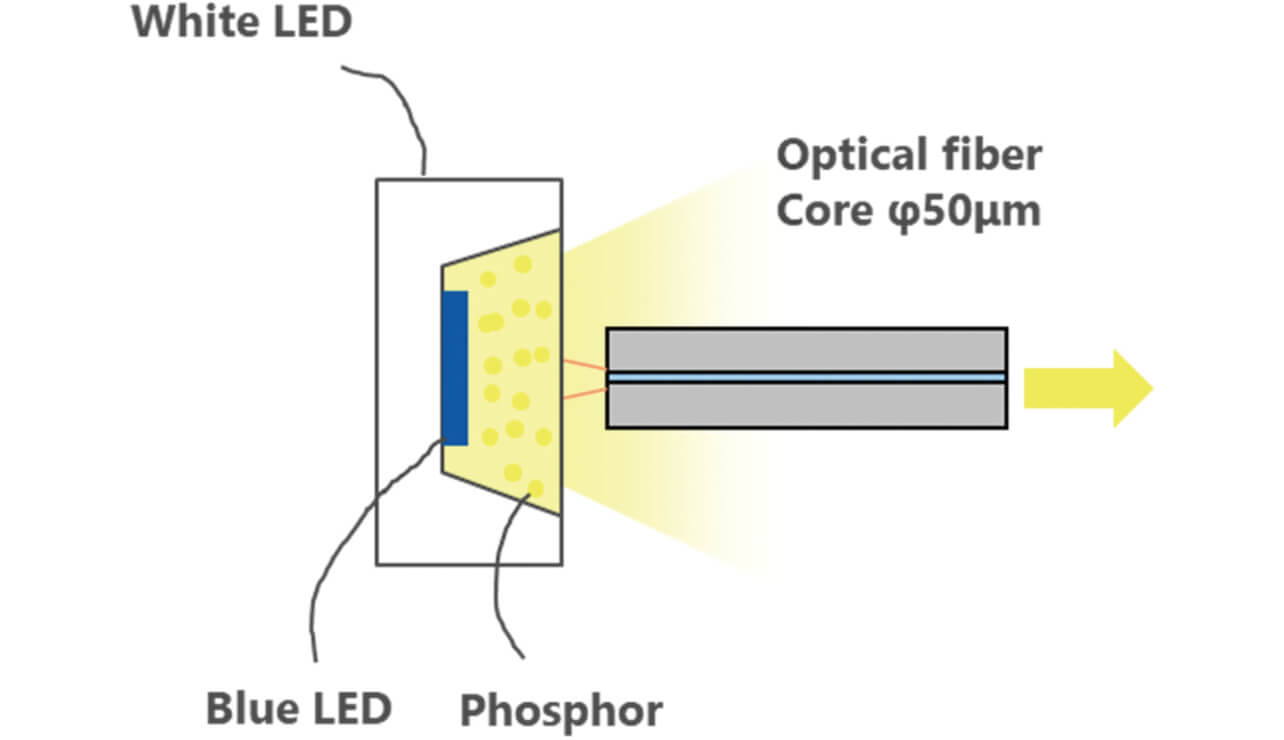
Since the light-emitting part of the white LED is sufficiently large as about 1 mm in comparison with the optical fiber core diameter, light is introduced to the optical fiber in the adjacent condition without using a lens. Therefore, the intensity of the light of the white LED entering the optical fiber is proportional to the optical fiber core diameter. When making the optical fiber diameter 1/5, light intensity is reduced to (1/5)2 = 1/25 as a result.
The other problem is that wavelength dependence is found in the transmission spectrum of the fiber coupler. As for the fiber coupler, the fused fiber coupler that is frequently used for optical communication as shown in Fig. 6 is used. When making cores close to each other while two optical fibers are stretched and fused together, the spread of the electromagnetic field distribution that seeped from the cores overlaps to generate the coupling phenomena of light, and the light power transfers to the other fiber.
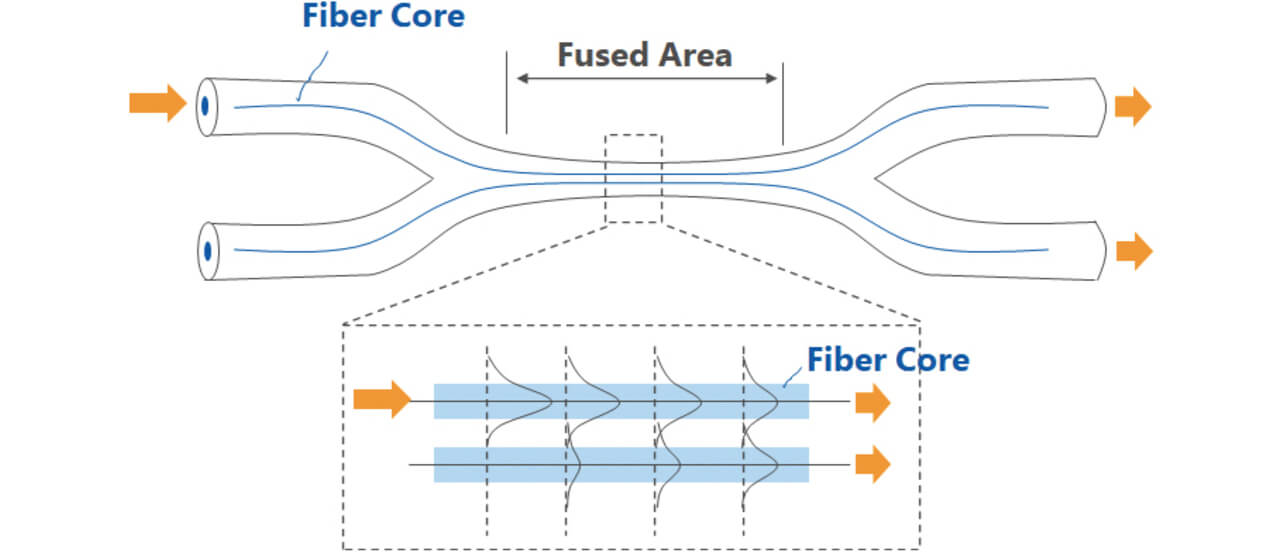
Its branching ratio is affected by the propagation mode and wavelength that determine the electromagnetic field distribution4). Therefore, the branching ratio of the coupler made of single mode optical fiber with only one propagation mode has wavelength dependence. On the other hand, since many propagation modes are able to be allowed by multimode fiber, the wavelength dependence is low because of the averaging action. However, when making a core of φ10 μm diameter propagate visible light, the number of modes is smaller than that of multimode optical fiber, and wavelength dependence appears. Fig. 7 shows two transmission spectra when the light of the white LED is branched to fused fiber couplers made of optical fiber with a core diameter of φ10 μm.
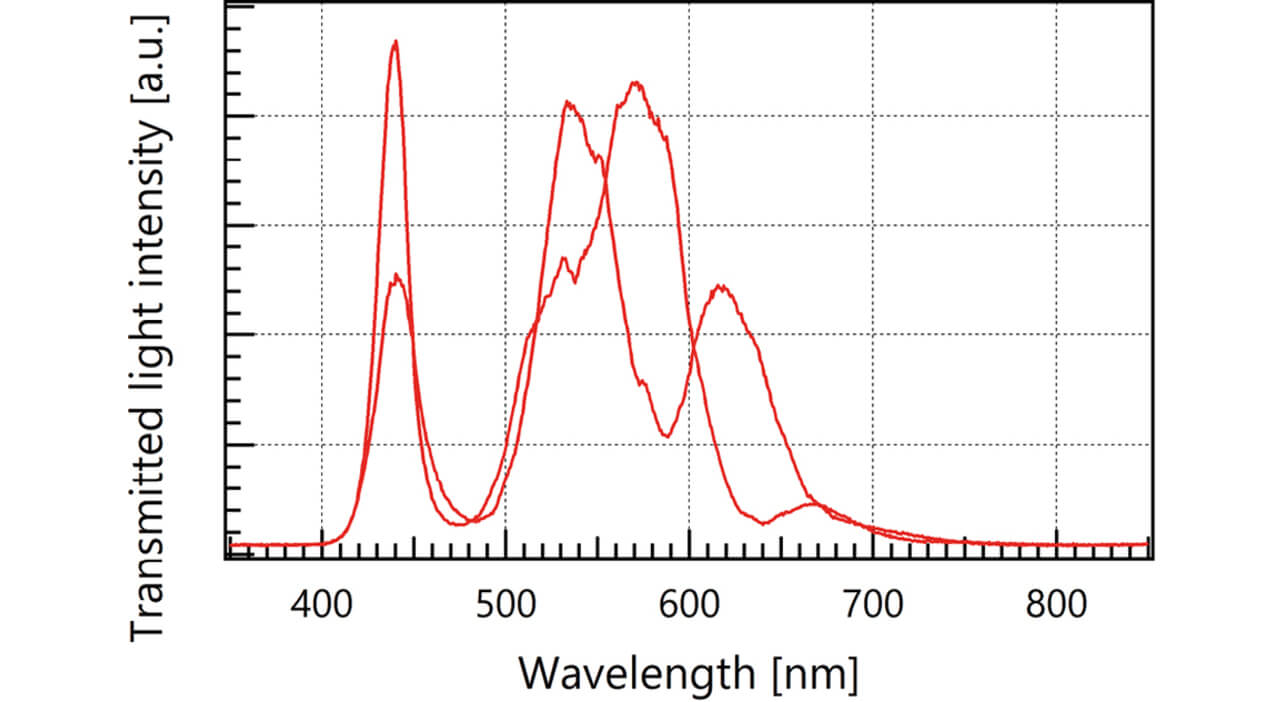
The shape that was not found in the optical spectrum of the white LED appears at a wavelength of around 500 to 650 nm, and the shape significantly differs between two output ports. The generation of the decrease in light intensity in the light source section and the wavelength dependence in the fiber coupler as shown above causes problems that sufficient signal intensity cannot be obtained by CMOS of the spectroscope, and the measured values become unstable.
3. Developed technology
We tackled the following two technologies to solve the problems of a decrease in light intensity and wavelength dependence in the fiber coupler generated by a reduction in the core diameter:
- (i)
- Increasing luminance of light source using a laser-pumped fiber light source
- (ii)
- Elimination of wavelength dependence using an optical filter coupler for the visible range
This paper explains these technologies.
3.1 Laser-pumped fiber light source
A white light source with high luminescence in which phosphor is excited by a blue laser diode (LD) with luminescence higher than an LED is disclosed confronting a white LED excited by a blue LED5). Resin in which the phosphor is dispersed with a filler for making the light diffuse is molded. Sufficient diffusion of light allows the blue color of excited light and the fluorescent light color of phosphor to be homogeneously mixed to provide white illumination. However, since diffused phosphor makes both the light-condensing spot of a blue LD and the fluorescent light emitting spot shade off, the efficiency was low when incorporating into optical fiber.
Therefore, we designed the optical fiber light source with high luminescence using single crystal phosphor. Fig. 8 shows its configuration.
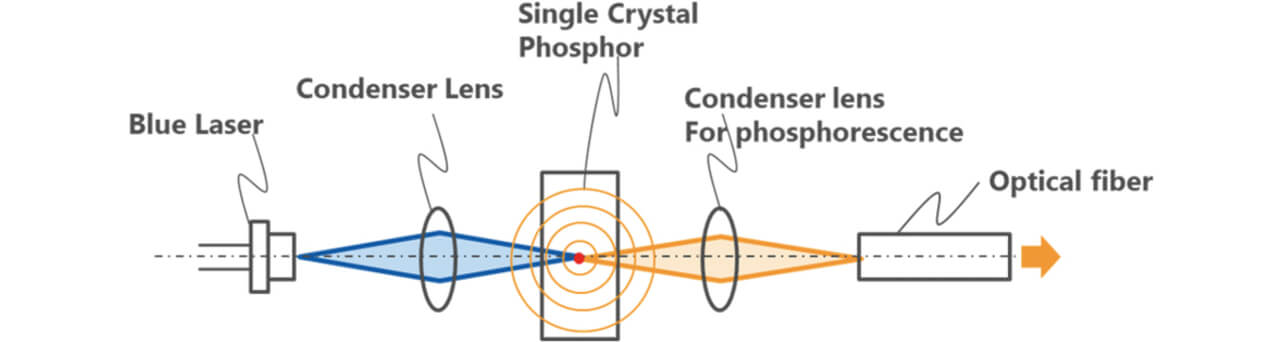
Light is condensed to single crystal phosphor by a condenser lens. Single crystal phosphor that was cut out in a plate shape from a single crystal ingot of YAG added with Ce grown by the Czochralski method that is also used for manufacturing silicon wafers was used. Although phosphor is generally crushed, mixed in resin, and molded hereinafter, it becomes phosphor with translucency not diffusing light when it is used as the plate state. Since light is not diffused in single crystal phosphor with translucency, blue excitation light can be focused inside the phosphor. In a single crystal, fluorescent light is emitted from the part irradiated by propagating blue excitation light. Fluorescent light has an almost cylindrical shape with a waist as shown in Fig. 9.
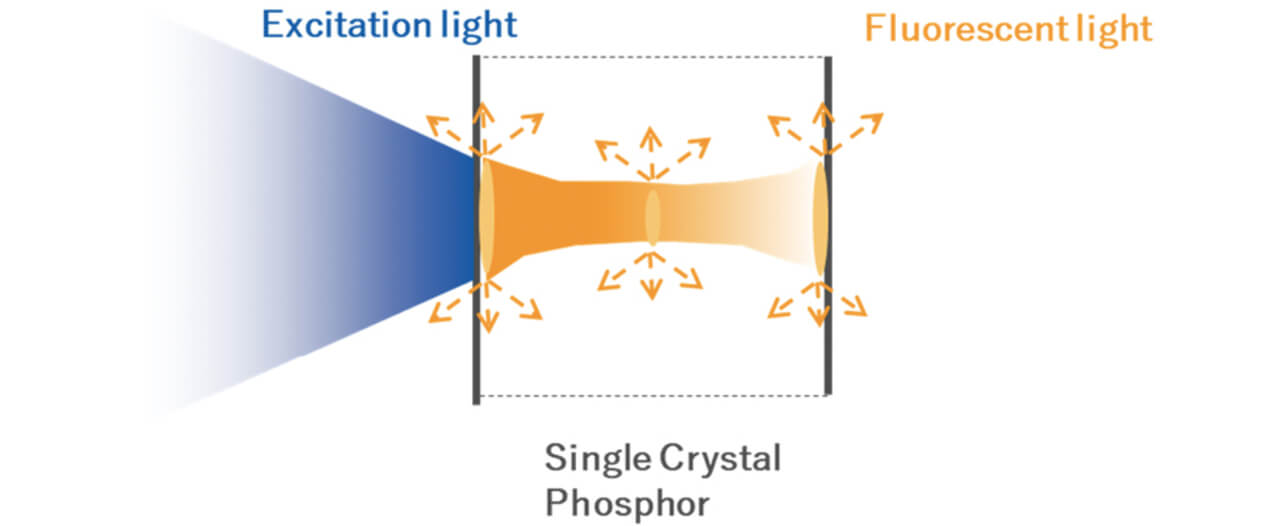
Fluorescent light from an almost cylindrical fluorescent light part is introduced to optical fiber by a condenser lens for phosphor. The use of single crystal phosphor can form a fine phosphor part without diffusing both the excitation light and fluorescent light and can incorporate into optical fiber efficiently.
3.2 Optical filter coupler for visible light
In optical communication, there is an optical filter coupler that selectively takes out and couples light with a specific wavelength in the middle of optical fiber6). This is the coupler in which graded-index lenses are installed to the ends of two and one optical fibers and the optical filter made of multilayer dielectric film is arranged in the gap between these. Since it is hardly affected by the propagation mode like the fused fiber coupler, it is adaptable to a wide range of wavelengths depending on the filter. However, there was only coupler for near infrared light, but there was no coupler for visible light. Therefore, we newly introduced an optical filter coupler provided with a half mirror for the visible range to the filter part for this sensor. Fig. 10 shows its configuration.
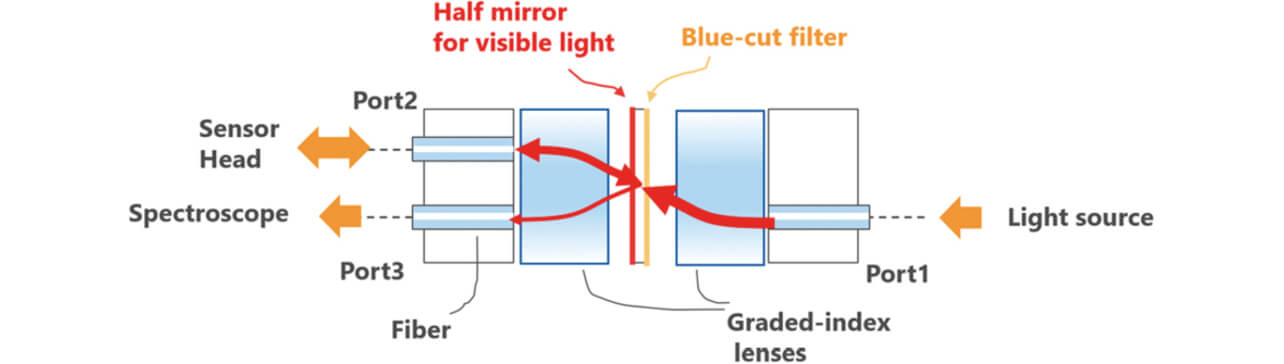
The light introduced from the light source of a chromatic confocal displacement sensor enters from Port 1, passes through the graded-index lenses, is transmitted through the half mirror for visible range, and is introduced to the optical fiber of Port 2 by the second lens. Port 2 is connected to the sensor head, the reflected light returned from the sensor head is reflected by the half mirror for visible range via the lens from Port 2 and is introduced to the optical fiber of Port 3 connected to the spectroscope by the same lens. In addition, a blue cut filter is deposited on the opposite side of the part where the half mirror for the visible range was deposited. The purpose is to prevent a blue laser from being emitted from the sensor head when the phosphor inside the laser-pumped light source is damaged.
This optical filter coupler for the visible range enables even the optical fiber with a core diameter of φ10 μm to realize a coupler with low wavelength dependence.
4. Verification of effect
The effects of two developed technologies are shown in 4.1 and 4.2, the effect of improving the thickness resolution by using these in 4.3, and the results of measurement of actual thin transparent materials in 4.4.
4.1 Increasing luminance of laser-pumped fiber light source
The optical spectra of light outputted from the optical fiber between the laser-pumped fiber light source and the conventional white LED were compared. Both optical fibers used had a core diameter of φ50 μm, and the white LED loaded to our chromatic confocal displacement sensor ZW-CE was used for comparison. In addition, both the electric current to be injected to blue laser and the one to be injected to the white LED were set at limited values according to the product specification. The obtained optical spectra are shown in Fig. 11.
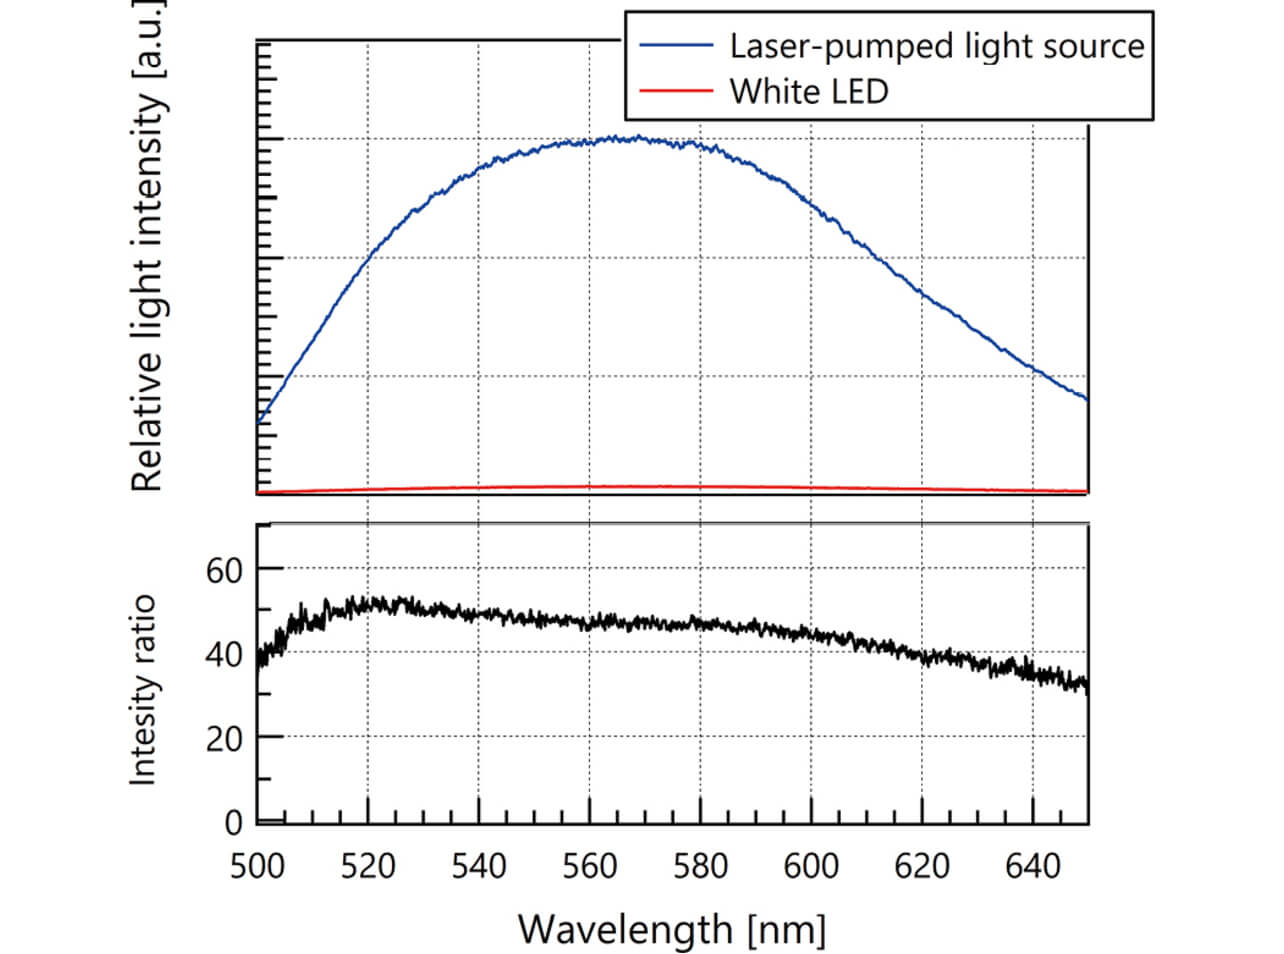
It is found that the light intensity of 30 times or more was obtained in any wavelength from 500 to 650 nm.
4.2 Reduction of wavelength dependence by optical filter coupler
Two transmission spectra when the light of the white LED is branched to each of the optical filter coupler for visible range and the fusion stretching type fiber coupler made with core diameter of φ10 μm are shown in Fig. 12.
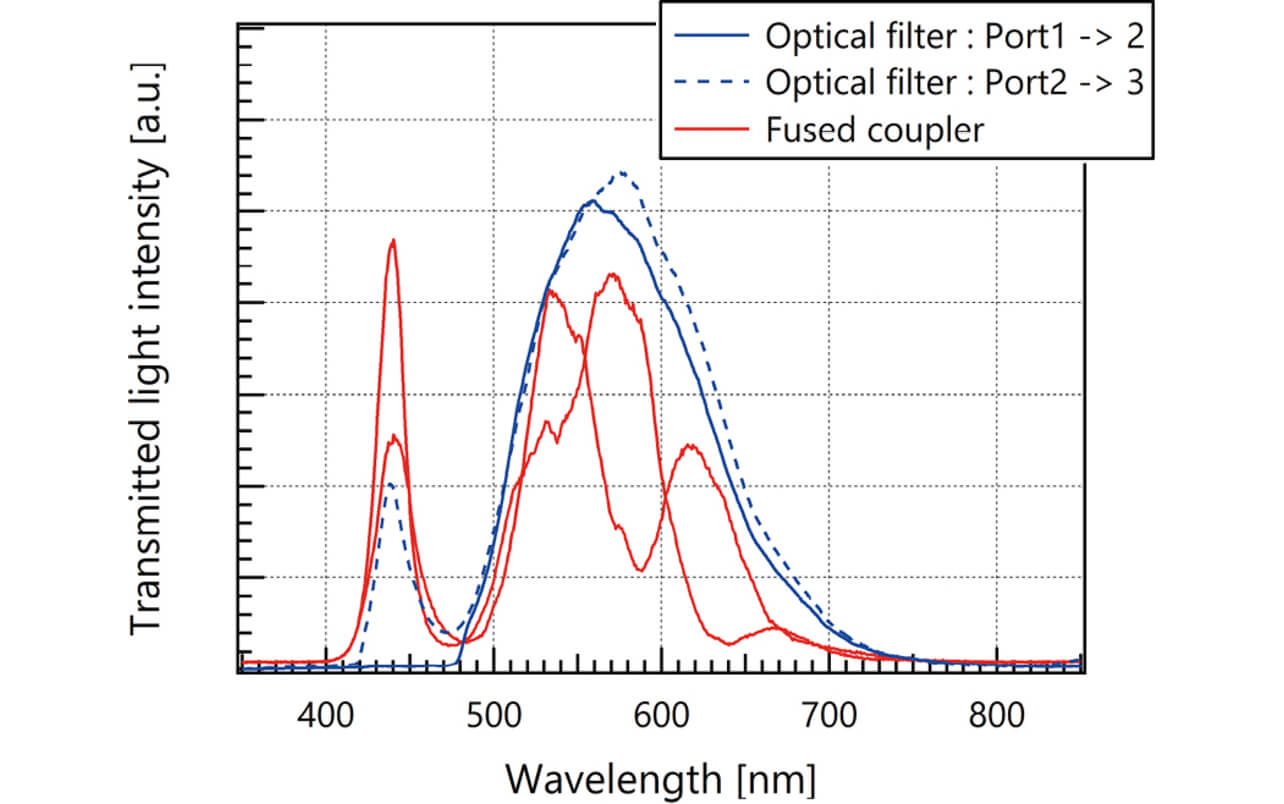
It is found that the optical filter coupler for the visible range made the transmission spectrum in the range of 500 to 650 nm smoother than that of the fusion stretching type, and the difference between the two branched transmission spectra was reduced.
4.3 Improvement of thickness resolution
The chromatic confocal displacement sensor with a core diameter of φ10 μm was built using the laser-pumped fiber light source and the optical filter coupler for the visible range to compare the received light waveform between this sensor and our chromatic confocal displacement sensor with a core diameter of φ50 μm ZW-S5010. Both sensor heads used were of the same optical system of axial chromatic aberration. The received light waveforms when the mirror was measured are shown in Fig. 13.
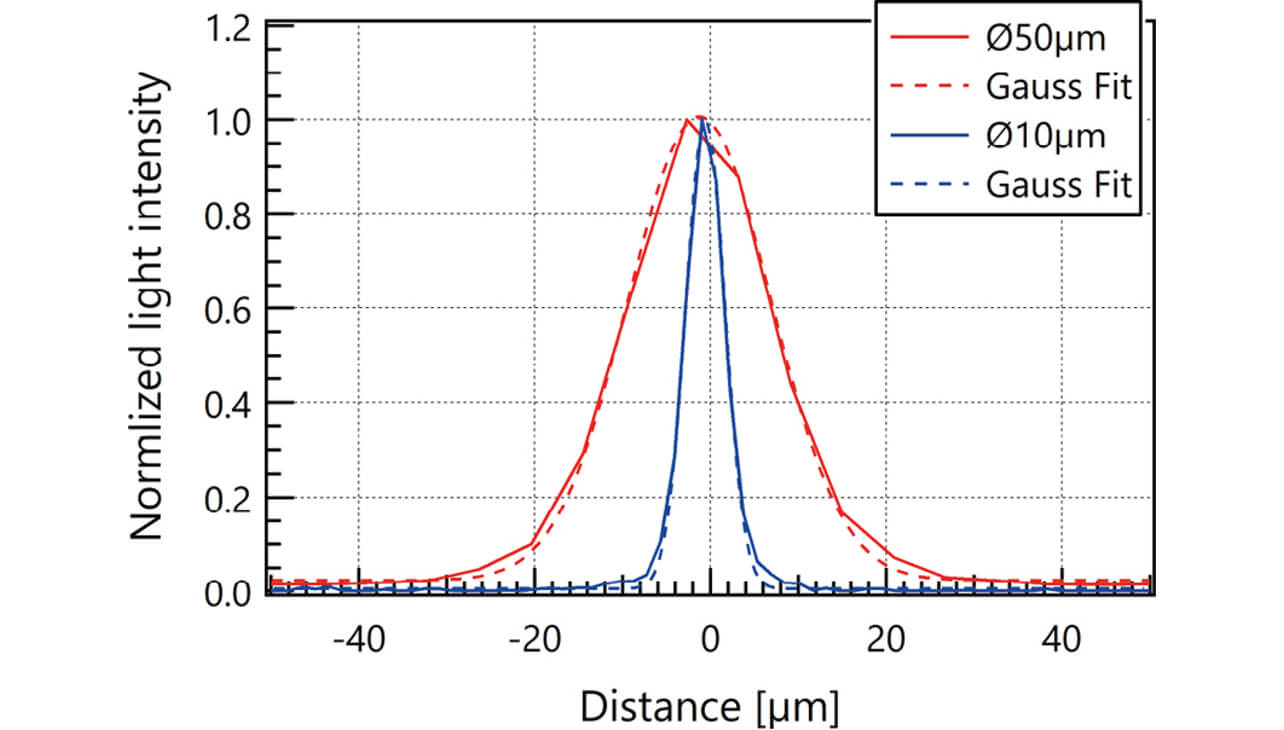
Horizontal axis represents distance (displacement) and was calculated based on the axial chromatic aberration and the wavelength of the spectroscope. The values of the vertical axis were normalized by the maximum value of each received light waveform so as to facilitate a comparison. The obtained received light waveform was subjected to the Gaussian function fitting to obtain FWHM for the mirror. Furthermore, in order to evaluate the effect of the difference in materials, the glass surface and stainless steel, in addition to the mirror, were measured. The summary of the results is shown in Table 1.
| Before improvement (φ50 μm dia.) |
After improvement (φ10 μm dia.) |
||
|---|---|---|---|
| Full width at half maximum | Mirror | 19.1 μm | 5.2 μm |
| Glass surface | 19.2 μm | 5.2 μm | |
| Stainless steel | 19.0 μm | 5.2 μm | |
| Thickness resolution for transparent material (n = 1.5) | 32.6 μm | 8.8 μm | |
It is found that FWHM was improved regardless of the material of the object. The thickness resolution in the transparent material with the refractive index n = 1.5 was obtained from the acquired maximum value of FWHM. A possibility was found that the thickness resolution is improved by 3.7 times by the adoption of a core diameter φ10 μm, and the thickness of the transparent film up to 8.8 μm can be measured.
4.4 Actual measurement of thin transparent materials
Thin transparent materials were actually measured using the built chromatic confocal displacement sensor with a core diameter of φ10 μm, and our chromatic confocal displacement sensor with a core diameter of φ50 μm ZW-S5010. Glass with a thickness of 30 μm, polyethylene (PE) film with a thickness of 30μm and 15 μm were measured as thin transparent materials. Fig. 14 shows their received light waveforms.
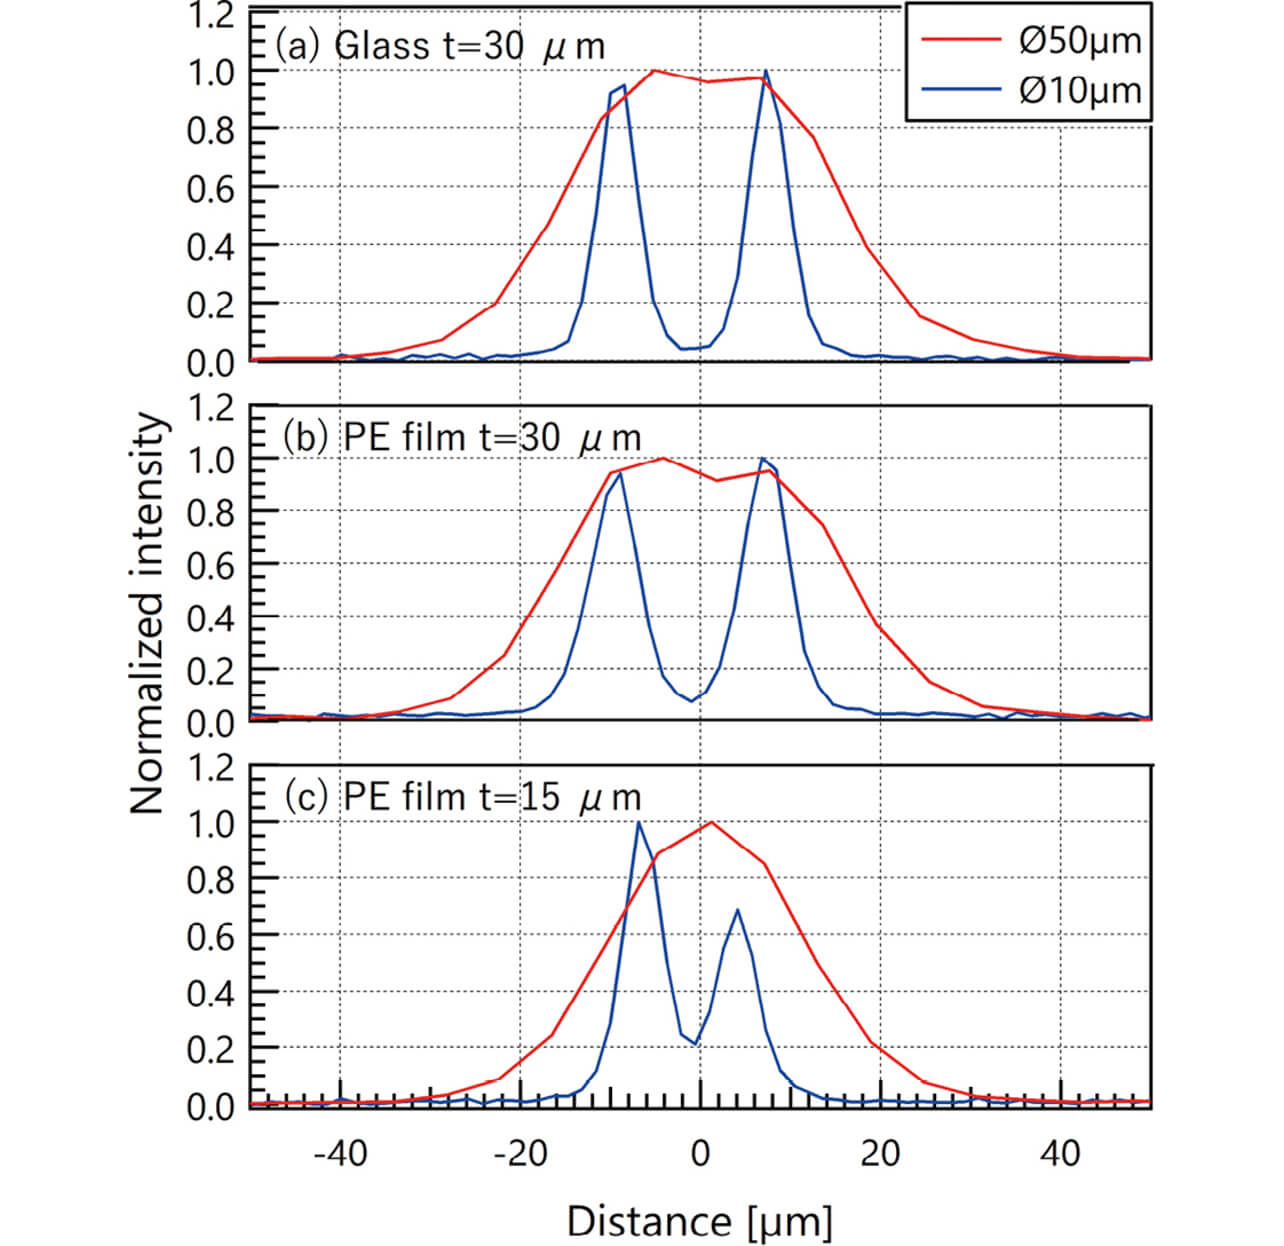
The improvement of the thickness resolution by the adaption of a core diameter of φ10 μm was recognized for both materials of glass and PE film from Figs. 14 (a) and (b). Furthermore, in the case of a core diameter of φ10 μm, the depression by 19% or more was recognized at the peak of the received light waveform, and the thickness resolution for transparent film with a thickness of 15 μm was found by the actual measurement from Fig. 14 (c).
In addition, PE film with a thickness of 15 μm was measured by inclining the sensor head of the chromatic confocal displacement sensor with a core diameter of φ10 μm. It was measured by inclining at angles of 5┬░, 10┬░, and 15┬░ assuming the angle confronting the film to be θ ’╝Ø0┬░. The measured received light waveforms are shown in Fig. 15.
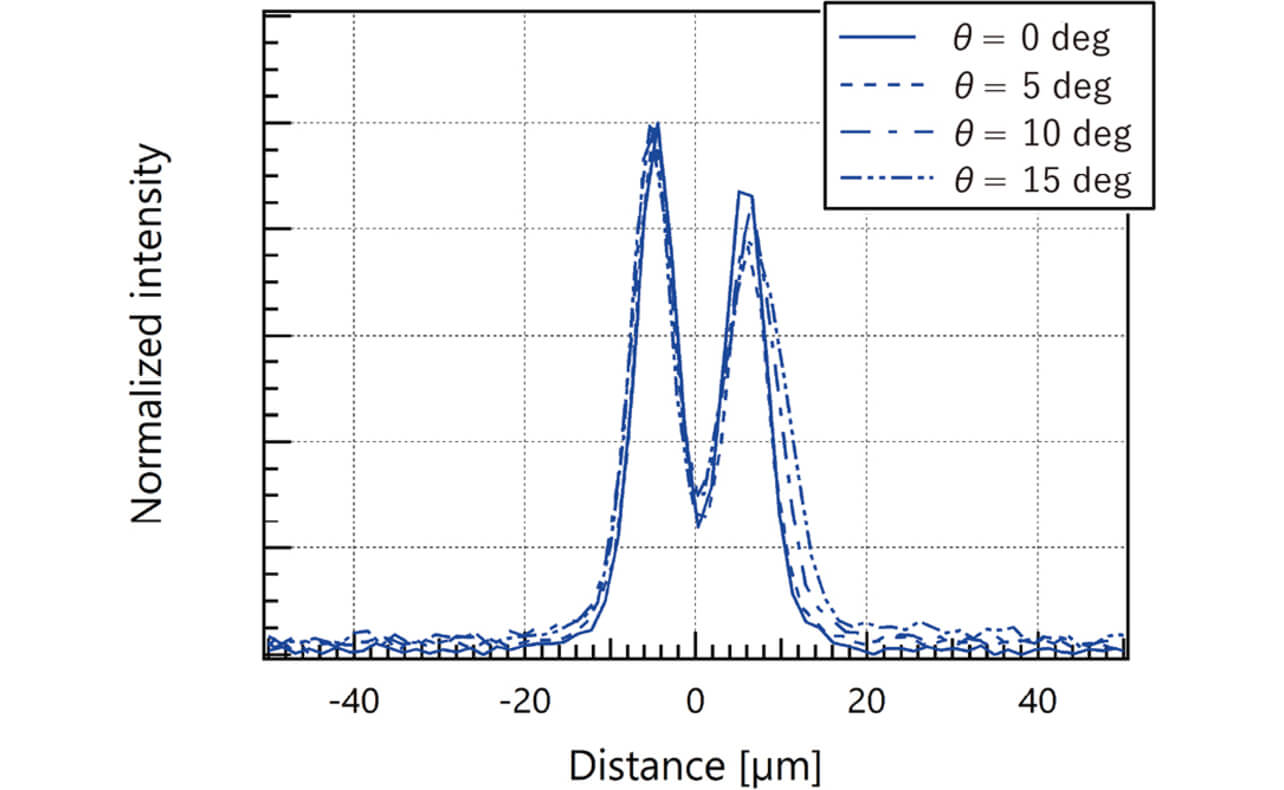
It is found that the thickness resolution for transparent material with thickness of 15 μm is maintained even if the sensor is inclined at 15┬░.
5. Conclusions
The improvement in the thickness resolution of a chromatic confocal displacement sensor was performed using the optical fiber with a core diameter of φ10 μm toward the realization of the thickness measurement of transparent raw materials, such as thin glass sheet and film. The problems of the decrease in light intensity due to the reduction in the core diameter and the wavelength dependence of the fiber coupler were overcame by applying the laser-pumped fiber light source and the optical filter coupler for the visible range, respectively. Consequently, the thickness resolution was improved so as to enable the measurement of transparent material with the thickness as small as 15 μm.
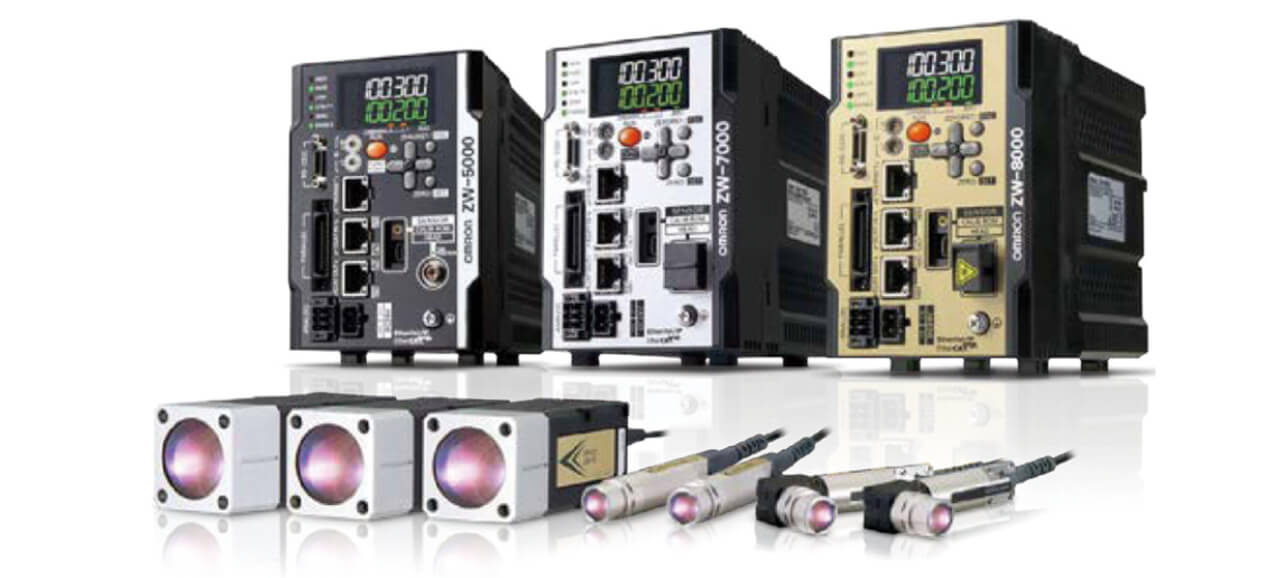
The displacement sensor ZW-8000 Series utilizing this technology (Fig. 16) was released as a product on April 20187).
In the measurement of the thickness of glass and film, this sensor is expected to contribute to the saving of time and effort during installation adjustments and the conquest of unstable measurements due to fluttering and wrinkling during transport. In addition, a decrease in the core diameter made the focal spot on the object smaller. We believe that it enabled the inspection of parts smaller than those in the past and widely contributed to maintaining the product quality in high-level manufacturing.
We intend to promote high precision, speeding-up, and multipoint simultaneous measuring in order to respond to the needs of customers, such as the miniaturization of parts, and the increase in inspection points based on these technologies.
References
- 1’╝ē
- J. Takashima, T. Okuda, H. Morino, and M. Hayakawa, ŌĆ£Displacement sensor technology evolving by following the change in manufacturing site,ŌĆØ (in Japanese), OMRON TECHNICS, vol. 51, pp. 10-15, 2018.
- 2’╝ē
- Nippon Electric Glass, ŌĆ£Successful development of worldŌĆÖs thinnest glass for cover glass of foldable display,ŌĆØ (in Japanese), NewsRelease. 2020-7-21, https://www.neg.co.jp/uploads/news_20200721_jp.pdf (accessed May. 26, 2022).
- 3’╝ē
- T. Namioka, ŌĆ£Spectroscopic instrument Lecture 3 Optics concerning spectroscope,ŌĆØ (in Japanese), https://www.jstage.jst.go.jp/article/bunkou1951/19/3/19_3_127/_pdf/-char/ja (accessed May. 26, 2022).
- 4’╝ē
- N. Kawakami, ŌĆ£Optical fiber coupler,ŌĆØ (in Japanese), New Glass, vol. 6, pp. 48-59, 1991. https://www.newglass.jp/mag/TITL/maghtml/20-pdf/+20-p048.pdf (accessed May. 26, 2022).
- 5’╝ē
- Nichia Corporation. ŌĆ£Luminescence device,ŌĆØ (in Japanese), JP2006-173324A, Jun. 29, 2006.
- 6’╝ē
- H. Kanamori, ŌĆ£Optical passive parts supporting FTTH,ŌĆØ (in Japanese), SEI Technical Review, no. 179, pp. 17-24, 2011. https://sei.co.jp/technology/tr/bn179/pdf/sei10675.pdf (accessed May. 26, 2022).
- 7’╝ē
- OMRON Corporation, ŌĆ£ZW-8000/7000/5000 Series Optical Fiber Coaxial Displacement Sensors/ Advantage | OMRON control devices,ŌĆØ (in Japanese), https://www.fa.omron.co.jp/products/family/3500/feature.html (accessed May. 26, 2022).
The names of products in the text may be trademarks of each company.