A Case Study of Real-Time Screw Tightening Anomaly Detection by Machine Learning Using Real-Time Processable Features
- AI Technology
- Real-time anomaly detection
- Screw tightening
- Automation
- PLC
The replacement of human work with AI has been promoted in recent years because the labor shortage in the manufacturing industry has become remarkable1). In particular, anomaly detection by AI image inspection has come to be used. On the other hand, image inspection cannot detect abnormalities, such as insufficient axial force, in screw tightening due to the lack of difference in appearance. In this paper, we propose a method to detect screw tightening bottoming defects in real time as similar workers feel the difference during tightening by using the data collected from the AC servo system during the operation. Anomalies should be detected in real time, at least until the next work is started to reduce unnecessary processes in the factory. To achieve that, our proposed method uses OmronŌĆÖs AI machine automation controller2-5). Experimental results show our proposed method is effective even for 0.04 mm bottom-touch defects, which are difficult to detect by conventional methods.
1. Introduction
In recent years, a massive labor shortage has been felt across the manufacturing industry and further exacerbated due to the COVID-19 pandemic. Accordingly, AI technologies have been introduced worldwide to perform formerly human-dependent tasks. Among well-known cases of successfully applied AI technologies is image recognition, which is also used in the manufacturing industry for visual inspection1).
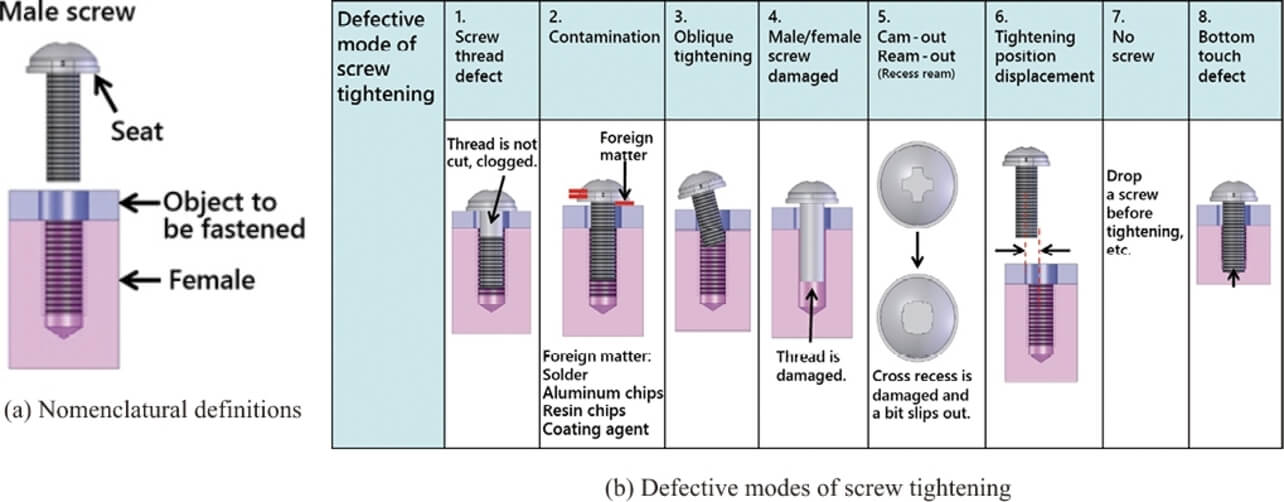
Image recognition can detect various defects, including omitted, ill-soldered, scratched, or contaminated parts. However, some defects are difficult to detect. A typical example is insufficient axial forces in screw tightening. An axial force clamps an object to be fastened between the a male screw seat and a joint. Its failure to meet the required value results in a screw-tightening defect. Insufficient axial forces in screw tightening are hard to detect accurately by image-based inspection. It is also difficult to subsequently make a nondestructive measurement of the axial force.
Skilled workers could rely on the feel of tightening to tell to some extent whether the tightening into a joint is normal. This method, however, would result in human-dependent quality variations.
A robot-based automated screw-tightening process capable of sensing differences in the feel would solve labor shortages and reduce human-dependent quality variations. The problem is, however, how to replace this anomaly detection method with an AI-based solution. Proposals based on conventional methods have been made, such as using the torque value for screw turn control6-8) but can only detect limited types of defect modes. No established technology exists yet for our purpose.
We propose a method of detecting screw-tightening defects in the automatic screw-tightening unit with its programmable logic controller (hereinafter ŌĆ£PLCŌĆØ) without using externally installed devices, such as sensors. For the AI technology engine, we adopted an AI controller2-5) available in OMRONŌĆÖs product lineup. Test results are presented below to demonstrate that our proposed method is effective for bottom-touch defects that are particularly hard to detect.
2. Screw-tightening unit and screw-tightening defects
2.1 Configuration of the screw-tightening unit
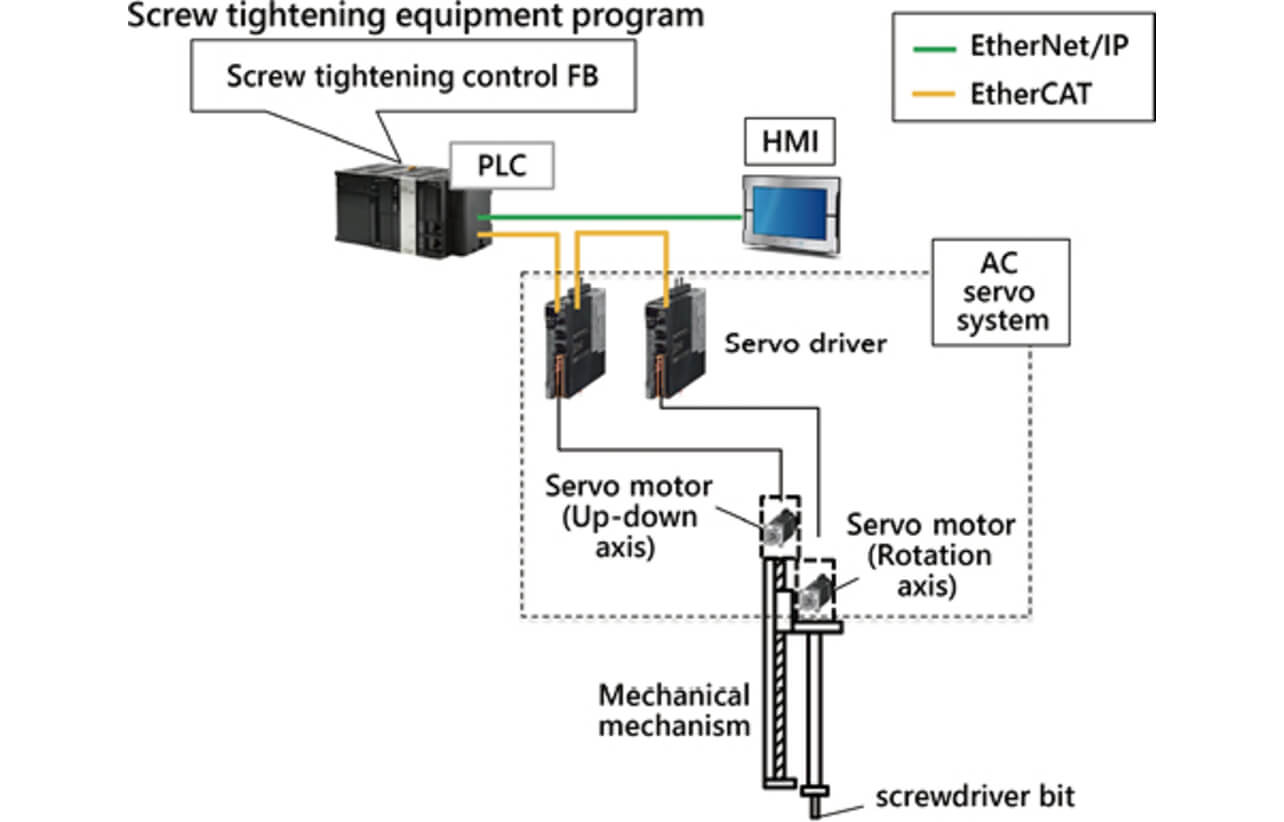
Fig. 1 shows the configuration of a typical automatic screw-tightening unit assumed here. The main components are as follows:
- Screw-tightening control function block (hereinafter ŌĆ£screw-tightening control FBŌĆØ): a PLC program for screw-tightening control
- Human-machine interface (hereinafter HMI): a display unit for setting up the screw-tightening action
- PLC: a control unit that performs screw-tightening control via the screw-tightening control FB
- AC servo system: a servo mechanism that constitutes the up-down axis (Z-axis) and the rotation axis (R-axis), which follow commands from the PLC
- Mechanical mechanism: a mechanism that automates the screw-tightening operation using the screw-tightening action (rotating action) and the screw push-hold action (descending action) via the AC servo system.
2.2 Screw-tightening control
This subsection explains the screw-tightening control using the screw-tightening control FB.
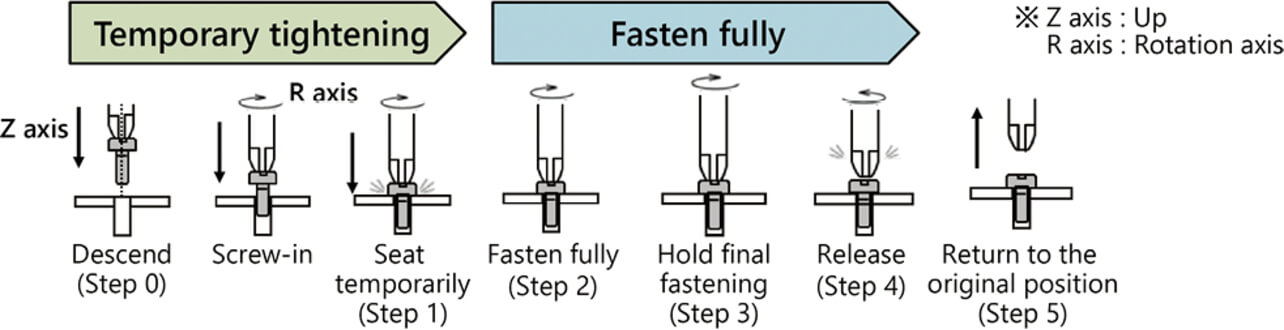
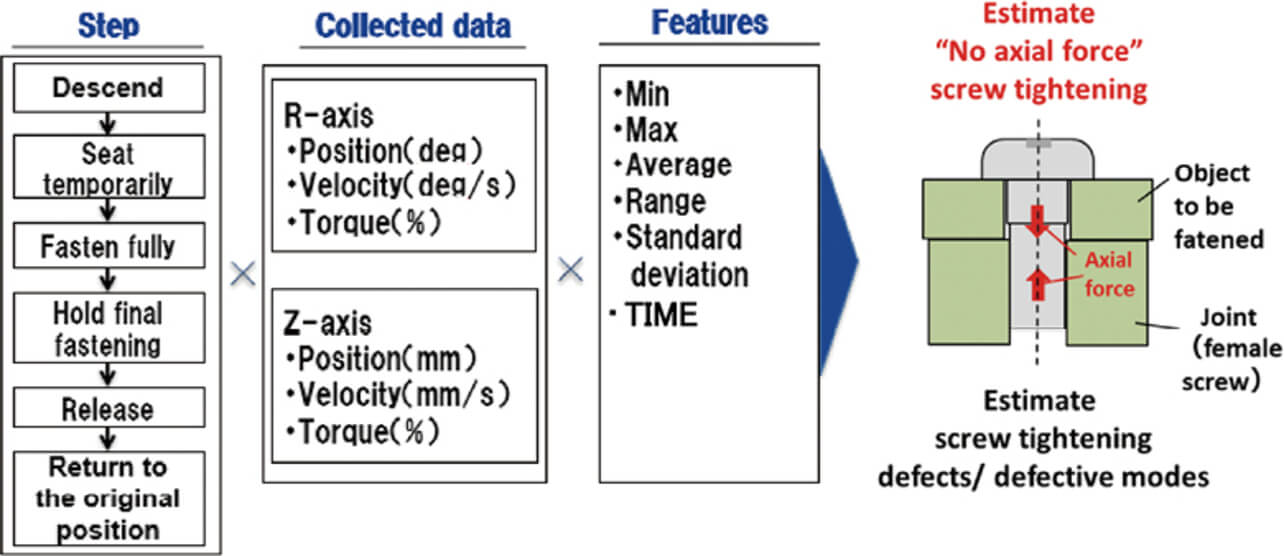
The screw-tightening control FB uses the screw-tightening control steps in Fig. 2 to perform screw-tightening control.
- Step 0 (Descend): Position the Z-axis on the workpiece.
- Step 1 (Seat temporarily): Turn the R-axis to tighten the screw to the target temporary-tightening torque (until the male screw is seated).
- Step 2 (Fasten fully): Turn the R-axis to tighten the screw to the target full-tightening torque.
- Step 3 (Hold final fastening): Retain the R-axis at the target full-tightening torque.
- Step 4 (Release): Release the R-axis torque.
- Step 5 (Return to the original position): Return the Z-axis to the origin.
2.3 Screw-tightening defects
A screw-tightening anomaly is a condition in which the axial force is insufficient due to incomplete screw tightening.
Their causes fall largely into eight types. Fig. 3 and Table 1 show the definitions and descriptions of the eight defective modes of screw tightening:
| Defective mode | Descriptions | Conventional detection method | |
|---|---|---|---|
| (1) Screw thread defect | A defect involving a screw used with uncut or clogged threads. | R-axis rotation load | |
| (2) Contamination | A defect involving solder or other foreign matter trapped between a male screw seat and an object to be fastened. | R-axis rotation load | |
| (3) Oblique tightening | A defect involving a male screw obliquely tightened into the female threads. | R-axis position | |
| (4) Male/female screw damaged | A defect involving a screw used with stripped threads. | Z-axis position | |
| (5) Cam-out/ream-out | A defect involving a male screw with a damaged cross recess, from which the driver bit slips out. | Z-axis position | |
| (6) Tightening position displacement | A defect involving a male screw with its center misaligned to that of the female threads. | Z-axis position | |
| (7) No screw | A defect involving failure to hold a male screw on the driver bit due to feeding/suction failure. | Z-axis velocity | |
| (8) Bottom-touch defect | A defect involving a male screw tip coming into contact with the bottom of the female threads. | Large lift | Z-axis position |
| Small lift | N/A | ||
2.4 Challenges to screw-tightening defect detection
All the defective modes of screw tightening listed in Subsection 2.3, other than bottom-touch, can be detected by conventional threshold determination based on Z- and R-axis position and velocity data collected from the servos6-8) as shown in Table 1.
However, no established method exists for detecting bottom-touch defects with slight lifting after screw tightening. The reason is that such bottom-touch defects occur, which cause no torque differences with no visible anomalies, such as foreign matter, during screw tightening, and slight lifting is difficult to detect visually with accuracy. We propose a method of detecting bottom-touch defects with slight lifting.
3. Our proposed method
We propose a determination system based on machine learning using an AI controller to detect in real-time bottom-touch defects with slight lifting and other anomalies difficult to detect by conventional threshold determination. The AI controller can perform AI processing on the order of microseconds. Using data collected from the AC servo system during a screw-tightening action by the screw-tightening unit, the AI controller can extract feature quantities and detect a screw-tightening defect during the time from the end of the current screw-tightening action to the beginning of the next.
3.1 System configuration
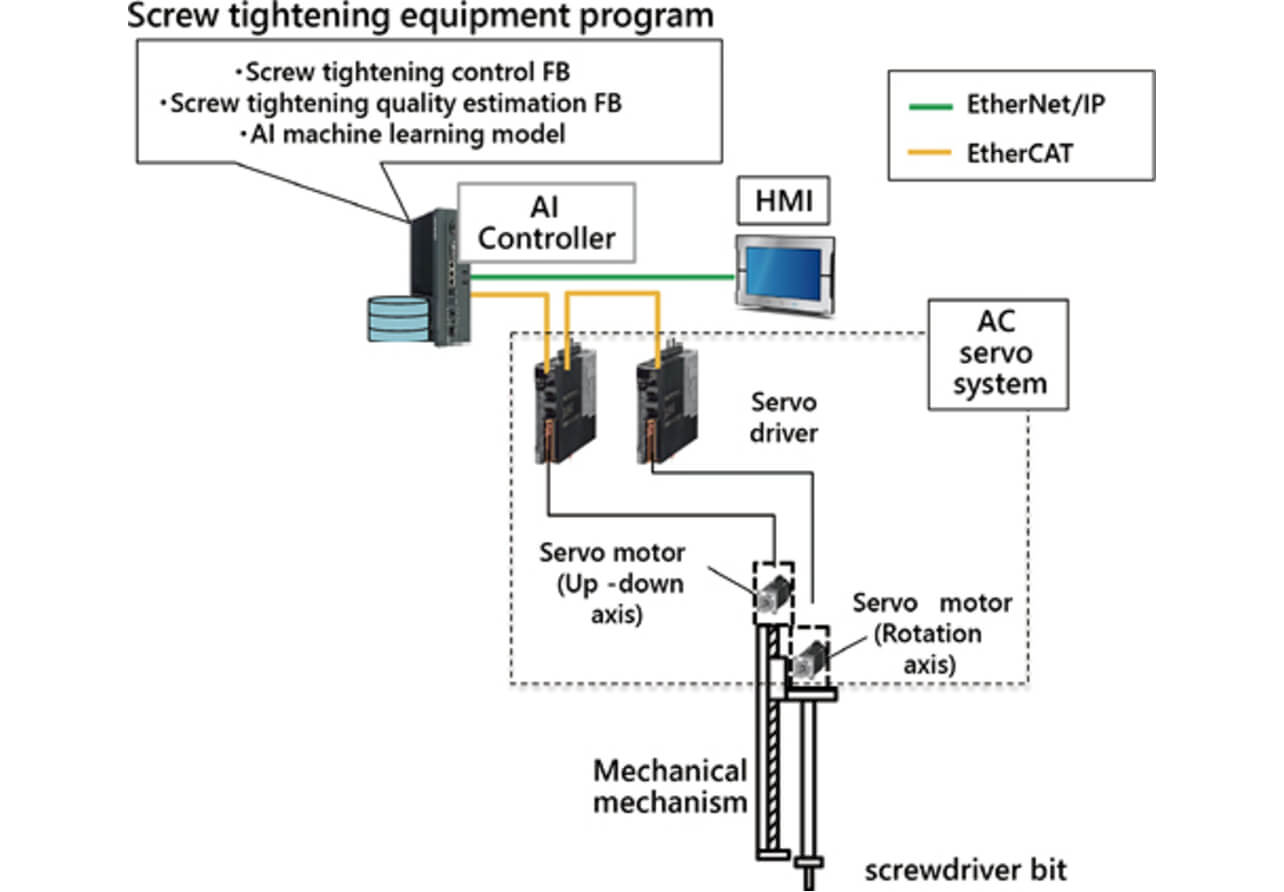
Our proposed system is expanded from the configuration in Fig. 1 with the addition of the following extra components as shown in Fig. 4:
- AI controller: a PLC featuring a real-time anomaly detection function based on Isolation Forest9), an outlier detection algorithm for machine learning
- Screw-tightening quality estimation function block (hereinafter ŌĆ£screw-tightening quality estimation FBŌĆØ): a PLC program for determining screw-tightening anomalies from data collected from the AC servo system based on an AI machine learning model
- AI machine learning model: a machine learning model built by the Isolation Forest algorithm from learning data collected in the past
3.2 Development of the AI machine learning model
The AI machine learning model is intended to tell apart properly and improperly tightened screws. This model is built based on data collected by the procedure given below. Isolation Forest, which we used to build the AI machine learning model, is an unsupervised learning algorithm.
(1) Learning data collection
Position, velocity, and torque data at the time of screw tightening are collected as learning data, respectively, from the R- and Z-axis servos controlled by the AI controller of the screw-tightening unit. Incidentally, our machine learning method uses normal data only as the learning data for building the learning model.
(2) Feature quantity calculation
The feature quantities of each step (minimum, maximum, mean, range, standard deviation, and time) are calculated from the collected data. The range in the sense here is a value defined as |maximum valueŌłÆminimum value |. As shown in Fig. 5, the total number of feature quantities is calculated as the number of steps times the number of data items times the number of types of feature quantities.
(3) Feature quantity selection
The total number of feature quantities is a huge number obtained as the number of steps times the number of data items times the number of types of feature quantities. Screening is required to narrow down all the available feature quantities to those useful for detecting target defects limited in number. We performed feature quantity selection using decision tree analysis9-10) and logistic regression analysis9-10), the same methods as in Reference (5). The feature quantity selection here is data analysis method-dependent; hence, the feature quantities thus selected may be physically inconsistent. Therefore, selected feature quantities must be evaluated for adequacy from physical points of view.
(4) Creation of the AI machine learning model
The data of selected feature quantities are used for the Isolation Forest algorithm to build a tree structure as an AI machine learning model.
(5) Evaluation
AI scores indicating the degrees of anomaly calculated based on the built AI machine learning model are evaluated for adequacy against newly collected normal and anomalous data.
4. Test results
4.1 Screw-tightening unit used for the test
Fig. 6 and Table 2 show the configuration and main components for the screw-tightening unit used for the test.
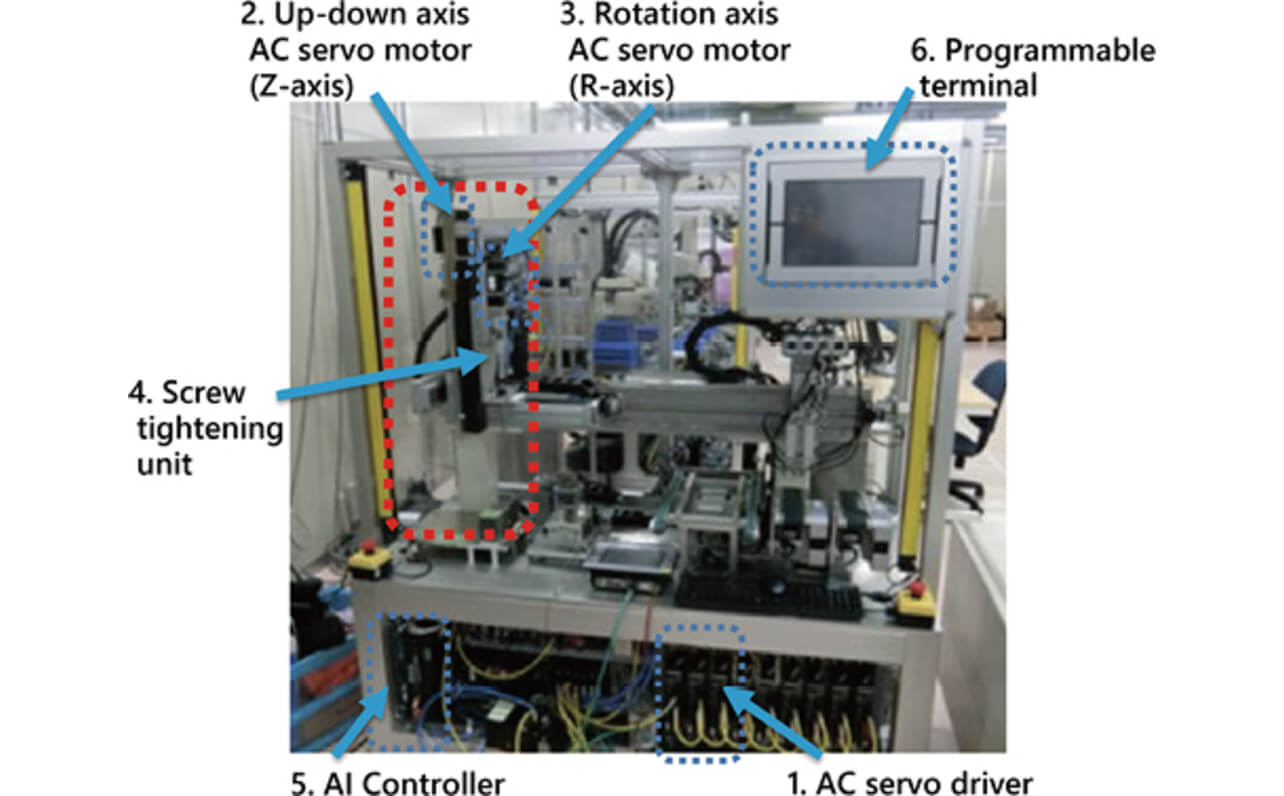
| No. | Product name | Model | Qty | Remarks | |
|---|---|---|---|---|---|
| 1 | AC Servo System 1S Series AC Servo Driver (100 V, 100 W) | R88D-1SN01L-ECT | 2 | R/Z-axis | |
| 2 | AC Servo System 1S Series AC Servomotor (100 W, without brake) | R88M-1M10030S-S2 | 1 | R-axis | |
| 3 | AC Servo System 1S Series AC Servomotor (100 W, with brake) | R88M-1M10030S-BS2 | 1 | Z-axis | |
| 4 | Screw-Tightening Unit | Reduction gear | AB042-003-S2-P2 | 1 | R-axis |
| Single-axis robot | KR30H06B-0220-0-10A0 | 1 | Z-axis | ||
| 5 | AI-equipped machine automation controller NY Series | NY512-Z300 | 1 | Controller | |
| 6 | NA Series Programmable Terminal with Seven-Inch Wide Screen Size | NA5-7W001S | 1 | HMI | |
4.2 Workpiece used for the test
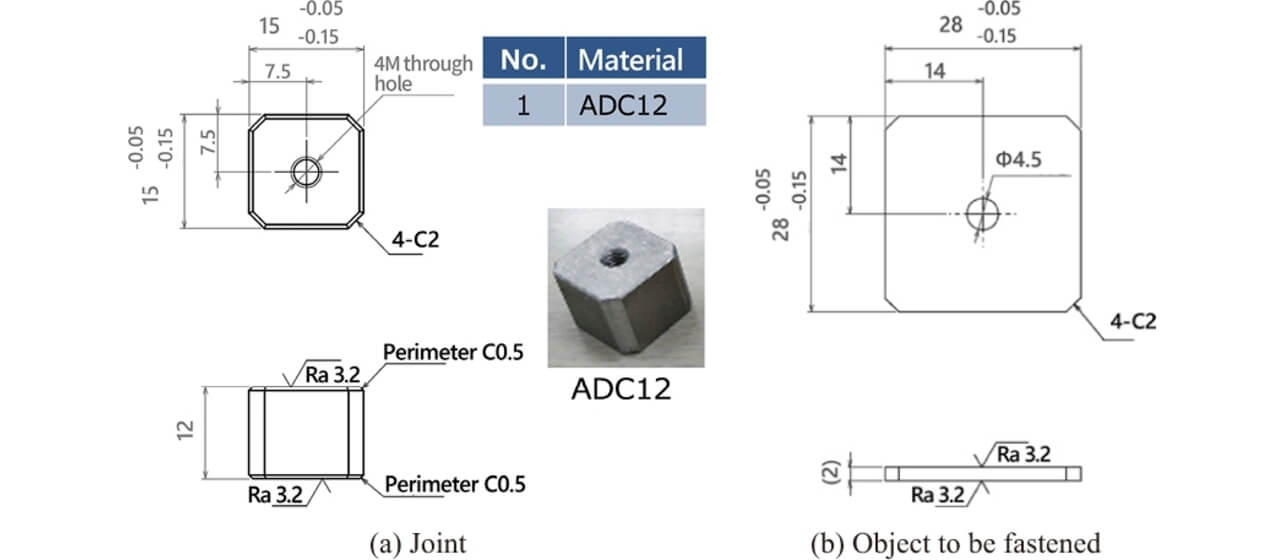
The male screw adopted was a 25 mm long M4 SEMS screw. The joint was made of ADC12, while the object to be fastened was a glass epoxy substrate. Their dimensions are shown in Fig. 7. Incidentally, this workpiece was selected as a typical combination from the screwable products available from the co-creation development partner for the present technology.
4.3 Learning data collection
We collected 300 pieces of normal data. Referring to Reference (9), we set appropriate data quantities for the Isolation Forest. Our machine-learning method generates a learning model from normal data only. We divided the 300 pieces of normal data into three random 100-piece sets, out of which we picked two 100-piece sets for use as learning data.
4.4 Reference data collection
Measured data for tightening axial force were collected as the reference data for evaluating later the machine learning model for adequacy. Axial force measurement methods include load cell-based methods, such as the one used for our test, and destructive inspections. Neither method allows data acquisition in real product manufacturing environments. Accordingly, the reference data must be collected beforehand using a testing workpiece.
To collect reference data, we placed a load cell between the object to be fastened and the joint to measure the axial force. The next subsection compares the axial force measurement data with the estimation results by the learning model.
4.5 Evaluation data collection
We collected 100 pieces of bottom-touch defect data as evaluation data. Of the normal data explained in Subsection 4.3, the 100-piece set of data having not been used as learning data was also used for the evaluation.
To reproduce the defective mode of bottom-touch as shown in Fig. 8, we used A5056 aluminum alloy set screws similar in material to the joint (ADC12) to assemble two types of joints for bottom-touch testing (0.2 mm and 0.5 mm bottom-touch defects), 50 pieces per type. The joints for the bottom-touch test were divided and used in two lots, Lot 1 (20 pieces) and Lot 2 (30 pieces). These bottom-touch dimensions are values experimentally determined to reproduce bottom-touch defects with 0 to 0.2 mm lifting that are hard to detect by conventional methods.
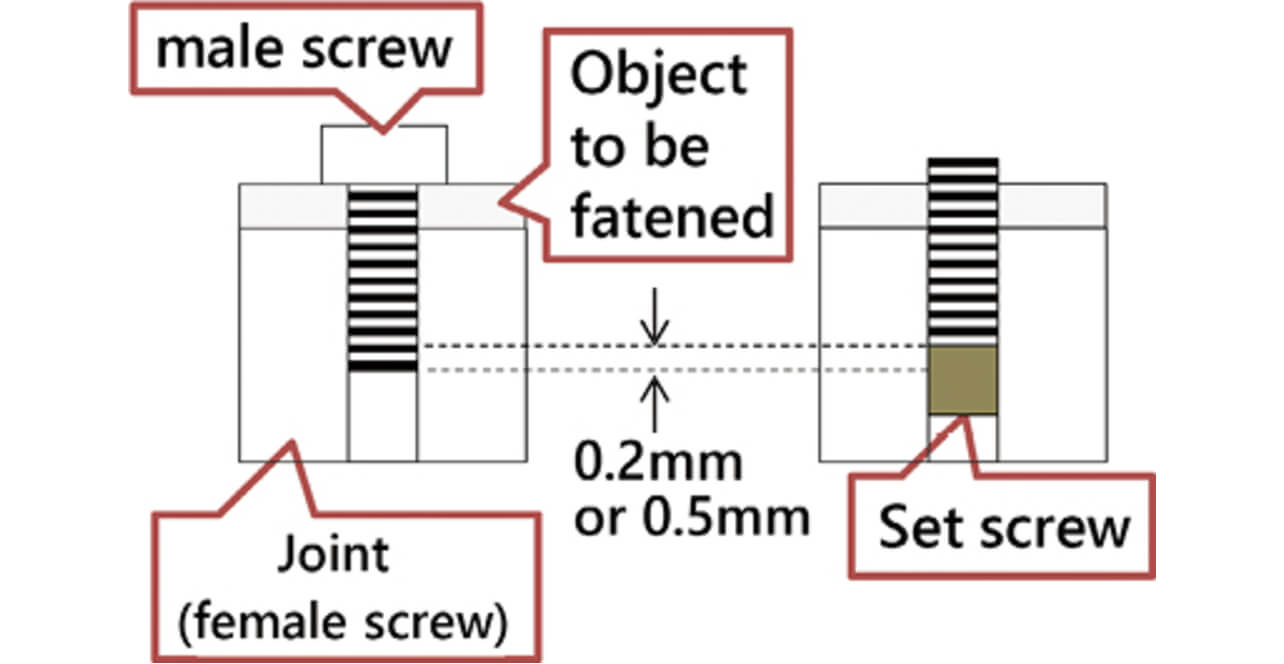
Each 0.2 mm bottom-touch defect was obtained by positioning the top surface of the set screw 0.2 mm above the tip of a normally tightened male screw. The 0.5 mm bottom-touch defects were obtained similarly by positioning the top surface of the set screw 0.5 mm above the tip of a normally tightened male screw. However, the bottom-touch defects thus obtained varied in dimensions. Hence, we measured the amount of gap occurring between the male screw seat and the object to be fastened after screw tightening.
4.6 Feature quantity calculation and feature quantity selection
Using the obtained learning/evaluation data, we calculated the feature quantities mentioned in 3.2(2) to perform feature quantity selection by the data analysis method described in 3.2(3). As a result, two feature quantities, the Z-axis position range in Step 2 and the R-axis position range in Step 4, were selected. Fig. 9 shows the learning/evaluation data distribution for the maximum values of the Z-axis position in Step 2 and the R-axis position in Step 4 and that for the Z-axis position range in Step 2 and the R-axis position range in Step 4. Outside the data plotting area is shown the density curve for each distribution.
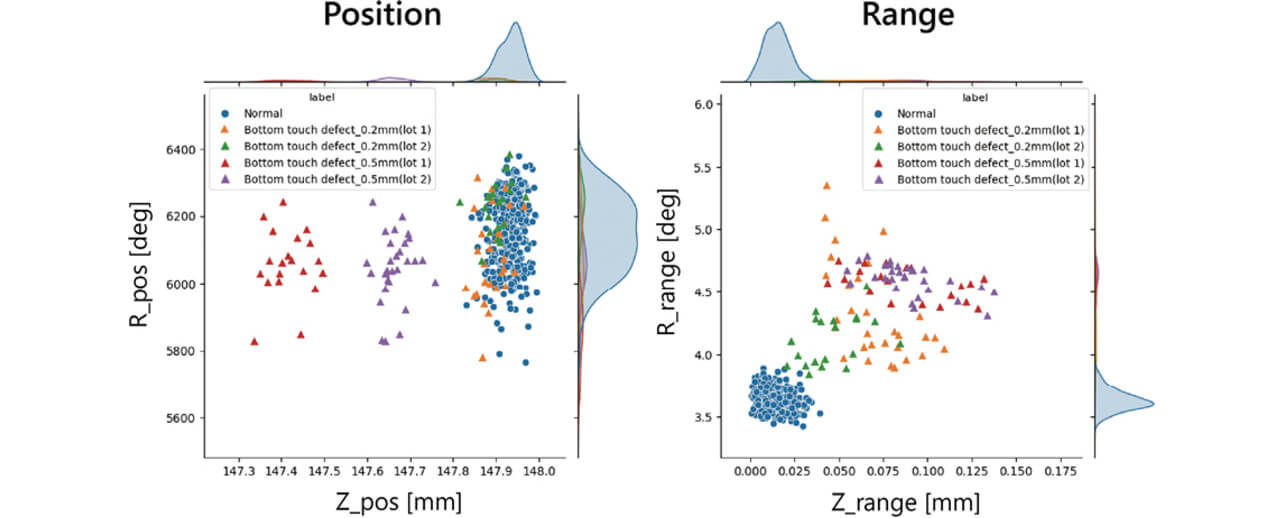
Regarding the R- and Z-axis position-based anomaly detection by the conventional method, the normal-data distribution indistinguishably overlaps the 0.2 mm bottom-touch defect data distribution as shown in the left pane of Fig. 9. Besides, the distribution of 0.5 mm bottom-touch defect data varies depending on the lot. Meanwhile, regarding the R- and Z-axis position range-based anomaly detection shown in the right pane, the normal-data distribution shows small variations and appears different from that of 0.2 mm bottom-touch defect data. The distribution of 0.5 mm bottom-touch defect data does not vary depending on the lot. These results are probably because the R- and Z-axis position ranges are relative values and remain unaffected, unlike the R- and Z-axis positions, which are absolute values and affected by variations due to such factors as differences in male screw length or joint height and individual differences between the lots.
The feature quantity selection was performed by a data analysis method. Hence, the physical consistency of feature quantities selected by the data analysis method is checked.
(1) Z-axis position at the occurrence of a bottom-touch defect
Fig. 10 shows the time-series plot for screw tightening performed normally and that for screw tightening performed with a 0.50 mm bottom-touch defect.
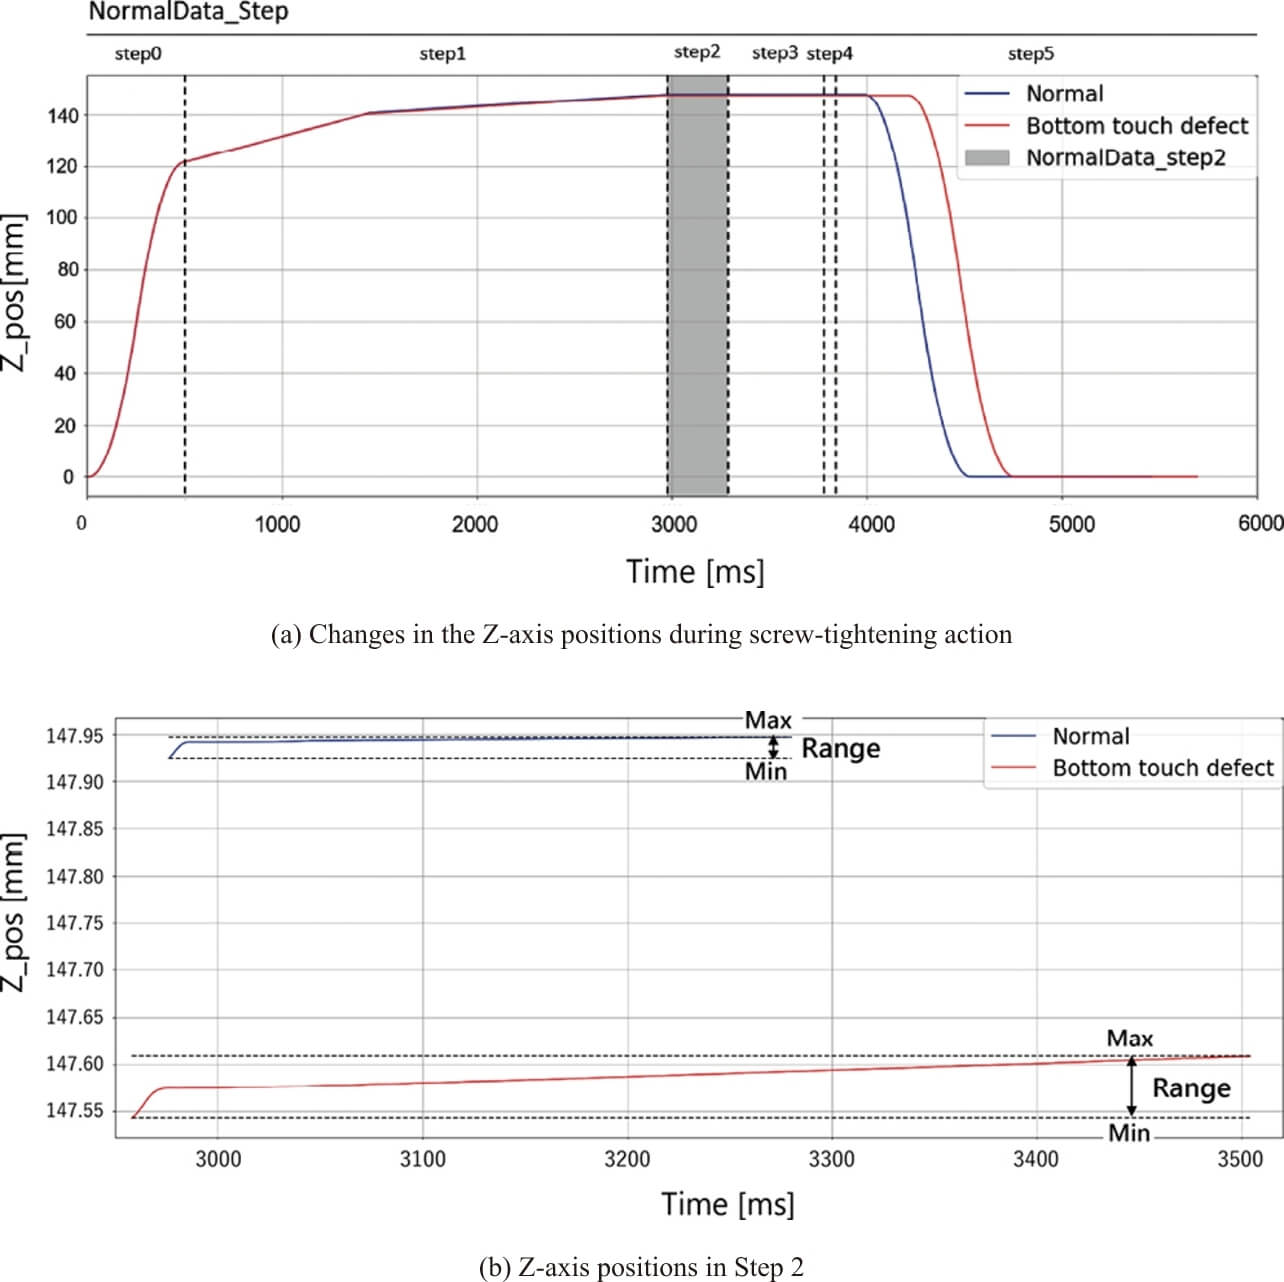
Fig. 10(a) shows the changes in the Z-axis positions during the entire screw-tightening procedure (Steps 0 to 5). The blue and red plots represent a single piece of normal-case data and that of bottom-touch defect-case data, respectively. The cases of screw-tightening action shown here in Fig. 10(a) appear to exhibit differences in the duration of Step 5. The differences are due to some steps with an operating time variable depending on the screw-tightening condition in progress. However, this time variation does not necessarily occur due to a screw-tightening defect and hence does not serve well as a discriminant. Fig. 10(b) is an enlarged view of Step 2 involving feature quantity selection.
These two pieces of data appear to exhibit differences in the Z-axis position between the normal and bottom-touch defect cases. However, as shown in Fig. 9, no significant differences can be seen in the overall distribution.
In the case of normal screw tightening, the screw became seated at Step 2 (full tightening), with the Z-axis position remaining nearly unchanged. In the case of screw tightening with a bottom-touch defect, however, a larger amount of change in the Z-axis position (range) occurred than in normal screw tightening, probably because the tip of the male screw or the bottom of the female threads became deformed due to the torque increase at Step 2.
(2) R-axis position at the occurrence of a bottom-touch defect
Fig. 11 shows the time-series plot of the R-axis position for a normal case and that for a bottom-touch defect case.
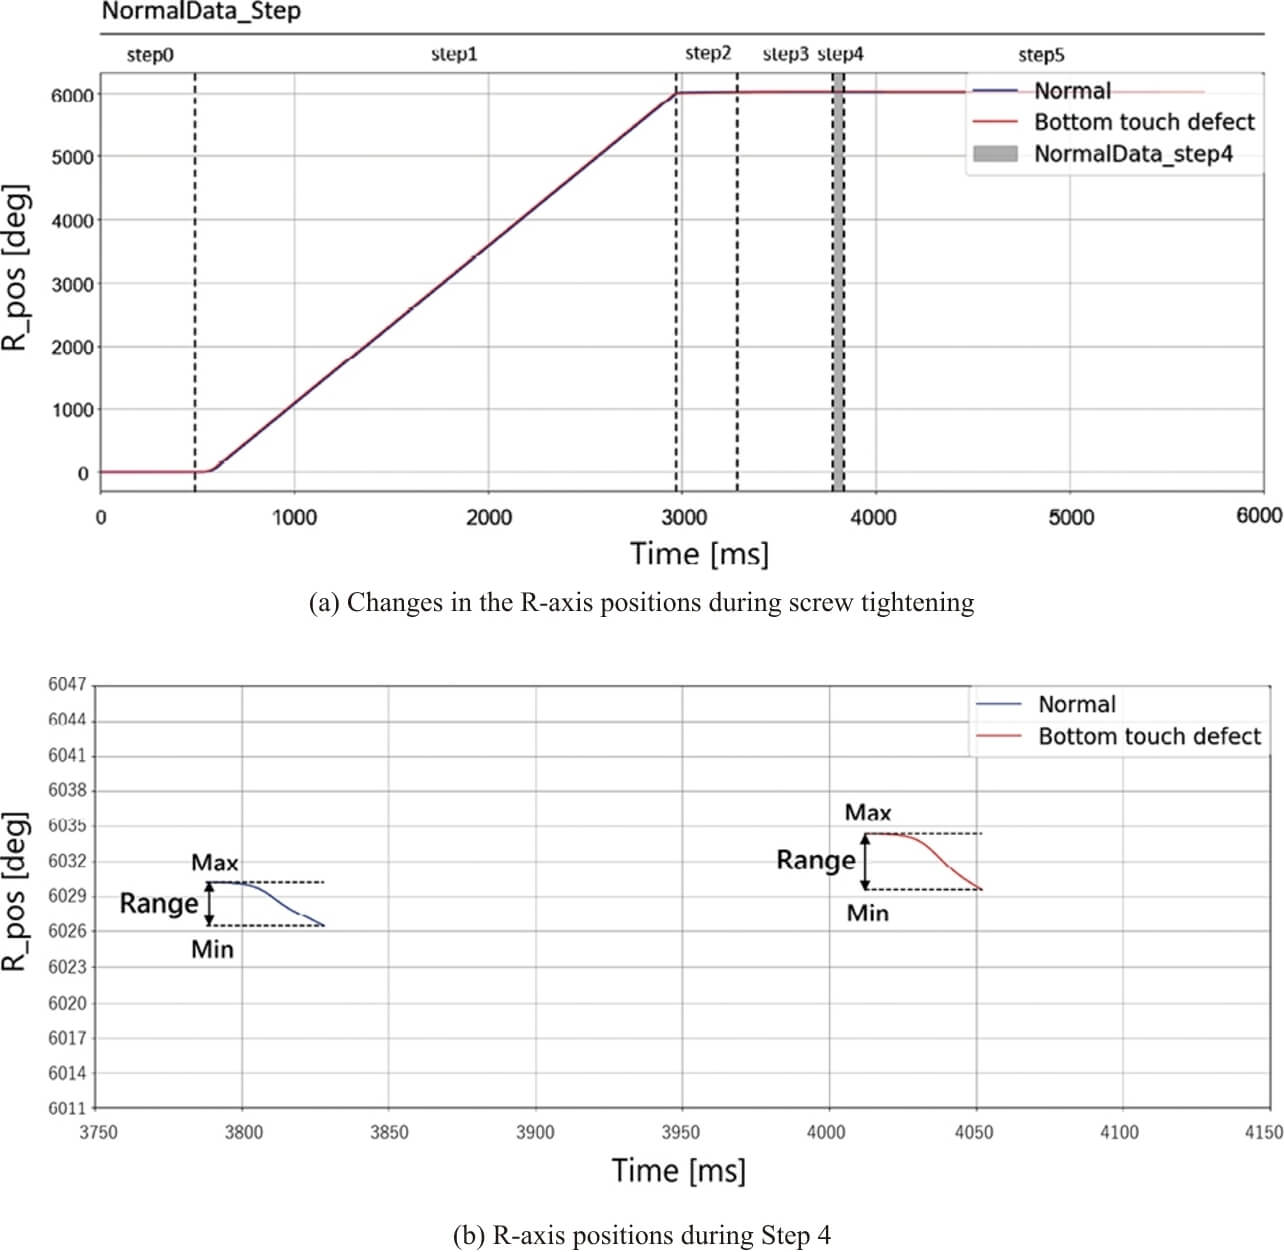
Fig. 11(a) shows the changes in the R-axis position during the entire screw-tightening procedure (Steps 0 to 5). The blue and red plots represent a single piece of normal-case data and that of bottom-touch defect-case data, respectively, revealing almost no differences in the changes in the R-axis positions. Fig. 11(b) is an enlarged view of Step 4 involving feature quantity selection. These two pieces of data appear to exhibit differences in R-axis absolute value between the normal and bottom-touch defect cases. However, as shown in Fig. 9, no significant differences can be seen in the overall distribution. Before the release of the R-axis torque at Step 4, the full tightening torque was applied via the driver bit in the turning direction of the male screw. The release of the R-axis torque in this condition resulted in a force working to undo the torsion of the male screw. The likely cause is that the screw with its head unseated because of a bottom-touch defect was free of rotational resistance and exhibited a larger amount of detorsion (more reverse turning of the screw) than in the normal case (with the screw head seated). To support the above inference, we confirmed that with the R-axis torque set to 0% at Step 4, a properly tightened screw showed no turning of its head, whereas an improperly tightened one with a bottom-touch defect showed some turning of its head.
4.7 Development of the AI machine learning model
We built an AI machine learning model by loading the AI controller with the learning data for the feature quantities selected in Subsection 4.6 (no training data included because the algorithm is an unsupervised learning one). The AI controller can automatically build an Isolation Forest model. The screw-tightening quality estimation FB built in the AI controller computes feature quantities specified by the data obtained from the R- and Z-axis servos controlled by the screw-tightening unit controller so that the machine learning function of the AI controller applies the feature quantities to the AI machine learning model to determine the AI scores.
4.8 Evaluation
We compared the Isolation Forest AI scores calculated by the AI controller with screw-tightening axial force values, the reference data obtained in Subsection 4.4. Fig. 12 shows the verification results for 300 pieces of normal data divided into three random 100-piece sets with 200 pieces of normal data used as learning data and the remaining 100 pieces of normal data used together with 100 pieces of bottom-touch defect data as evaluation data.

*Open in New Window
The horizontal axis represents the axial force. The vertical axis represents the AI score calculated by the AI controller. The AI score becomes greater with a greater deviation from the normal-data distribution. The blue color represents the normal data, while the colors other than blue represent the bottom-touch defect data. Two types of joints were prepared for the bottom-touch test, one with a 0.2 mm defect and the other with a 0.5 mm defect. However, the actual bottom-touch defects varied in dimensions. Therefore, we measured the amount of gap occurring between the seat of each male screw head and object to be fastened after screw tightening. The results are shown classified in (i) less than 0.01 mm, (ii) 0.01 mm or more to less than 0.04 mm, (iii) 0.04 mm or more to less than 0.2 mm, and (iv) 0.2 mm or more. It is clear from the results that the axial force was high in the normal data while low in the bottom-touch defect data.
The normal data have low AI scores, and the bottom-touch defect data have high AI scores, revealing a correlation between the AI score and the axial force.
With a gap amount of 0.04 mm or more, the AI scores for normalities and anomalies are clearly separate. With data with smaller gap amounts, axial force values and variations tend to be greater, along with lower AI scores. Some bottom-touch defect data have axial force values closer to the normal data. Consequently, the AI scores for normalities and anomalies are distributed close to each other and may result in a misjudgment. A misjudgment can be either a false negative judgment, in other words, finding an anomaly as a normality or a false positive judgment, such as finding a normality as an anomaly, depending on the threshold value setting.
For our test, we set threshold values to the criterion of zero false negatives and evaluated their adequacy by the false positive rate. Fig. 12 shows the above results relative to red dashed lines representing the threshold values set to ensure a zero false negative rate. Table 3 shows the resulting false positive rates.
| Verification | False positive rate (%) |
|---|---|
| Pattern A | 0.00 |
| Pattern B | 0.00 |
| Pattern C | 1.00 |
Patterns A and B showed zero false positives with their threshold values defined by the AI scores of approximately 0.54 and 0.56, respectively. Both patterns showed a complete separation of normalities and anomalies with a false positive rate of 0.00%. Pattern C showed one false positive point with the threshold value defined by the AI score of approximately 0.53 and, hence, a false positive rate of 1.00%.
The above evaluation results show that our method significantly reduced false positive rates for the datasets used here. In contrast, the conventional method ended up with normal data and bottom-touch defect data distributed indistinguishably overlapping, as explained in Subsection 4.6.
5. Conclusions
This paper presented a method of detecting anomalies in the automatic screw-tightening unit by an AI controller performing real-time on-site AI processing. We performed a test on bottom-touch defects with slight lifting and evaluated the effectiveness of our method based on the test results. Our proposed method successfully discriminated bottom-touch defects with less than 0.04 mm gap amounts hard to discriminate by conventional methods, albeit with a false positive rate of 1%. We showed that our method can discriminate 0.04 mm or greater gap amounts with a misjudgment rate of 0%. Because of their paucity of visual differences, insufficient axial forces in screw tightening have been a challenge to image-based inspection. Our proposed method uses AC servo data during screw tightening and can detect in real-time anomalies that are hard to identify by visual inspection. An automatic screw-tightening unit built-in with our method would enable manpower-saving and improve screw-tightening quality simultaneously.
Our test used a dedicated screw-tightening unit. We plan to fuse our method with robotic assembly applications and explore the possibility of applying it to improve the quality of screw tightening by general-purpose robots. This technology has come into being as a co-creation with our in-house factory. An application able to detect the eight different defective modes of screw tightening listed in Table 1, including bottom-touch defects discussed above, has already been developed and introduced into our production line. Highly evaluated on the shop floor, this technology is scheduled to replace the current inspection processes reliant on visual and other conventional inspection methods.
For further deployment to customers, our method needs to be checked for normality-anomaly distinction during mechanical/screw-tightening control and under screw-tightening conditions. Also required is identifying variable factors affecting anomaly detection, such as workpiece dimensions, shape and material, equipment wear/deterioration, and the posture of the screw during tightening. We intend to solve these challenges through deployment to external customers.
References
- 1’╝ē
- Ministry of Economy, Trade and Industry, Guidebook for Introducing AI (in Japanese), https://www.meti.go.jp/policy/it_policy/jinzai/AIutilization.html, (accessed May 1, 2022).
- 2’╝ē
- OMRON Corporation, ŌĆ£[Featured Product] AI-Equipped Machine Automation Controller,ŌĆØ (in Japanese), https://www.fa.omron.co.jp/product/special/sysmac/featured-products/ai-controller.html, (accessed May 1, 2022).
- 3’╝ē
- T. Mioki and J. Deki, ŌĆ£Development of AI-equipped Machine Automation Controller (1),ŌĆØ (in Japanese), OMRON TECHNICS, vol. 51, no. 1, pp. 39-44, 2019.
- 4’╝ē
- M. Ota and Y. Nishiyama, ŌĆ£Development of AI-equipped Machine Automation Controller (2),ŌĆØ (in Japanese), OMRON TECHNICS, vol. 51, no. 1, pp. 45-51, 2019.
- 5’╝ē
- K. Miyamoto and S. Kawanoue, ŌĆ£Development of AI-equipped Machine Automation Controller (3),ŌĆØ (in Japanese), OMRON TECHNICS, vol. 51, no. 1, pp. 52-57, 2019.
- 6’╝ē
- Nitto Seiko Co., Ltd., ŌĆ£Automatic Screw-Tightening Machine),ŌĆØ (in Japanese), Japanese Unexamined Patent Publication No. 2012-223841.
- 7’╝ē
- Toshiba Corporation, ŌĆ£Screw-Tightening Machine),ŌĆØ (in Japanese), Japanese Unexamined Patent Publication No. H09-183027.
- 8’╝ē
- Denso Corporation, ŌĆ£Screw-Tightening Machine),ŌĆØ (in Japanese), Japanese Unexamined Patent Publication No. H07-223132.
- 9’╝ē
- F. T. Liu, K. M. Ting, and Z.-H. Zhou, ŌĆ£Isolation-based Anomaly Detection,ŌĆØ ACM Trans. Knowl. Discov. Data, vol. 6, no. 1, p. 3, 2012. (TKDD)
- 10’╝ē
- Yuzo Hirai, An Introduction to Pattern Recognition (in Japanese), Morikita Publishing Co., Ltd., 2012.
The names of products in the text may be trademarks of each company.