


5-Year Indicators
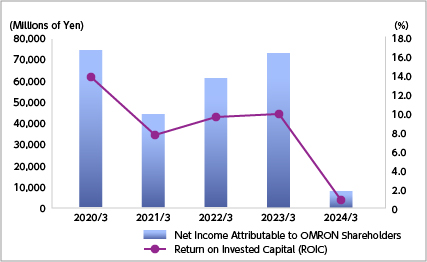
Return on Invested Capital (ROIC)
’╝łMillions of Yen’╝ē
| FY2020 | FY2021 | FY2022 | FY2023 | FY2024 | |
|---|---|---|---|---|---|
| Net Income Attributable to OMRON Shareholders |
43,307 | 61,400 | 73,861 | 8,105 | 16,271 |
| Invested Capital* | 558,709 | 641,425 | 712,053 | 804,415 | 913,573 |
| Return on Invested Capital (ROIC) (%)** | 7.8% | 9.6% | 10.4% | 1.0% | 1.8% |
*Invested Capital is based on the average of previous fiscal year-end result and quarterly results of the current year.
Invested Capital = Net Assets + Interesting - Bearing Debt
**Return in Invested Capital (ROIC) = Net Income (Loss) Attributable to Shareholders/Invested Capital
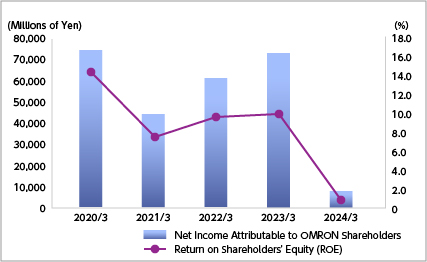
Return on Shareholders' Equity (ROE)
’╝łMillions of Yen’╝ē
| FY2020 | FY2021 | FY2022 | FY2023 | FY2024 | |
|---|---|---|---|---|---|
| Net Income Attributable to OMRON Shareholders |
43,307 | 61,400 | 73,861 | 8,105 | 16,271 |
| Shareholders' Equity* | 568,637 | 636,043 | 696,850 | 757,580 | 779,338 |
| Return on Shareholders' Equity (ROE)** | 7.6% | 9.7% | 10.6% | 1.1% | 2.1% |
*Shareholders' Equity is based on the average of the beginning and end of each year.
**Return on Shareholders' Equity (ROE): Net Income/Shareholders' Equirt
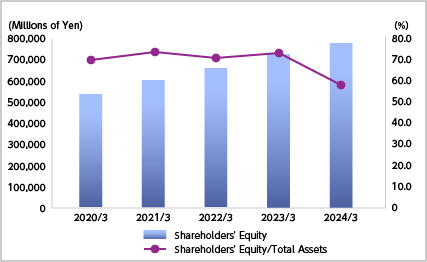
Ratio of Shareholders' Equity to Total Assets
’╝łMillions of Yen’╝ē
| FY2020 | FY2021 | FY2022 | FY2023 | FY2024 | |
|---|---|---|---|---|---|
| Shareholders' Equity | 606,858 | 665,227 | 728,473 | 786,686 | 771,885 |
| Total Assets | 820,379 | 930,629 | 998,160 | 1,354,729 | 1,361,790 |
| Shareholders' Equity/Total Assets (%) | 74.0% | 71.5% | 73.0% | 58.1% | 56.7% |
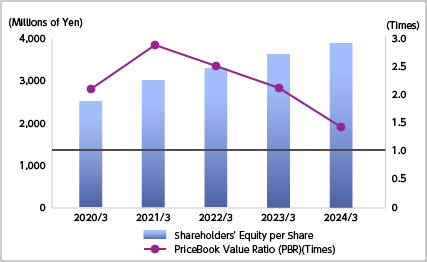
Price-Book Value Ratio (PBR)
| FY2020 | FY2021 | FY2022 | FY2023 | FY2024 | |
|---|---|---|---|---|---|
| Number of Shares (Shares)* | 201,670,578 | 199,191,225 | 196,827,180 | 196,915,589 | 196,894,506 |
| Shareholders' Equity per Share** | 3,009 | 3,340 | 3,701 | 3,995 | 3,920 |
| Stock Price*** | 8,640 | 8,214 | 7,707 | 5,411 | 4,212 |
| PriceBook Value Ratio (PBR)(Times)**** | 2.9 | 2.5 | 2.1 | 1.4 | 1.1 |
*Number of Shares=Stock Outstanding at End of Term - Treasury Stock at End of Term
**Shareholders' Equity per Share is based on the number of shares outstanding at the end of period.
***Figures at the end of rach fiscal year.
****Price-Book Value Ratio (PBR) = Fiscal Year-End Stock Price / Shareholders' Equity per Share
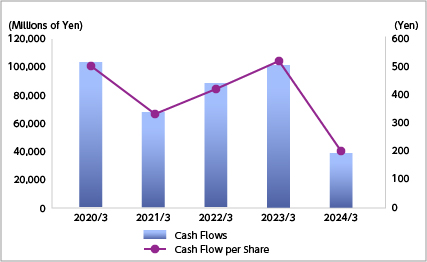
Cash Flows per Share
| FY2020 | FY2021 | FY2022 | FY2023 | FY2024 | |
|---|---|---|---|---|---|
| Cash Flows (Millions of Yen)* | 66,063 | 84,767 | 100,448 | 38,921 | 49,721 |
| Number of Shares** | 201,670,578 | 199,191,225 | 196,827,180 | 196,915,589 | 196,894,506 |
| Cash Flow per Share | 328 | 426 | 510 | 198 | 253 |
*Cash Flow = Net Income (Loss) Attributable to SHareholders + Depreciation and Amortization
**Number of Shares=Stock Outstanding at End of Term - Treasury Stock at End of Term
![]()
Adobe Acrobat Reader is free software that lets you view and print Adobe Portable Document Format (PDF) files.