Multi-pulse Fiber Laser Technology That Realizes Deep Marking on Metal
- Traceability
- DPM
- Laser marker
- Fiber laser
- Marking quality
Recently, social interest in safety and security has increased, and in addition to quality improvement that does not bring defective products to the market, traceability to manage target parts and the manufacturing process is important for quick identification when defects occur. In addition, mainly in the automobile industry, problems of unreadable marking due to post-processes like heat/polishing and painting after marking on metal objects have become apparent. Laser marking requires a means to achieve a deeper marking process in a short time that does not disappear even after post-processing. Therefore, we aim to obtain the pulse energy and laser average output required for deeper marking on metal and use a master oscillator and power amplifier (MOPA) fiber laser with multi-pulse and input signal control technology. As a result, we achieved a high laser average output (20 W at 50 kHz) below the peak power where stimulated Raman scattering (SRS), which causes deterioration of beam quality, does not occur. In addition, it was confirmed that the laser marking system using this technology could obtain about 25 times deeper marking on a metal compared to the conventional method while maintaining high marking quality.
1. Introduction
With the recent increase in public awareness of safety and security, manufacturers are being held more socially responsible for recalls and the like for addressing nonconformities found in end products. Hence, besides quality improvements to prevent any outflow of non-conforming products to the market, traceability for managing the non-conforming parts or manufacturing processes has become more important for quickly identifying nonconformities that may occur. An international standard for quality management systems (IATF 16949) was established specifically for the automotive industry in 2016. Since then, direct part marking (DPM) has been performed on critical parts on a one-by-one basis. Meanwhile, electronic parts are code- marked and code-controlled for imitation prevention or product yield improvement.
For traceability, the mainstream method is to mark codes (QR codes, direct codes, or the like) on objects and control them accordingly. Marking methods include stamping, inkjet marking, and laser marking. Laser marking is particularly widely used for marking industrial parts because of its advantages, including lasting indelibility, no running cost required for ink, wear-prone tools, and other consumables, and easy changeover compatible with multi-product small-lot production or short product cycles.
With more and more items requiring marking, mainly in the recent automotive industry, unreadable markings have surfaced among others as a problem due to post-processes, such as heat treatment/polishing or coating of marked metal objects. A means of making deeper markings indelible even after post-processes in a short takt time are required for laser marking.
This report presents a fiber laser technology with the energy per pulse and the average output energy enhanced to enable deep metal marking in a short takt time while maintaining marking quality, and the results of performing deep marking on metals using a laser marking system equipped with the fiber laser technology.
2. Existing technology and challenges
2.1 Existing technology
Conventionally, laser marking systems used solid-state laser emitters as their light sources. In a solid-state laser system, a medium added with a rare earth element is used in combination with a mirror or reflector to resonate and amplify light into a laser beam. The common practice is to use a method that turns a Q-switch on and off to emit laser beams. A solid-state laser system is structurally prone to optical axis misalignment because of the thermal and mechanical effects from the surrounding environment, followed by output power loss and beam quality deterioration, and has a problem with the durability of the Q-switch and the mirror. It is not easy to provide a laser system with high beam quality and sufficient flexibility to set appropriate laser conditions for items requiring marking. Moreover, a typical conventional laser marking system is structurally required to keep the laser diodes (LDs) lit all the time and hence is said to have high power consumption.
Against this background, fiber laser light sources have been developed to have optical fibers as amplification media. These systems have high beam quality with the optical fibers having a perfectly round, small-diameter core and are free of optical axis misalignment with the optical fibers spliced in place and hence enable long-time stable laser oscillation without the need for complicated maintenance. Systems proposed so far include Q-switch-based oscillator systems1) and master oscillator and power amplifier (MOPA) systems2-4), which directly modulate and amplify the light from the seed laser diode (seed LD). MOPA systems feature a high degree of flexibility regarding pulse width, pulse shape, and pulse repetition frequency. Fig. 1 shows a typical configuration:
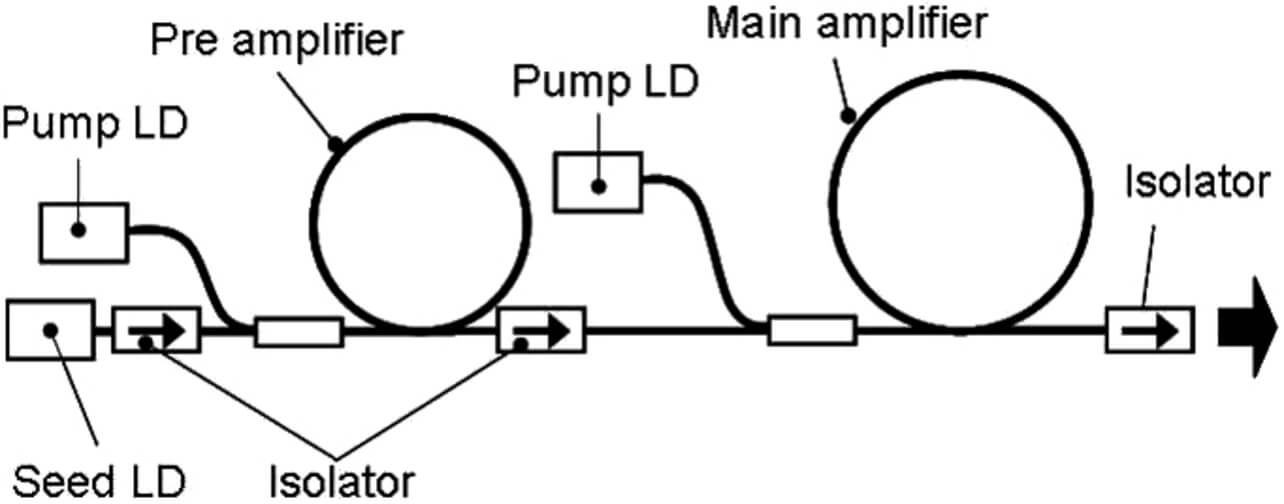
This fiber laser system has a configuration in which the laser signal light from the seed LD is amplified through multiple rare earth-added double-clad fibers to produce a laser beam of a predetermined intensity. More specifically, in the amplification fiber, light amplification occurs as the result of the signal light being stimulated as allowed to fall incident on rare earth element atoms pumped with excitation light.
The laser system comes in a small, fully forced-air-cooled enclosure, along with specifications to provide a maximum average output power of 20 W, a maximum energy of 1 mJ, and a repetition frequency modulation range of 10 to 1,000 kHz.
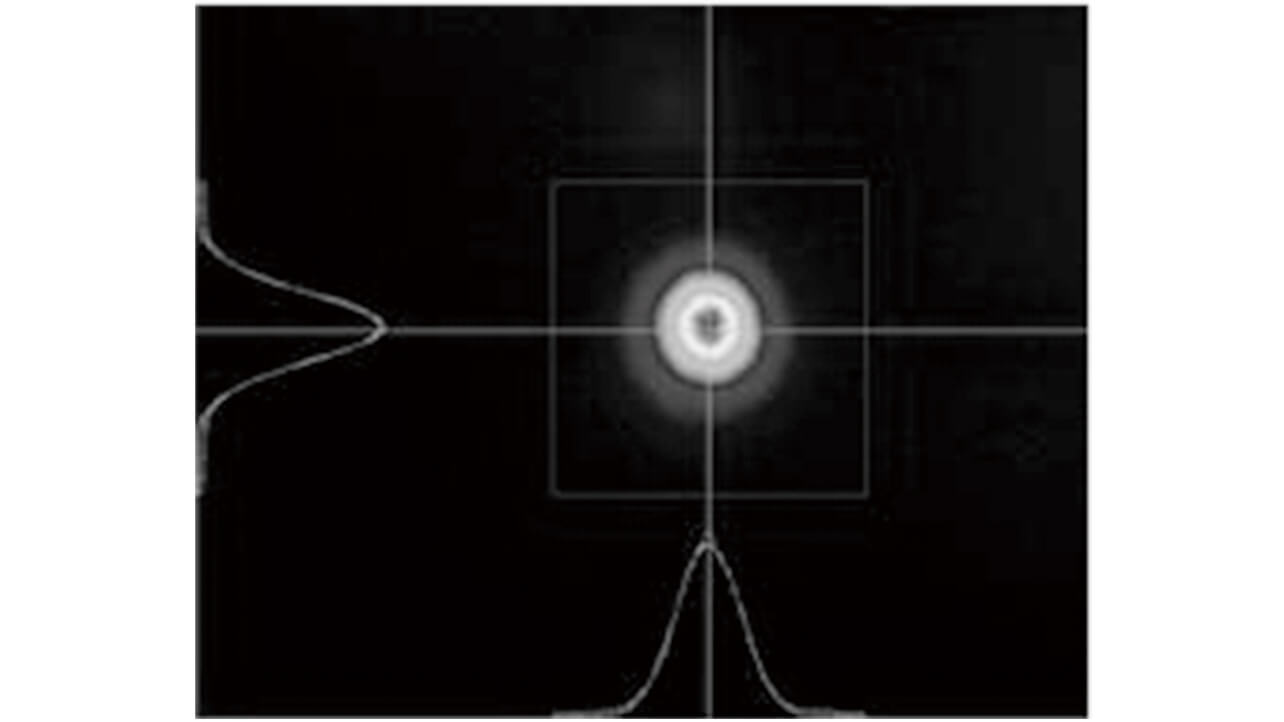
The output beam has a near single-mode quality of M2 Ōēł 1.2, a less-astigmatic shape with a roundness ratio of 1:1.2 or less, and a spot diameter of approximately 50 μm (1/e2) on board a laser marking system. Fig. 2 shows a typical laser output beam profile:
2.2 Challenges
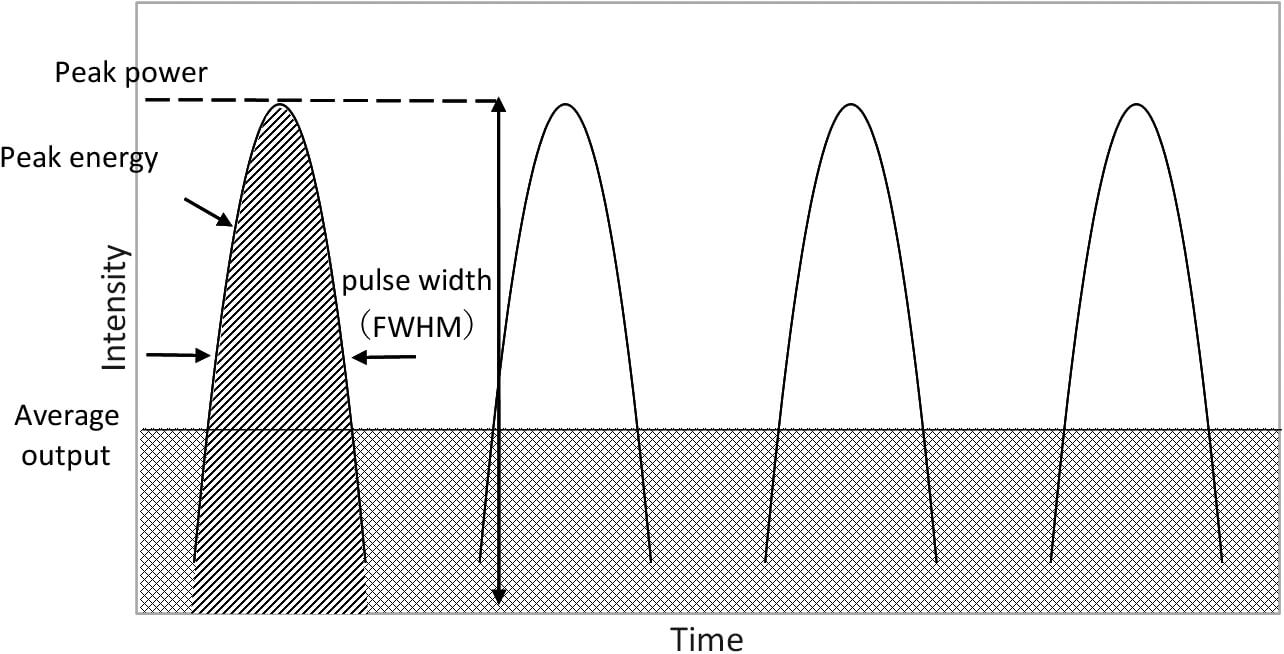
For high-speed, high-quality deep marking in metal, a laser system must have its pulse energy and laser average output power enhanced without reduced beam quality. The rationale is that higher energy per pulse applies heat deep into the metal tissue beneath the laser-irradiated metal surface. As a result, a metal melting phenomenon is induced to allow deep marking. Besides, higher laser average output power allows continuous heat application to laser-irradiated spots to add speed to deep marking. Fig. 3 illustrates the relationship between the pulse energy and the laser average output power. Pulse energy is the amount of energy fired during a single laser pulse and is obtained as the integration of the pulse intensity over the pulse width. Here, the peak power refers to the maximum light intensity per pulse, while the pulse width is the full width at half maximum (FWHM) of the pulse. The laser average output power is the average value of the laser output during a certain time, and for a pulse laser system, it is calculated as the product of the pulse energy multiplied by the repetition frequency.
Increasing the amount of excitation light may provide an effective means of pulse energy and laser average output power enhancement for a solid-state laser system. However, the resulting effects, including the thermal lens effect, will pose difficulty ensuring high beam quality.
The pulse energy for a fiber laser system can be effectively enhanced by reducing the repetition frequency. This effect results from an increased accumulation of rare earth element atoms in the amplification fiber pumped with excitation light due to extended pulse intervals. However, the resulting increase in instantaneous peak power causes a peak shift accompanying the nonlinear effect of stimulated Raman scattering (SRS), resulting in reduced beam quality. Therefore, when the repetition frequency is too low, the amount of excitation light must be reduced until SRS-free peak power is reached. However, the laser average output power will also be reduced. The laser average output power can be effectively enhanced by adopting a large-diameter core amplification fiber compatible with high output power. However, adopting a large-diameter core fiber will increase the beam diameter, causing higher-order propagation modes and reducing beam quality. Consequently, the spot diameter at the marking focus of the laser marker will be increased, making fine marking difficult, resulting in reduced marking quality.
Accordingly, deep metal marking requires enhancing the pulse energy or the laser average output power while controlling the instantaneous peak power without causing nonlinear effects.
3. Content of the present study
To enable deep metal marking while maintaining high marking quality, we considered the following two methods of achieving high pulse energy and high laser average output power at a peak power free of nonlinear effects in a fiber laser MOPA system capable of pulse control with high beam quality:
- (1)
- Increasing the amount of excitation light during multi-pulse operation to enhance the pulse energy at an SRS-free peak power; and
- (2)
- Controlling the energy of individual pulses in the multi-pulse regime to enhance the laser average output power.
3.1 Multi-pulse
As explained in 2.2 ŌĆ£Challenges,ŌĆØ a fiber laser system experiences SRS when its peak power increases with its repetition frequency reduced. Hence, with the laser mode switched from single pulse to multi-pulse, the energy of excitation light accumulated in the amplification fiber will be consumed to reduce the peak power per beam. Fig. 4 shows the single-pulse and multi-pulse peak powers required for the laser system to achieve the peak power with the same laser average output power. Thus, the instantaneous peak power can be controlled to reduce SRS.

3.2 Optimal control of the Seed LD
Optimizing energy amplification control in the multi-pulse regime enables the maximization of the pulse energy and the laser average output power. Fig. 5 shows an energy level diagram of the amplification fiber. Atoms at the ground level E1 (atomic distribution density N1) are pumped up by excitation light to the excitation level E2 so that the incident signal light causes stimulated emissions of atoms at the excitation level E2 (atomic distribution density N2) followed by laser light amplification.
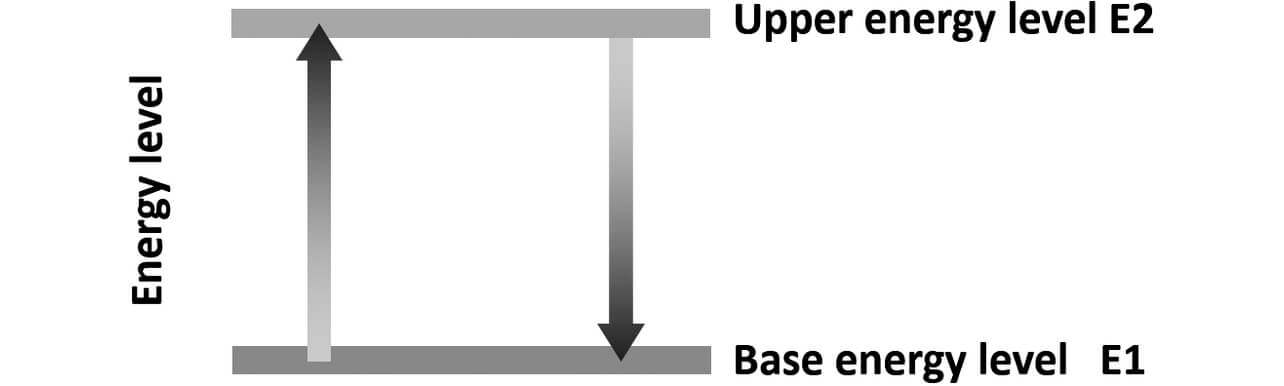
The output power P after amplification by the amplification fiber can be calculated as P = I + N2├ŚF├ŚI, where N2 is the atomic distribution density at the excitation level, I is the amount of signal light, and F is the intrinsic parameter of the amplification fiber (emission cross-section energy, coupling efficiency, etc.). The pulse energy can be controlled mainly by the amounts of excitation light and signal light. However, for nsec-level pulse trains, the amount of excitation light is hard to control. Hence, signal-light amount control is important.
Fig. 6 shows typical multi-pulse signal patterns with linearly and curvilinearly increasing amounts of the incident signal light. Let the pulses comprising each multi-pulse pattern be n1, n2, n3, ... n* in order. Fig. 7 shows the atomic distribution density N2 at the excitation level normalized to N2 immediately before the pulse n1 at the incidence of each pulse train calculated based on the multi-pulse patterns shown in Fig. 6. The atomic distribution density at the excitation level is highest at the timing of n1. Therefore, the laser average output power can be enhanced, with the intra-pulse train peak power limited by keeping the amount of signal light at n1 low and then increasing it linearly. Besides, the atomic distribution density of the second half of the pulse train and the amount of signal light must be increased sufficiently to enhance the peak power of the second half of the pulse train. Hence, the laser average output power can be enhanced with the peak amplified output power per pulse in the multi-pulse regime kept below the SRS occurrence threshold by keeping the amount of incident signal light low for the first half of the pulse train and significantly increasing it curvilinearly for the second half.
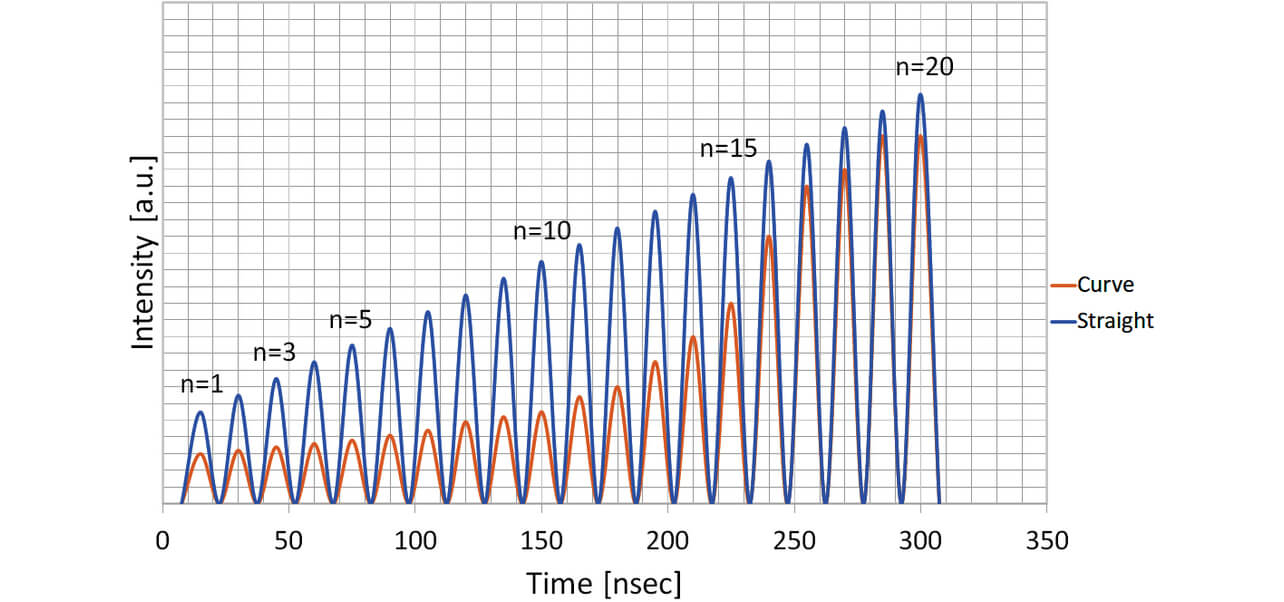
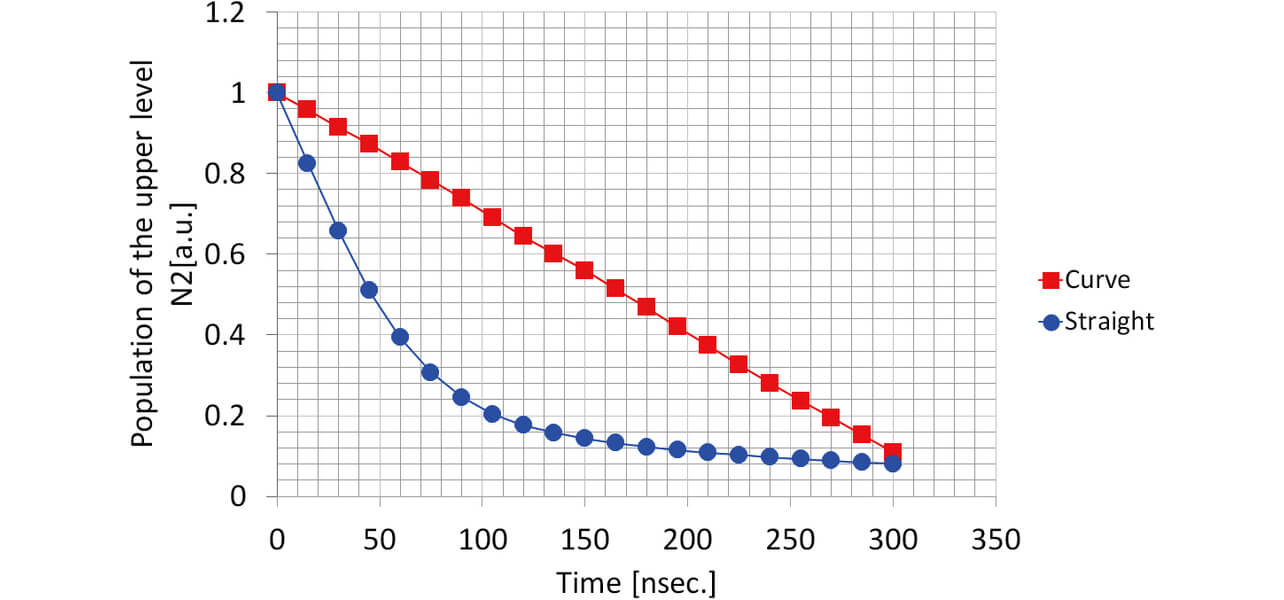
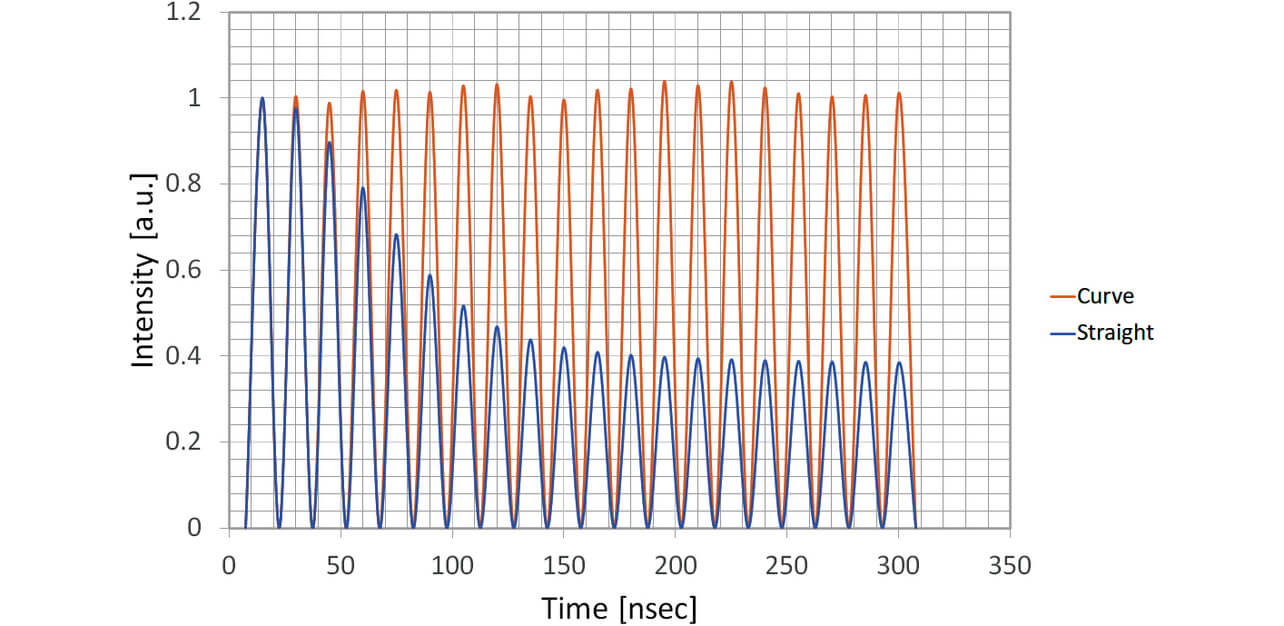
Fig. 8 shows the simulation results of the amplified output power normalized to the maximum peak power.
4. Experiment results
4.1 Experiment results for multi-pulses
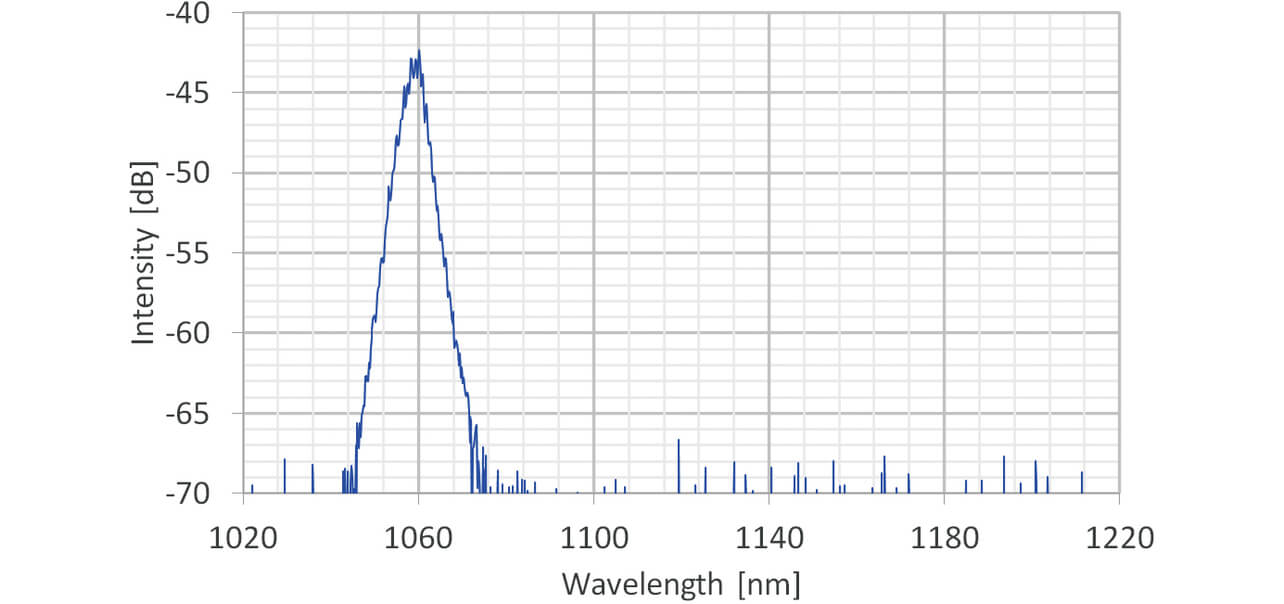
We increased the amount of excitation light for single pulses and multi-pulses, respectively, to verify the amplified output power and check for any SRS. Fig. 9 shows the wavelength characteristics of the output light with the amount of excitation light increased for single pulses at the repetition frequency of 10 kHz. The SRS (1,120 nm) occurring to the laser signal light (1,062 nm) indicates the spreading of wavelength components.
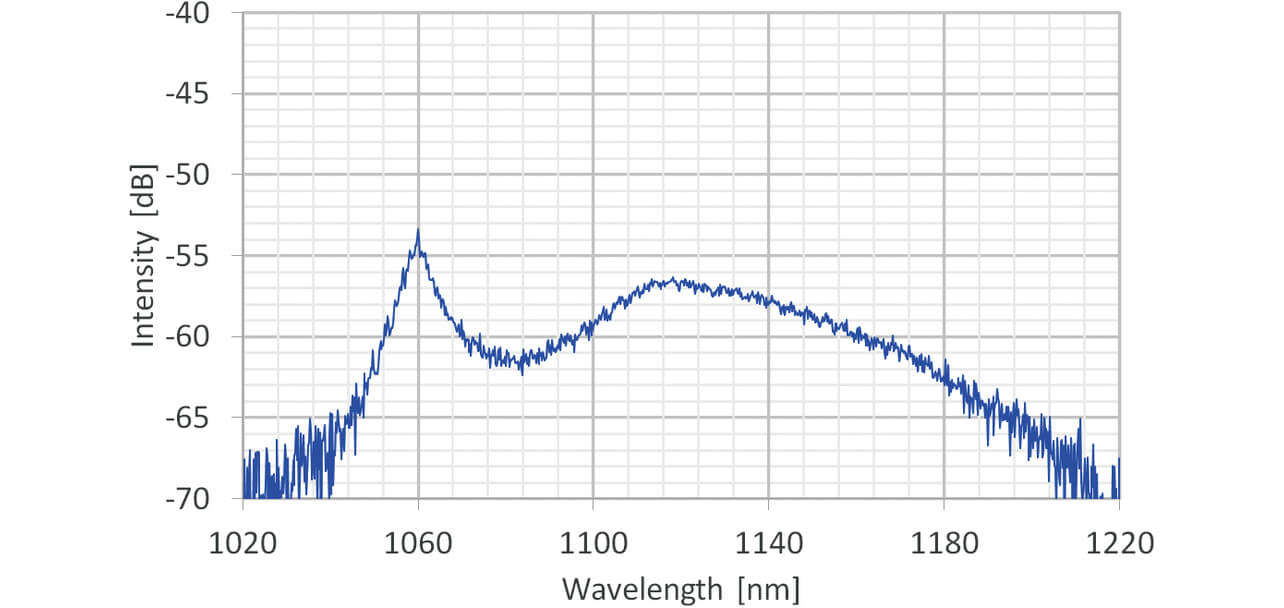
Fig. 10 shows the wavelength characteristics of the output light with the amount of excitation light increased to the same level as the above single-pulse case for multi-pulses at the repetition frequency of 10 kHz. Only the wavelength of laser signal light peaking at 1,062 nm was observed, while no occurrence of SRS was detected.
4.2 Experiment results for the optimal control of the Seed LD
Then, we controlled the multi-pulse waveform to obtain the maximum laser average output power for multi-pulses, as shown in 3.2. The pulse width per pulse was 7.5┬▒2.5 ns. Fig. 11 (Top Panel) shows the Seed LD waveform pattern that appeared as the amount of multi-pulse signal light guided into the amplification fiber was increased linearly from n1 to n*. Meanwhile, the amplification fiber output pattern shows a high peak power at n1, followed by a gradual decrease from n2 and onwards, as in Fig. 11 (Bottom Panel).
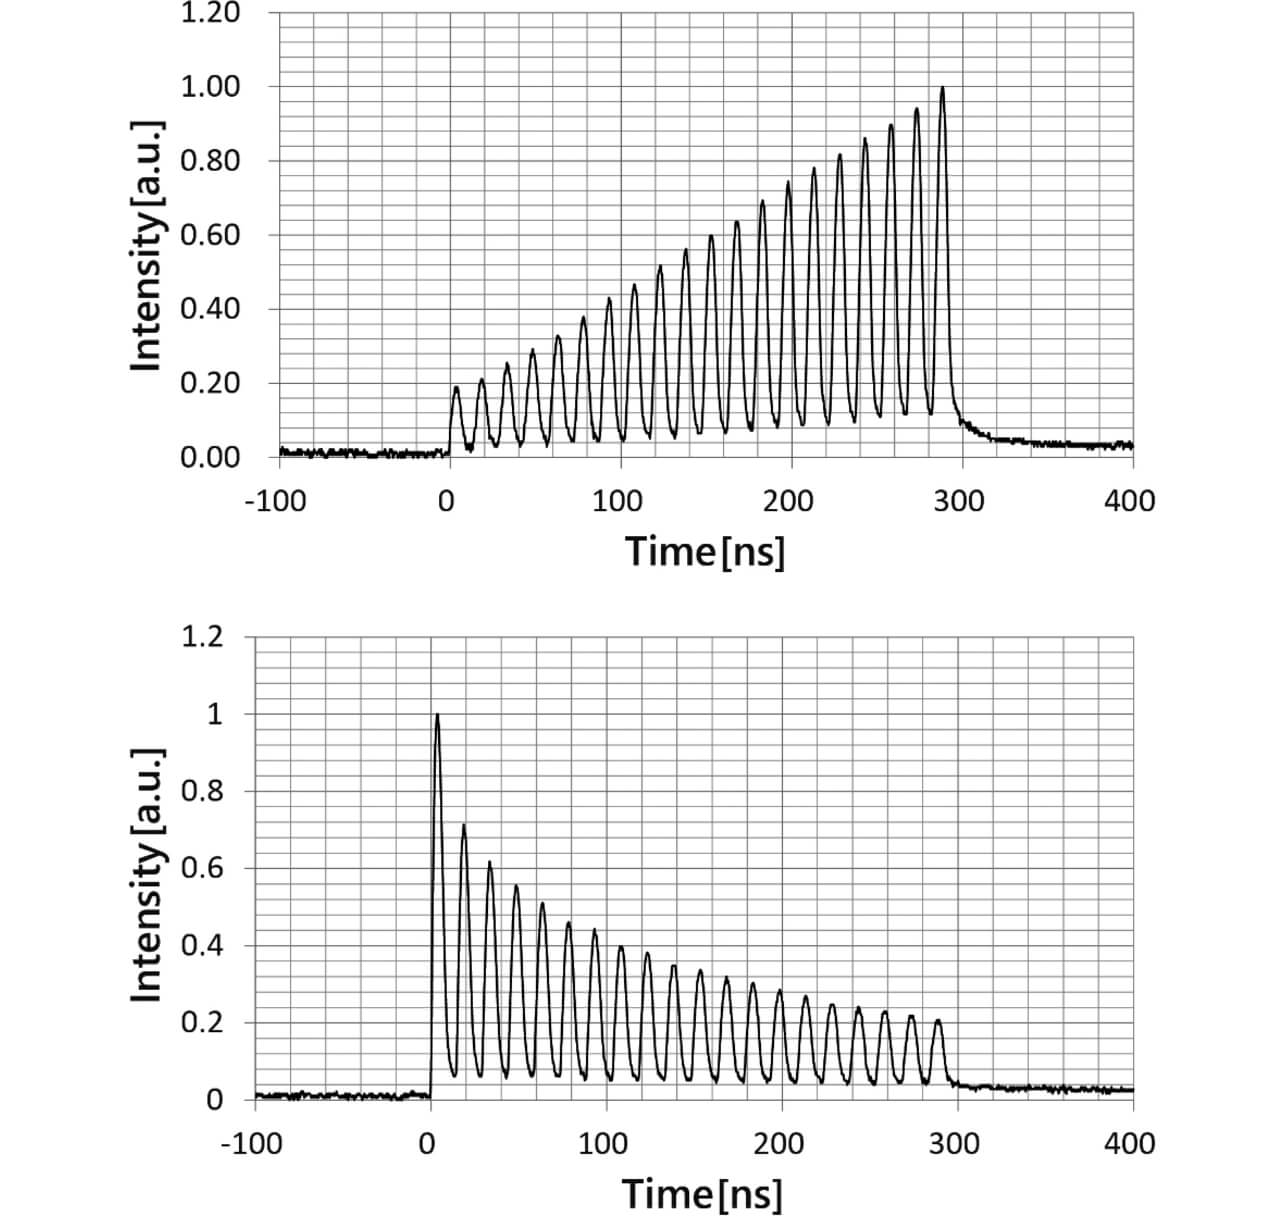
Fig. 12 (Top Panel) shows the Seed LD waveform pattern that appeared as the amount of signal light gradually increased along the curvature line with the amount of signal light at n1 reduced further. As shown in Fig. 12 (Bottom Panel), the amplification fiber output pattern shows that even with the peak power reduced for the first half of the multi-pulse train, the output power was successfully kept high for the second half.
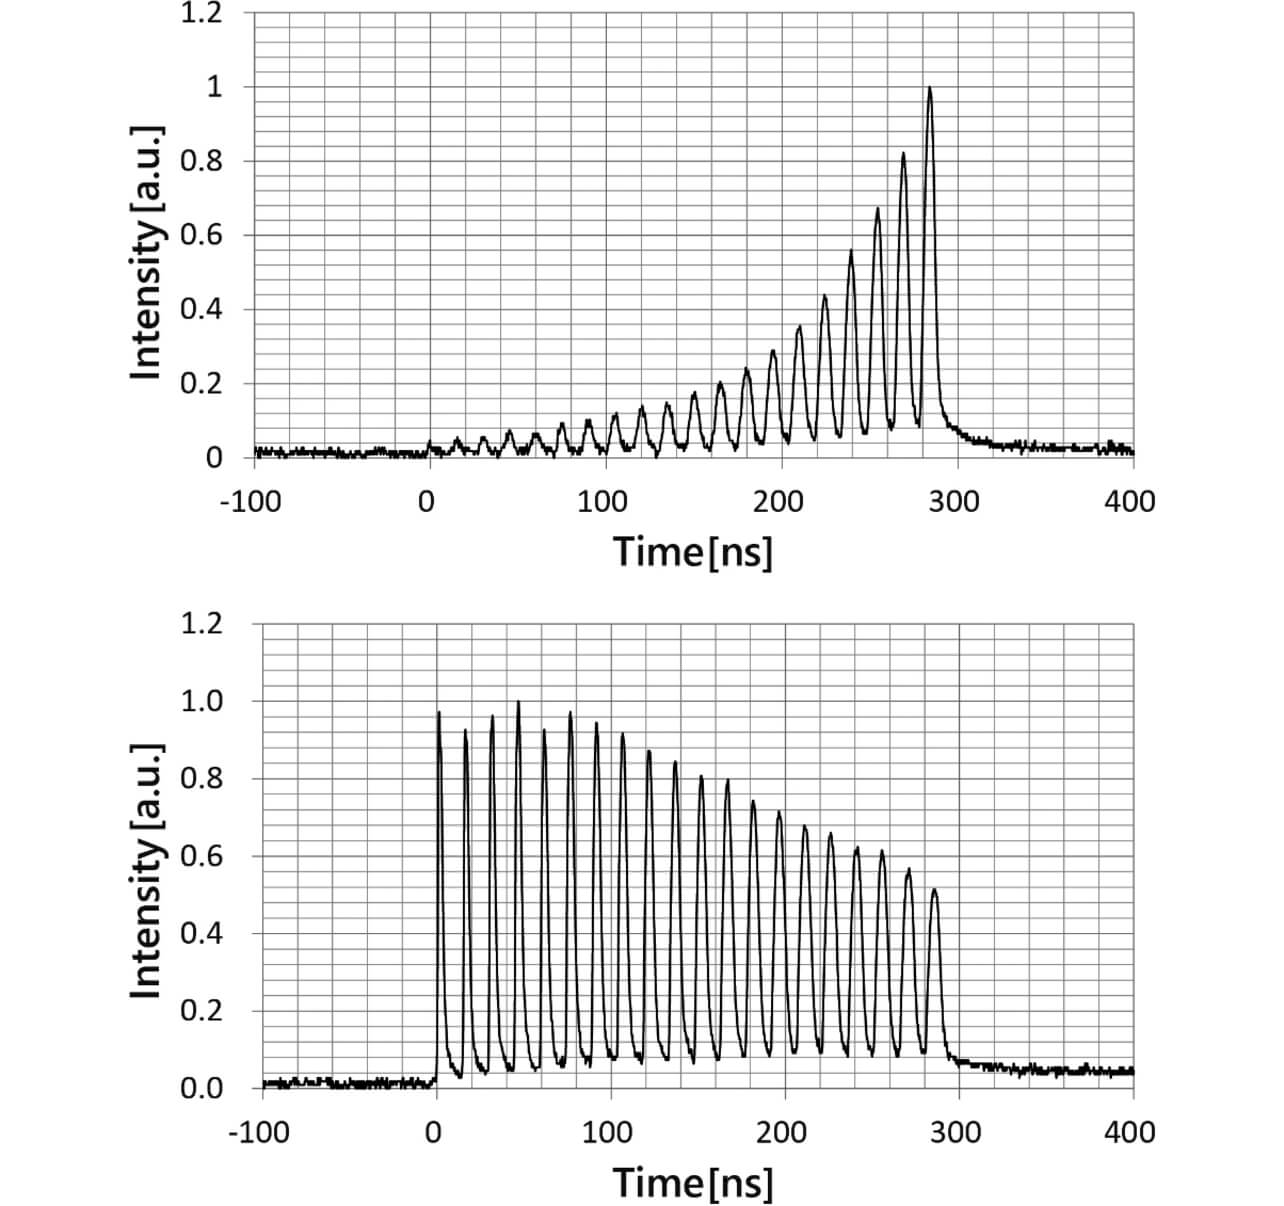
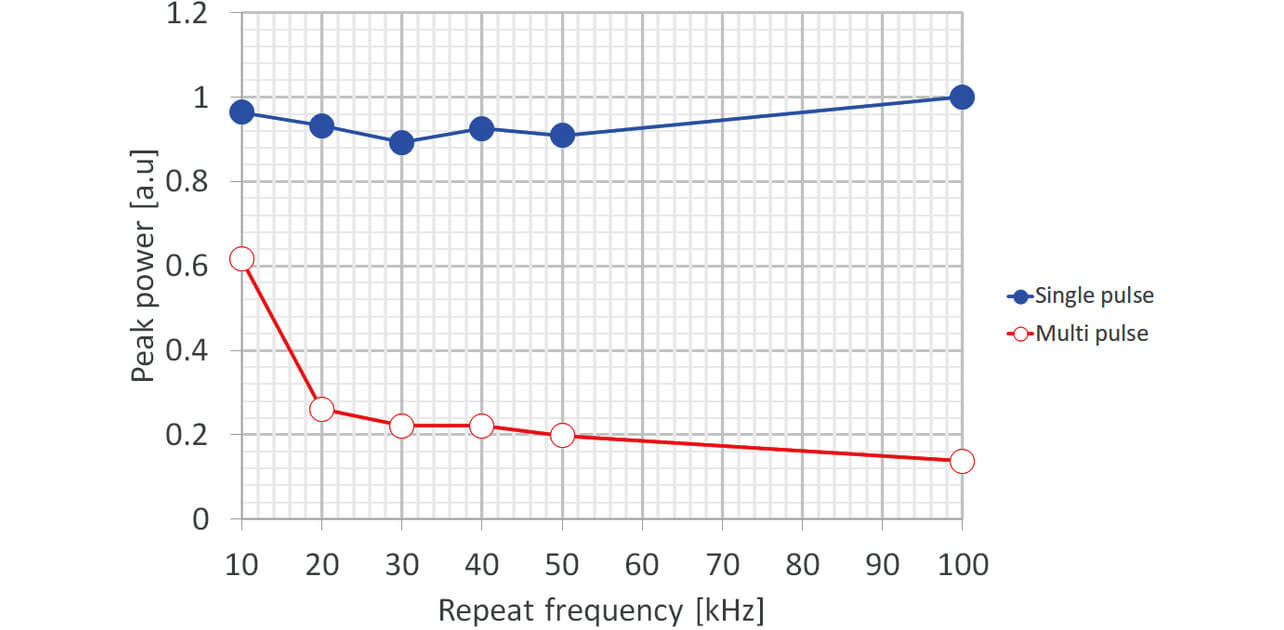
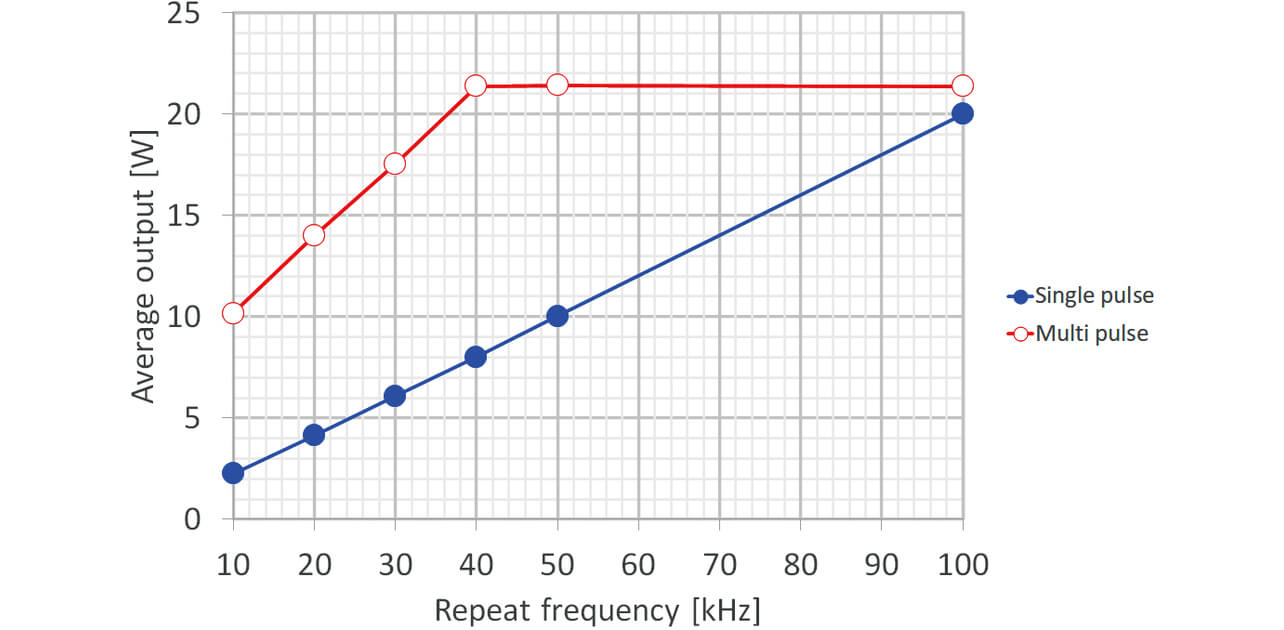
Fig. 13 shows the single-pulse and multi-pulse peak powers (normalized to the maximum single-pulse peak power) at each repetition frequency. Fig. 14 shows the laser average output powers. Note that an upper limit of 20 W was set for the laser average output power of our fiber laser system with consideration given to the limit values of its optical components. We successfully obtained an increased laser average output power while keeping the peak power low by enhancing the amount of excitation light with multi-pulses at the repetition frequency of 10 to 100 kHz. The multi-pulse peak power shown in Fig. 13 is sufficiently low with a sufficient margin relative to the SRS-free single-pulse peak power so that the laser average output power shown in Fig. 14 can be further enhanced for multi-pulses.
4.3 Results of processing (deep marking) by the laser marking system equipped with our fiber laser source
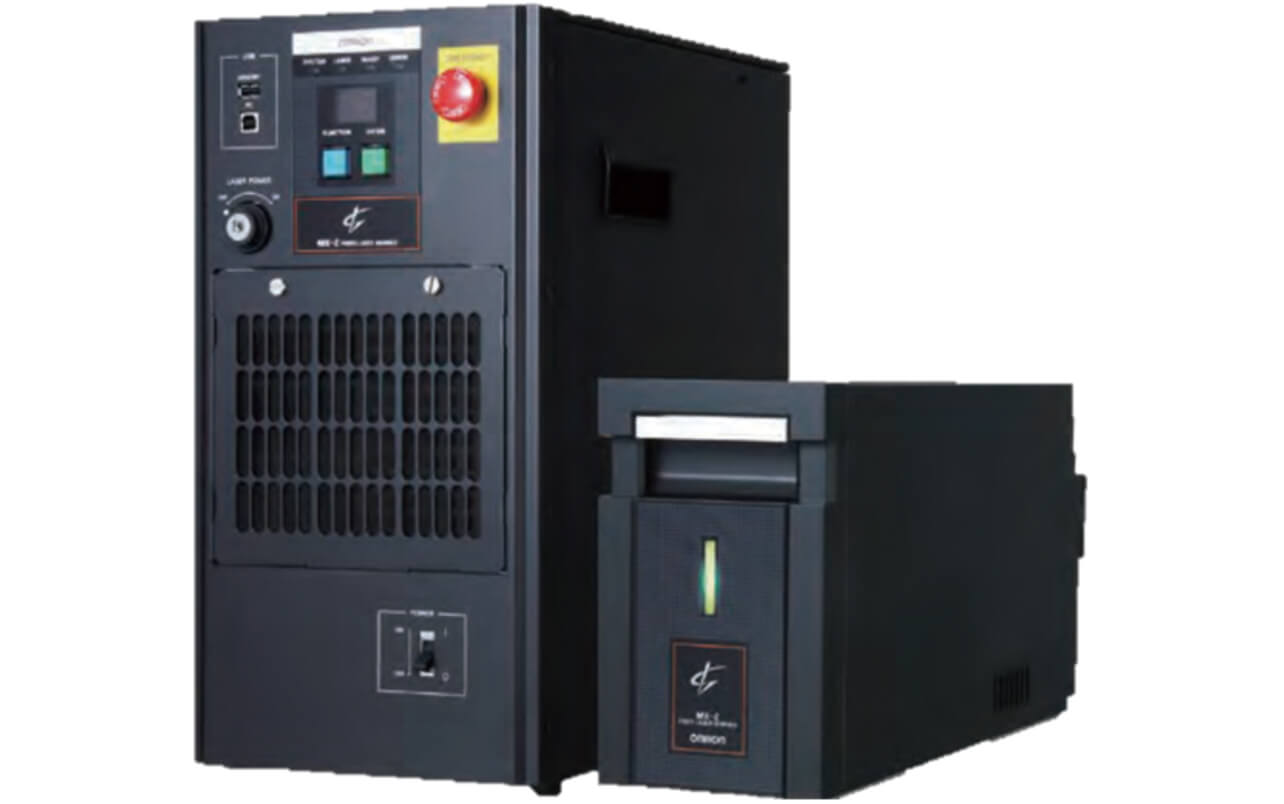
We tested the laser marking system with the fiber laser source under our study for deep marking performance by applying multi-pulses to make deep markings in stainless steel 304, aluminum (AL), and die-cast aluminum (ADC), materials used in high volumes in the automotive industry. The laser marking system has a galvanometer mirror and a condenser lens, providing a marking area of 160 mm├Ś160 mm and a working distance of 220 mm┬▒10 mm. Fig. 15 shows the outward appearance of the laser marking system.
The marking pattern used for processing performance verification was designed with an aspect ratio of 1 or less for immunity to the effect of optical diffraction to support marking depth measurement with an optical measuring instrument. Then, we made a solid rectangular marking of 2 mm ├Ś 1 mm. Fig. 16 shows a photo of the obtained marking as viewed from above, along with images of marking in progress and a conceptual image of solid marking.
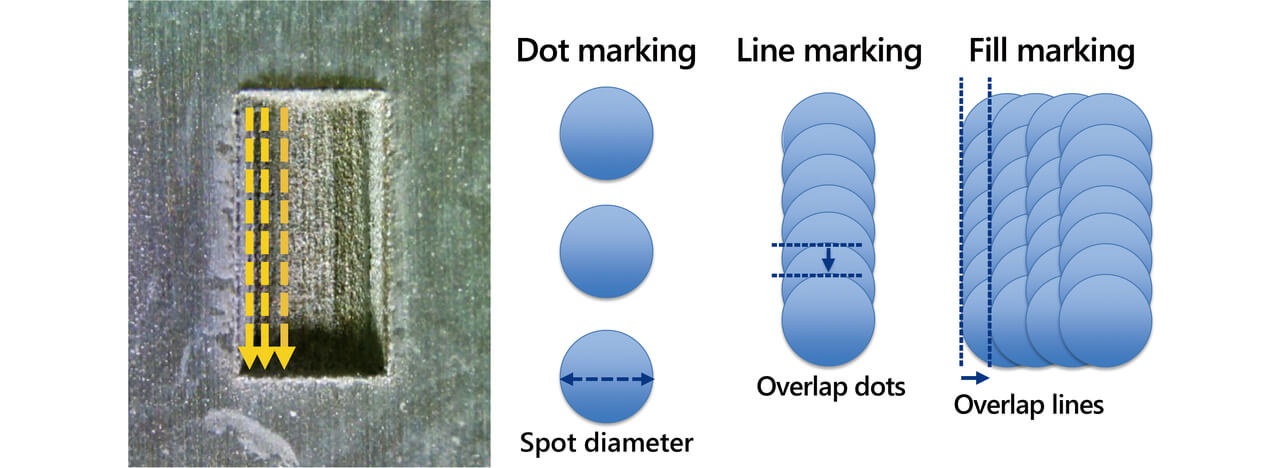
Fig. 17 shows the relationship between the number of laser marking iterations and the marking depth at the repetition frequency of 50 kHz for each material (stainless steel 304, AL, and ADC). The markings made in each material applying multi-pulses were approximately 25 times deeper than those made with single pulses. These deep markings were achieved probably as the result of the peak energy being enhanced with multi-pulsing and heat being transferred in the depth direction through nsec-level continuous laser irradiation.
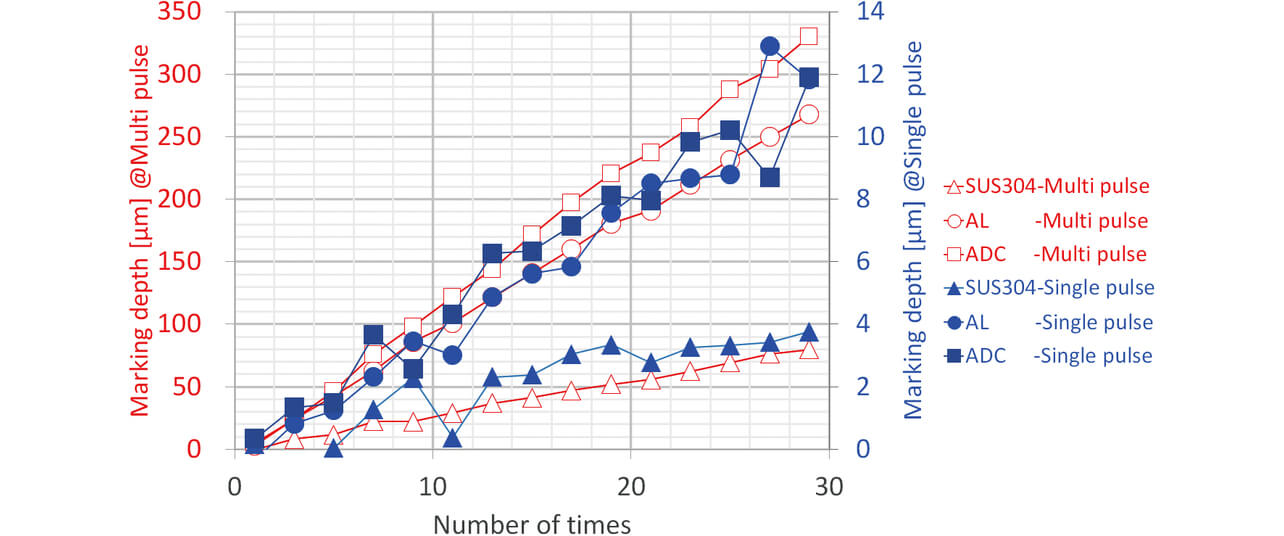
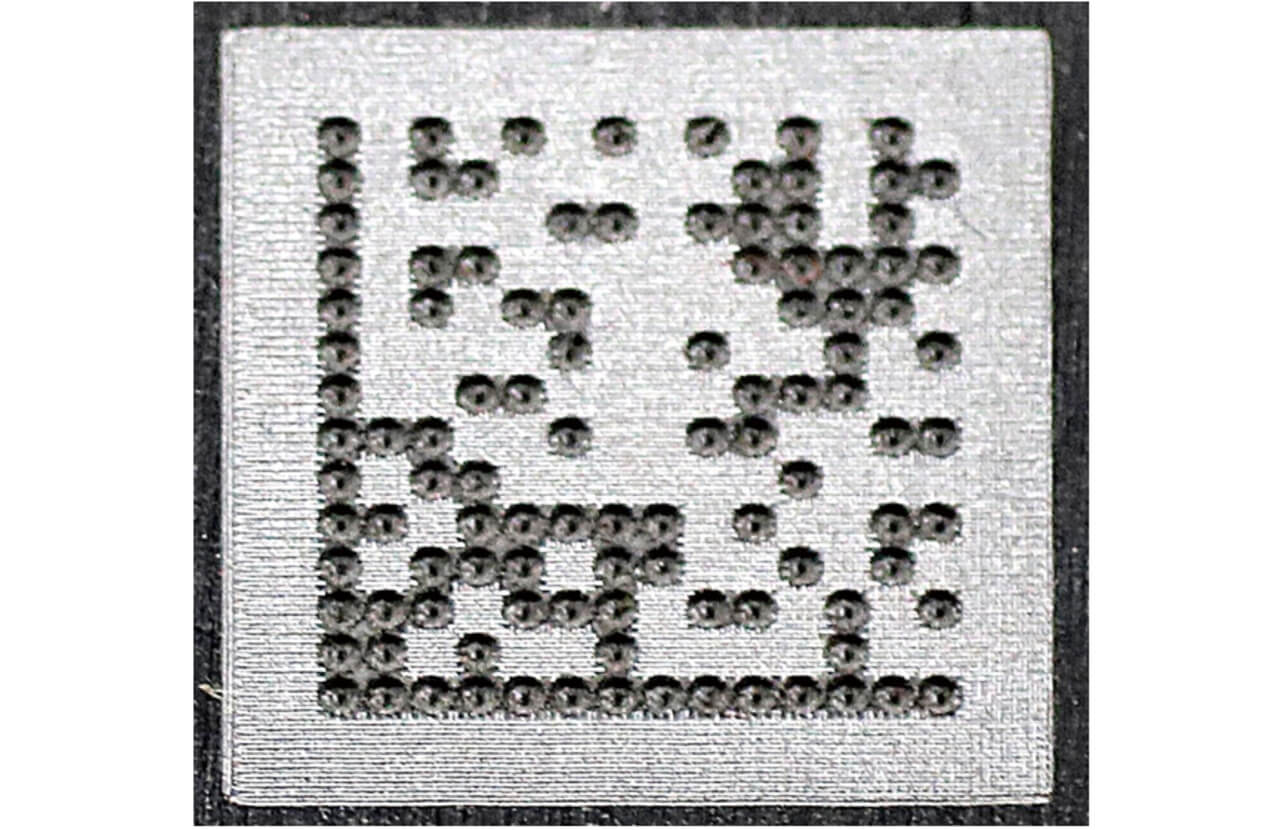
Fig. 18 shows the results of making code markings in the AL substrate (7.0 mm├Ś7.0 mm-square data matrix of 14├Ś14 cells) using the above laser marking system. Using the LVS-9585 Series Code Verification System, we checked the marking quality against the requirements specified in ISO/IEC 29158 and found that the markings met the overall grade of 4.0, the highest quality grade achievable.
5. Conclusions
Besides making high-quality, deep markings in metal in a short takt time, laser marking systems are now required to provide higher pulse energy and laser average output power while maintaining laser beam quality. The problem is that short pulse marking involves nonlinear effects, resulting in reduced beam quality.
We added multi-pulsing and input signal light control capabilities for use at low repetition frequencies to a fiber laser MOPA system to reduce the peak power to below a level free of stimulated Raman scattering (SRS) and enhance the laser average output power. As a result, we obtained approximately 25 times deeper metal markings than achievable with the conventional method.
Going forward, we will explore the possibility of achieving further power enhancement and pulse shortening to consider technologies for improving the takt time for deep metal marking.
References
- 1’╝ē
- J. A. Alvarez-Chavez, H. L. Offerhaus, J. Nilsson, P. W. Turner, W. A. Clarkson, and D. J. Richardson, ŌĆ£High-Energy, High-Power Ytterbium-Doped Q-Switched Fiber Laser,ŌĆØ Opt. Lett., vol. 25, no. 1, p. 37, 2000.
- 2’╝ē
- K. T. Vu, A. Malinowski, D. J. Richardson, F. Ghiringhelli, L. M. B. Hickey, and M. N. Zervas, ŌĆ£Adaptive Pulse Shape Control in a Diode-Seeded Nanosecond Fiber MOPA System,ŌĆØ Opt. Exp., vol. 14, no. 23, p. 10996, 2006.
- 3’╝ē
- B. Morasse, S. Chatigny, E. Gagnon, J. P. Sandro, and C. Desrosiers, Enhanced Pulse Shaping Capabilities and Reduction of Nonlinear Effects in All-Fiber MOPA Pulsed System, Photonics West, 2009, p. 71951D.
- 4’╝ē
- F. Nakano, ŌĆ£Flexible Pulse Control for Fiber Laser and Its Application to Marking and Other Processing Operations,ŌĆØ (in Japanese), Abstracts of 32nd Annual Meeting Laser Soc. Jpn., 2012, 01pV5.
The names of products in the text may be trademarks of each company.